. 2023 Jul;619(7971):828-836.
doi: 10.1038/s41586-023-06277-0. Epub 2023 Jul 12.

A framework for individualized splice-switching oligonucleotide therapy

Affiliations

A framework for individualized splice-switching oligonucleotide therapy

Jinkuk Kim et al. Nature. 2023 Jul.

Abstract

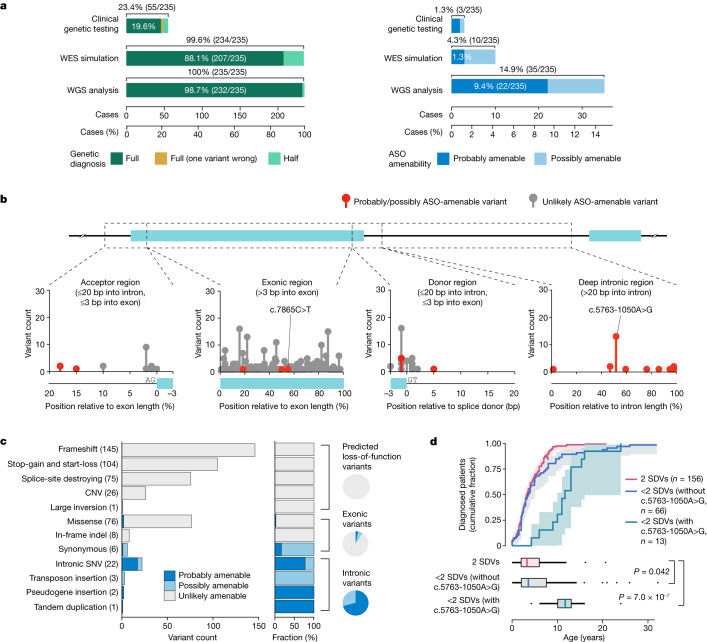
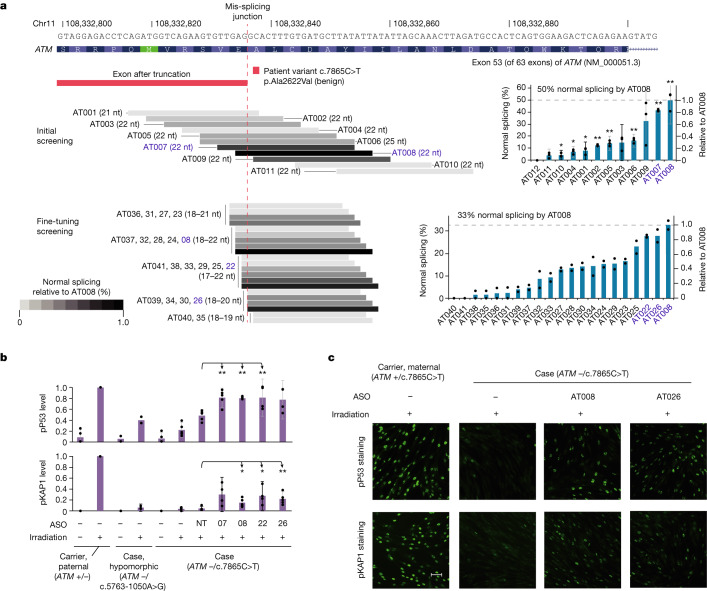
Splice-switching antisense oligonucleotides (ASOs) could be used to treat a subset of individuals with genetic diseases1, but the systematic identification of such individuals remains a challenge. Here we performed whole-genome sequencing analyses to characterize genetic variation in 235 individuals (from 209 families) with ataxia-telangiectasia, a severely debilitating and life-threatening recessive genetic disorder2,3, yielding a complete molecular diagnosis in almost all individuals. We developed a predictive taxonomy to assess the amenability of each individual to splice-switching ASO intervention; 9% and 6% of the individuals had variants that were 'probably' or 'possibly' amenable to ASO splice modulation, respectively. Most amenable variants were in deep intronic regions that are inaccessible to exon-targeted sequencing. We developed ASOs that successfully rescued mis-splicing and ATM cellular signalling in patient fibroblasts for two recurrent variants. In a pilot clinical study, one of these ASOs was used to treat a child who had been diagnosed with ataxia-telangiectasia soon after birth, and showed good tolerability without serious adverse events for three years. Our study provides a framework for the prospective identification of individuals with genetic diseases who might benefit from a therapeutic approach involving splice-switching ASOs.


Conflict of interest statement

J.K. and T.W.Y. are listed as inventors on pending patent claims (US 62/912,997) filed by Boston Children’s Hospital covering ATM splice-switching ASOs described in this study. T.W.Y. received research funding from ATCP and EveryOne Medicines, has served as a scientific consultant to Biomarin, GeneTx, Alnylam and Servier Pharmaceuticals and is a volunteer scientific advisor to several nonprofit rare disease foundations. B.M. is a co-founder, chairman and volunteer president of ATCP. J.K.T. is an employee of ATCP. A.A.P. is a Venture Partner at GV, a corporate venture group within Alphabet that invests in a number of rare disease drug development organizations, including EveryOne Medicines. The remaining authors declare no competing interests.

Figures

Fig. 1
Fig. 1. ATM disease candidate variants.
a, Diagnostic (left; green) and ASO therapeutic (right; blue) yields of clinical genetic testing, WES simulation and WGS analysis for the 235 patients in the ATCP cohort. The WES simulation assumed complete recovery of all exonic variants ± 20 bp. b, Positions of ATM disease candidate variants. All SNVs and short indels, as well as SVs that are fully contained in a single intron, are depicted. Two variants for which a splice-switching ASO was developed (c.7865C>T and c.5763-1050A>G) in this study are indicated. Deletion variants that span a splice junction were considered to be located at the junction (position 0). Short indels and SVs were considered to be located at the boundary of the variant closest to a nearby splice junction. c, Types and ASO amenability of all disease candidate variants present in the cohort. d, Cumulative fraction and box plot distribution of the age at diagnosis, based on the possession of SDVs and a known hypomorphic variant (c.5763-1050A>G). The P values (shown in the figure) were calculated through the log-rank test using the survminer R package, and were adjusted by the Bonferroni correction. Shaded areas, fraction ± 95% confidence interval. For the box plots: centre, median; lower hinge, 25th percentile; upper hinge, 75th percentile; lower whisker, smallest value greater than or equal to lower hinge − 1.5 × interquartile range (IQR); upper whisker, largest value less than or equal to upper hinge + 1.5 × IQR.
Fig. 2
Fig. 2. Taxonomy of ASO-amenable variants.
Two-step logic for classifying the amenability of genetic variants to splice modulation rescue (probably, possibly or unlikely). First, each variant is evaluated for its damaging impact on either canonical splicing or protein-coding function, on the basis of SpliceAI, MaxEntScan, LaBranchoR and REVEL. Second, each variant is evaluated for potential mis-splicing impact: gain of a splice site, exon skipping or intron retention. See Methods for complete details.
Fig. 3
Fig. 3. Probably ASO-amenable variants.
Cases indicates the number of individuals with the variant in the ATCP cohort of 235 individuals. The homozygous DUSP16 pseudogene insertion event (Supplementary Table 3) is not shown. For the full list of probably ASO-amenable variants, see Supplementary Table 9. SRE, splicing regulatory element; ΔMES, change in MaxEntScan score when a given variant is introduced.
Fig. 4
Fig. 4. Validation of ASO amenability.
ac, For four probably ASO-amenable variants for which a minigene-based splicing assay is robustly established (a, c.2839-579_2839-576del (GGTAA>G) and c.2839-581G>A; b, c.6348-986G>T; and c, c.3994-159A>G), small-scale ASO screening was performed, which showed that the mis-splicing events caused by all tested variants can be rescued by ASOs. NT, NT-22 (a non-targeting ASO). Blue asterisks, white (or black) arrows and white (or black) ‘x’ marks indicate bands validated by Sanger sequencing (orange asterisk indicates a band not validated by Sanger sequencing). ΔMES, change in MaxEntScan score when a given variant is introduced. For gel source data, see Supplementary Fig. 1.
Fig. 5
Fig. 5. Preclinical development of AT008 (atipeksen).
a, Design and screening of ASOs targeting c.7865C>T. Biologically independent experiments (independent transfections) were conducted (n = 3, initial; n = 2, fine-tuning). For some ASOs in the fine-tuning screening, the first two letters are omitted. Error bars, mean ± 95% confidence interval (shown only for conditions with n ≥ 3). A one-sample two-tailed t-test was used to assess statistical significance; means were compared to a constant value of 0 because no background normal splicing was observed in cells that were mock-transfected or transfected with non-targeting ASOs. *P < 0.05; **P < 0.01. AT010, *P = 0.0441; AT004, *P = 0.0240; AT001, *P = 0.0453; AT002, **P = 0.0010; AT005, **P = 0.0093; AT006, **P = 0.0060; AT007, **P = 0.0001; AT008, **P = 0.0082. Four top-performing ASOs (blue letters) were selected for further validation (b,c). For RT–PCR gel source data, see Supplementary Fig. 1. b, ASO-mediated restoration of irradiation-induced ATM signalling in patient fibroblasts, measured by immunoblotting. 07, 08, 22 and 26 represent AT007, AT008, AT022 and AT026, respectively; NT, NT-22 (a non-targeting ASO). pP53, phospho-P53; pKAP1, phospho-KAP1. Biologically independent experiments (independent transfections) were conducted: pP53 (n = 2, hypomorphic cases ± irradiation; n = 4, AT022, AT026; n = 5, the other conditions), pKAP1 (n = 4, AT007 and AT022; n = 5, the other conditions). Error bars, mean ± 95% confidence interval (shown only for conditions with n ≥ 3). A two-sample (comparing each condition to NT-22) two-tailed t-test was used for statistical analysis. *P < 0.05; **P < 0.01. For pP53, AT007, **P = 0.0024; AT008, **P = 0.0001; AT022, **P = 0.0471. For pKAP1, AT008, *P = 0.0201; AT022, *P = 0.0175; AT026, **P = 0.0073. Representative blot images are shown in Extended Data Fig. 8a. For blot source data, see Supplementary Fig. 1. c, ASO-mediated restoration of irradiation-induced ATM signalling in patient fibroblasts, measured by immunofluorescence staining. Scale bar, 50 μm. For a quantitative summary of the complete results, see Extended Data Fig. 8b.
Extended Data Fig. 1
Extended Data Fig. 1. A VUS in a potential ATM enhancer.
The ATM c.496+670T>G (chr11:108236504-108236504T>G) variant, identified in DDP_ATCP_368, is located in a distal enhancer-like element, as catalogued by ENCODE. The absence of this variant in both gnomAD v3.1 and TOPMed freeze 8, with an allele frequency of 0.0, is consistent with a potential pathogenic role. Declaring this variant as disease-causing could complete the genetic diagnosis for DDP_ATCP_368. However, owing to a lack of substantial evidence confirming that the enhancer-like element is functional, and that the variant disrupts its function, we have refrained from declaring this variant as a disease candidate. For more details, see Supplementary Note 2.
Extended Data Fig. 2
Extended Data Fig. 2. Disease candidate CNVs.
a, All disease candidate CNVs (26 mutational events, 25 patients including one homozygote, 10 unique variants; Supplementary Table 3). b, A recurrent (16 mutational events, 15 patients including one homozygote) CNV event, which deletes the last two ATM exons (exon 62 and 63). The deletion is found in 15 patients (DDP_ATCP_50 is homozygous). c, A recurrent (2 mutational events, 2 patients) CNV event, which deletes exon 17 through 63. Precise breakpoints of these two deletions are yet to be pinpointed. d, Two CNV events that duplicate a portion of the ATM gene, exon 17–61 and exon 53–61.
Extended Data Fig. 3
Extended Data Fig. 3. Disease candidate variant characteristics.
a, Representation of disease candidate variants in ClinVar. Total disease candidate variants (n = 469) by ClinVar interpretation category and comparison of the composition of ClinVar interpretation categories of probably/possibly ASO-amenable variants versus unlikely ASO-amenable variants are shown. 73% (343/469) of all the disease candidate mutational events had been classified in ClinVar as pathogenic or likely pathogenic, 8.7% (41/469) as conflicting interpretations of pathogenicity or uncertain significance, 0.6% (3/469) as likely benign, and 17% (82/469) had not been reported in ClinVar. We note in particular that the three likely benign mutational events (c.3489C>T, n = 1; c.2639-22_2639-20del, n = 2) have strongly predicted mis-splicing potential and have not been found in gnomAD v3.1 and TOPMed freeze 8 (Supplementary Table 1); because no other variants can explain the clinical diagnosis in the respective patients, we considered them as disease candidate variants. b, Recurrence of disease candidate variants. The recurrence distribution of disease candidate variants in 235 patients in the ATCP cohort is depicted. Homozygous variants are double-counted. The inset shows a magnified view of the dotted box region in the main graph.
Extended Data Fig. 4
Extended Data Fig. 4. Possibly ASO-amenable variants and ASO treatment groups.
a, Cases indicate the number of patients having the variant in the ATCP cohort of 235 patients. Three Alu insertion events are not depicted here. For the full list of possibly ASO-amenable variants, see Supplementary Table 9. ΔMES, change in MaxEntScan score when a given variant is introduced. b, 35 patients with A-T with ASO-amenable variants can be divided into 15 ASO treatment groups; patients in each group can be treated with the same ASO therapy.
Extended Data Fig. 5
Extended Data Fig. 5. Mis-splicing validation by minigene assay.
a, Validation of the pseudoexon inclusion effects of ASO-amenable variants, c.6348-986G>T (probably), c.2839-579_2839-576del (probably), and c.2839-581G>A (probably). b, Validation of complex mis-splicing effects (pseudoexon inclusion and exon extension) of an ASO-amenable variant, c.3994-159A>G (probably). c, Validation of exon extension effects of an ASO-amenable variant, c.6573-15T>G (possibly). d, Validation of complex mis-splicing effects (exon truncation and exon skipping) of ASO-amenable variants, c.2639-21A>G (possibly) and c.2639-22_2639-20del (possibly). e, Validation of exon skipping effects of ASO-amenable variants, c.496+5G>A (possibly) and c.2250G>A (possibly). For ae, black asterisks and black arrows indicate PCR products confirmed by gel extraction and Sanger sequencing; grey arrows indicate bands not validated by Sanger sequencing (Supplementary Table 12). REF, reference allele; ALT, alternative allele; NTC, no-template control. For gel source data, see Supplementary Fig. 1.
Extended Data Fig. 6
Extended Data Fig. 6. A patient with A-T with c.7865C>T.
a, The paternal and maternal variants of a currently six-year-old patient with c.7865C>T. Note: this case is not in the ATCP cohort and is not the same case as DDP_ATCP_520, who is a currently 20-year-old patient with c.7865C>T. The paternally inherited c.8585-13_8598del variant disrupts the canonical splice acceptor site of exon 59, leading to the skipping of exon 59 (87 nucleotides), and removes critical residues from the highly conserved PI3K/PI4K kinase domain of the ATM protein. Although it is in-frame, because the skipped region contains a critical kinase domain, it results in complete loss of function. The maternally inherited c.7865C>T variant creates a novel splice site in exon 54, leading to mis-splicing that results in an out-of-frame truncation of 64 nucleotides from the 3′ end of exon 53. b, RNA-seq analysis of the trio’s fibroblast cell lines shows the gain-of-splicing effect in exon 53 by c.7865C>T in the patient and the mother. c, RNA-seq analysis of the trio’s fibroblast cell lines shows the gain-of-splicing effect in exon 59 by c.8585-13_8598del in the patient and the father. d, Determination of the gain-of-splicing effect of c.7865C>T in the trio’s fibroblast cell lines by allele-specific PCR that is specifically designed to exclude the non-target (parental) allele. This result of the allele-specific PCR on the naive patient fibroblasts was replicated in 11 additional biologically independent experiments (n = 3, initial; n = 2, fine-tuning; n = 3, AT008 dose–response; n = 3, AT026 dose–response; Fig. 5a and Extended Data Fig. 8c). For gel source data, see Supplementary Fig. 1.
Extended Data Fig. 7
Extended Data Fig. 7. Design and screening of ASOs targeting c.7865C>T.
a, The initial and fine-tuning rounds of screening of ASOs for rescuing the mis-splicing effects of c.7865C>T in patient fibroblasts. It is depicted as in Fig. 5a, except the twelfth ASO of the initial screening round, AT012, is shown. AT012, designed to inhibit an intronic splicing silencer downstream of exon 53, showed no efficacy. b, Combined analysis of initial and fine-tuning rounds of screening for c.7865C>T. As AT008 was used in both the initial and fine-tuning rounds of screening (Fig. 5a), the ASO efficacy measurements of the two rounds were combined into a single figure by normalizing the measurements to the matched mean efficacy of AT008 of each round. All statistical information (sample size, error bar, statistical test, P value) is as in Fig. 5a, because this is a reanalysis of the data from that figure. For RT–PCR gel source data, see Supplementary Fig. 1.
Extended Data Fig. 8
Extended Data Fig. 8. Validation of ASOs targeting c.7865C>T.
a, Representative blots of immunoblotting analysis of the rescue of ATM function by the ASOs targeting c.7865C>T. Phosphorylation of P53 and KAP1 in response to irradiation-induced DNA damage. Five independent replicate experiments were performed and band intensities were quantified to generate Fig. 5b. For AT007, AT008, AT022, and AT026, “AT0” was omitted. NT represents NT-22, a non-targeting ASO. For blot source data, see Supplementary Fig. 1. b, Quantification of immunocytochemistry analysis of the rescue of ATM signalling by the ASOs targeting c.7865C>T, demonstrating recovery of P53 and KAP1 phosphorylation following treatment with AT008 and AT026. For representative micrographs, see Fig. 5c. For quantification, 10 microscope field images were taken from each of three biologically independent wells for each condition. The % positive cells of the 10 microscope field images were averaged to yield the % positive cells value for each well. Error bars, mean of the three biological replicates ± 95% confidence interval. Two-sample (comparing each condition to NT-22) two-tailed t-test was performed. *, P < 0.05; **, P < 0.01. For pP53, AT008, **P = 9.5E-7; AT026, **P = 2.5E-7. For pKAP1, AT008, **P = 5.0E-6; AT026, **P = 8.5E-8. c, Dose–response analysis of rescue of ATM mis-splicing by AT008 and AT026. NT-20 and NT-22 are non-targeting ASOs. The fraction of the intensity of the normally spliced transcript of the total intensity of the normally and abnormally spliced transcripts was calculated for each condition. Three biologically independent experiments (independent electroporations) were conducted. Error bars, mean ± 95% confidence interval. The regression curves and EC50/IC50 values were calculated by using “log(agonist) vs. response - Variable slope” model in GraphPad Prism 8. 1,000 nM concentrations of AT008 and AT026 were excluded from analysis because they showed cell-level toxicity and anomalous RT–PCR results. Representative agarose gel images are shown at the bottom of the dose–response curves. For gel source data, see Supplementary Fig. 1. d, RNA-seq analysis of the rescue of mis-splicing in patient fibroblasts by AT008 and AT026. Numbers marked in red and blue represent the number of reads that can be unambiguously determined to be originated from either paternal or maternal allele. The percentage of functional splicing was calculated by scoring the fraction of transcripts that were without exon 52/53/52-53 skipping, intron 51/52/53 retention, and exon 53 truncation. pP53, phospho-P53; pKAP1, phospho-KAP1.
Extended Data Fig. 9
Extended Data Fig. 9. A patient with A-T with c.5763-1050A>G.
a, c.5763-1050A>G in one allele of DDP_ATCP_42 creates a novel splice site that causes the out-of-frame (137 bp) inclusion of a pseudoexon and premature translation termination of ATM. c.3993+1G>A in the other allele of the patient destroys a splice donor site, which leads to the use of a cryptic splice donor site in exon 26. The resulting mis-splicing truncates 120 nt from the 3’ end of exon 26. b, RNA-seq analysis of whole-blood samples from the patient and three other patients without c.5763-1050A>G shows the pseudoexon inclusion effect between exon 38 and exon 39 by c.5763-1050A>G. c, Determination of the pseudoexon inclusion effect of c.5763-1050A>G in the patient’s fibroblast cell line by allele-specific RT–PCR that is specifically designed to exclude the non-target allele (c.3993+1G>A). Because the distance between the two ATM variants were too far (~2 kb) to distinguish the two bands representing normally and abnormally spliced products (which differ by 137 bp) on an agarose gel, a nested PCR was performed. This result of the allele-specific PCR on the naive patient fibroblasts was replicated in 7 additional biologically independent experiments (n = 3, initial; n = 2, fine-tuning; n = 4; Extended Data Fig. 10b). For gel source data, see Supplementary Fig. 1.
Extended Data Fig. 10
Extended Data Fig. 10. Design and screening of ASOs targeting c.5763-1050A>G.
a,b, The initial and fine-tuning rounds of screening of ASOs for rescuing the mis-splicing by c.5763-1050A>G. These ASOs were tested in the fibroblasts from DDP_ATCP_42 by using the allele-specific RT–PCR assay (Extended Data Fig. 9c). The positions and efficacy of the ASOs are illustrated (a, mean efficacy is represented using a grey scale; b, mean efficacy, along with a 95% confidence interval, is illustrated using bar graphs). Biologically independent experiments (independent transfections) were conducted for initial screening (n = 6, naive; n = 2, AT049, one of the three experiments was excluded from statistical analysis as it showed a highly anomalous result, Supplementary Fig. 1; n = 3, the other conditions) and fine-tuning screening (n = 3, AT046, AT059, AT060, AT063, AT064; n = 4, the other conditions). Error bars, mean ± 95% confidence interval (shown only for conditions with n ≥ 3). Two-sample (comparing each condition to NT-22) two-tailed t-test was performed for statistical analysis. *, P < 0.05; **, P < 0.01. For initial screening, AT051, **P = 0.0046; AT054, **P = 0.0058; AT050, **P = 0.0002; AT042, **P = 0.0048; AT053, **P = 0.0002; AT048, **P = 0.0004; AT045, **P = 3.3E-5; AT044, **P = 0.0003; AT047, **P = 0.0006; AT043, **P = 0.0002; AT046, **P = 0.0011. For fine-tuning screening, AT068, **P = 0.0030; AT066, **P = 0.0006; AT064, **P = 0.0006; AT065, **P = 0.0004; AT067, **P = 0.0042; AT063, **P = 0.0004; AT061, **P = 4.1E-5; AT060, **P = 3.2E-5; AT059, **P = 0.0002; AT046, **P = 2.9E-5; AT062, **P = 3.7E-5; AT043, **P = 3.6E-5; AT055, **P = 8.8E-7; AT057, **P = 2.8E-5; AT058, **P = 6.8E-5; AT056, **P = 1.6E-6. c, Combined analysis of initial and fine-tuning rounds of screening for c.5763-1050A > G. As AT043 was used in both the initial and fine-tuning screening, the ASO efficacy measurements of the two rounds were combined into a single figure by normalizing the measurements to the matched mean efficacy of AT043 of each round. All statistical information (sample size, error bar, statistical test, P value) is as in b because this is a reanalysis of the data from that panel. For ac: six top-performing ASOs (blue letters) were selected from each length group (picking one ASO from each of the 17-, 18-, 19-, 20-, 21-, and 22-mers) for further validation (Extended Data Fig. 11a,b); three ASOs (underlined in red) were subjected to additional RNA-seq validation (Extended Data Fig. 11c); for RT–PCR gel source data, see Supplementary Fig. 1.
Extended Data Fig. 11
Extended Data Fig. 11. Validation of ASOs targeting c.5763-1050A>G.
a, Representative immunoblotting results demonstrating rescue of ATM function by ASOs targeting c.5763-1050A>G. pP53, phospho-P53; pKAP1, phospho-KAP1. “AT0” was omitted in AT043, AT056, AT058, AT062, AT065, and AT067. NT represents NT-22, a non-targeting ASO. b, Quantification of the immunoblots using GAPDH as the loading control. Irradiated, control fibroblasts (ATM +/−) were used for normalization. All six tested ASOs showed comparable efficacy in restoring the phosphorylation of the two downstream effectors. Three biologically independent experiments (independent transfections) were conducted for pP53 and pKAP. Two-sample (comparing each condition to NT-22) two-tailed t-test was performed to assess the statistical significance of the means normalized to carrier case with irradiation. Error bars, mean ± 95% confidence interval. *, P < 0.05. For pKAP1, AT043, *P = 0.0386; AT056, *P = 0.0395; AT058, *P = 0.0232; AT062, *P = 0.0145; AT065, *P = 0.0447; AT067, *P = 0.0287. For a,b, for blot source data, see Supplementary Fig. 1. c, RNA-seq validation of ASOs targeting c.5763-1050A>G. RNA-seq analysis of the fibroblast cell line established from DDP_ATCP_42 shows the pseudoexon inclusion effect of c.5763-1050A>G can be mitigated by AT043, AT056, and AT057. Among the tested ASOs, AT056 showed the highest efficacy in reducing the pseudoexon inclusion, making it the lead candidate. NT-22, non-targeting ASO.
Extended Data Fig. 12
Extended Data Fig. 12. N-of-1 clinical study of AT008/atipeksen.
a, Dosing schedule and clinical protocol. EMG, electromyography; NCS, nerve conduction study. b, Cerebrospinal fluid (CSF) drug levels. c, Neurofilament light chain (NfL) and GFAP levels in serum, which are biomarkers of neuronal cell death and neuroinflammation.

Comment in

Similar articles

Cited by

References

    1. Kim J, et al. Patient-customized oligonucleotide therapy for a rare genetic disease. N. Engl. J. Med. 2019;381:1644–1652. doi: 10.1056/NEJMoa1813279. - DOI - PMC - PubMed
    1. Rothblum-Oviatt C, et al. Ataxia telangiectasia: a review. Orphanet J. Rare Dis. 2016;11:159. doi: 10.1186/s13023-016-0543-7. - DOI - PMC - PubMed
    1. Verhagen MMM, et al. Clinical spectrum of ataxia-telangiectasia in adulthood. Neurology. 2009;73:430–437. doi: 10.1212/WNL.0b013e3181af33bd. - DOI - PubMed
    1. Kaufmann P, Pariser AR, Austin C. From scientific discovery to treatments for rare diseases—the view from the National Center for Advancing Translational Sciences–Office of Rare Diseases Research. Orphanet J. Rare Dis. 2018;13:196. doi: 10.1186/s13023-018-0936-x. - DOI - PMC - PubMed
    1. Ferreira CR. The burden of rare diseases. Am. J. Med. Genet. A. 2019;179:885–892. doi: 10.1002/ajmg.a.61124. - DOI - PubMed

Substances