. 2023 Aug;620(7974):634-642.
doi: 10.1038/s41586-023-06188-0. Epub 2023 Jul 12.

Mast cells link immune sensing to antigen-avoidance behaviour

Affiliations

Mast cells link immune sensing to antigen-avoidance behaviour

Thomas Plum et al. Nature. 2023 Aug.

Abstract

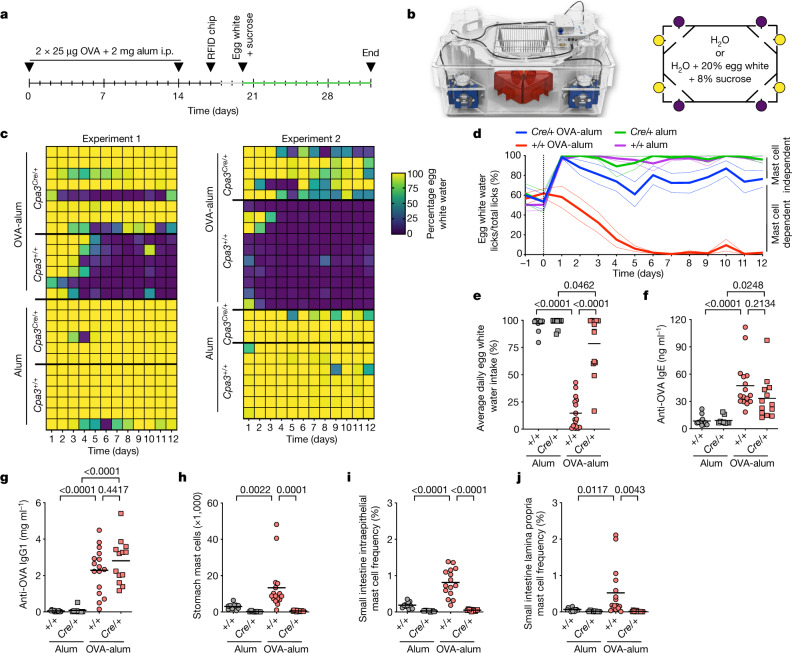
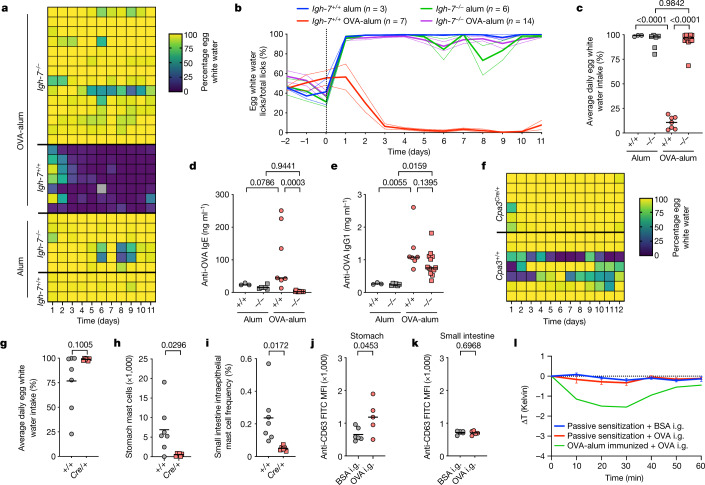
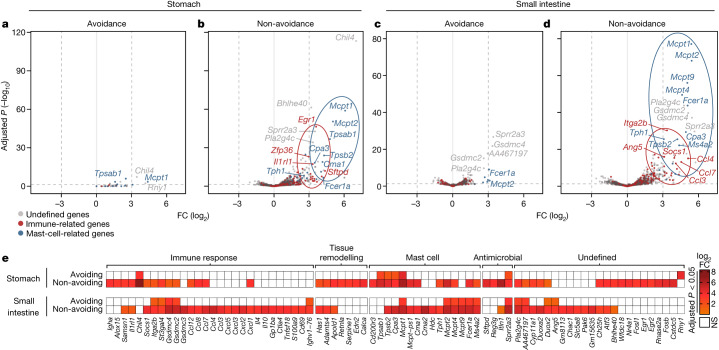
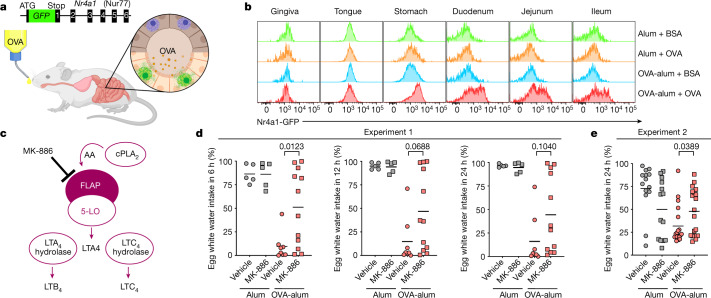
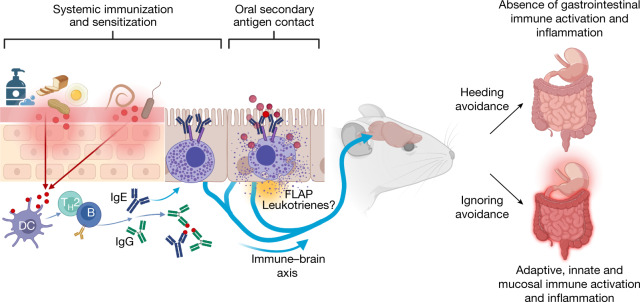
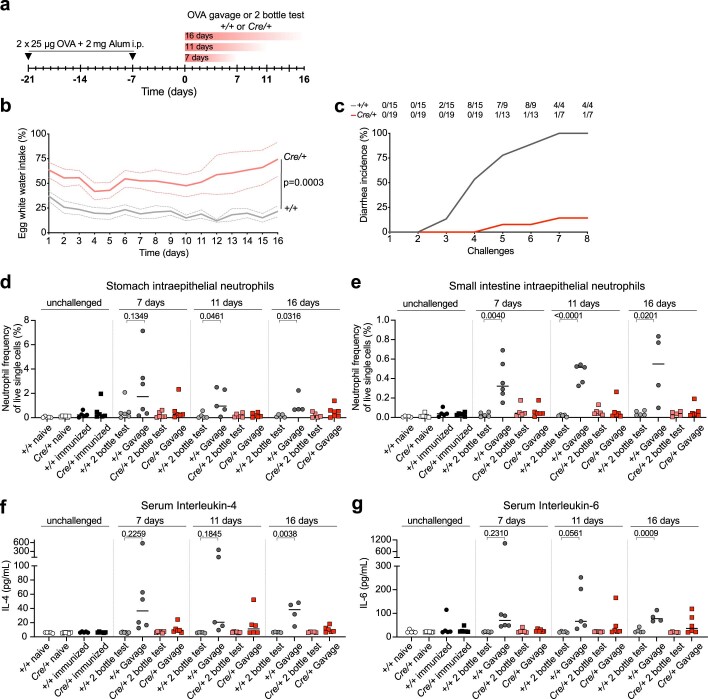
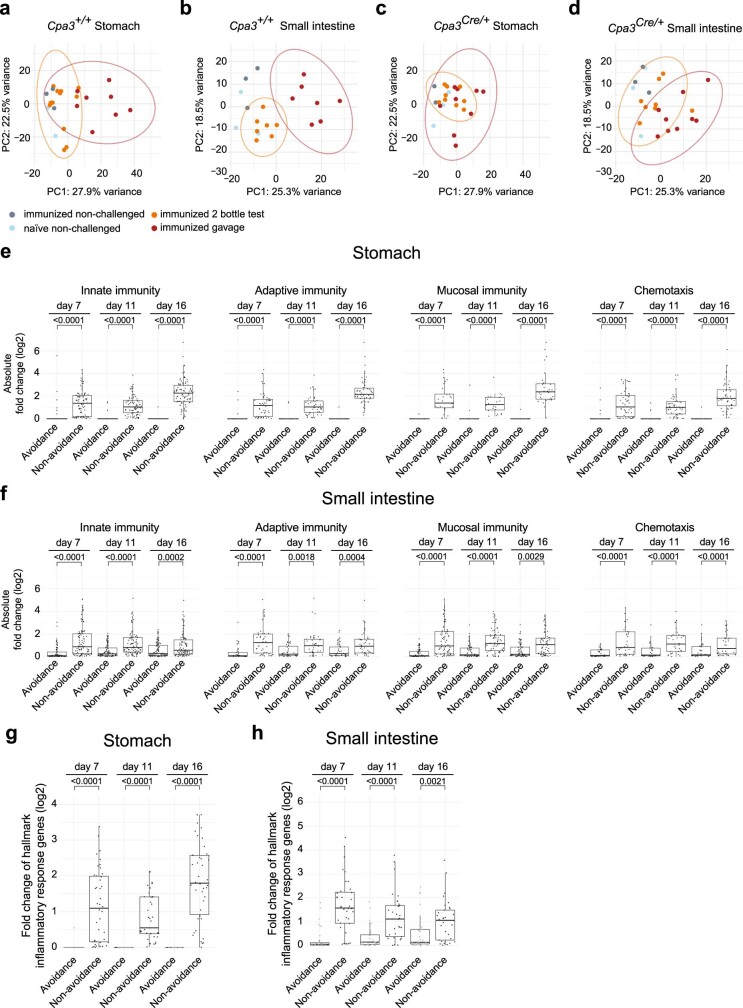
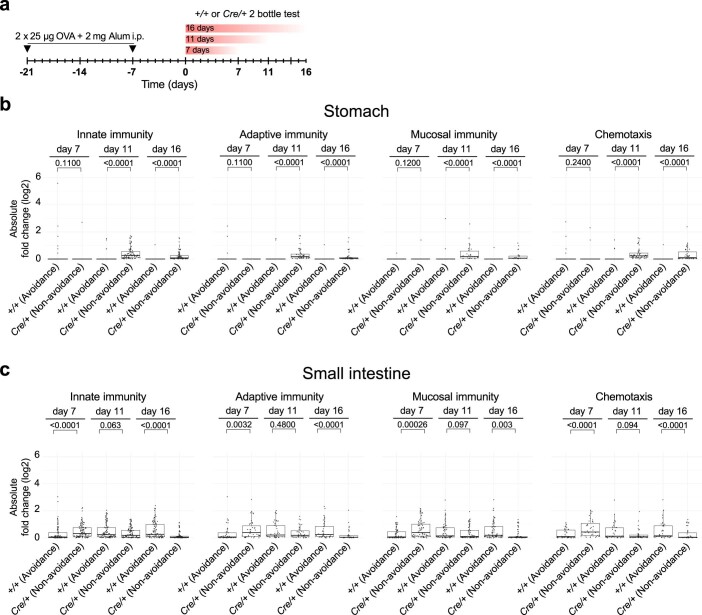
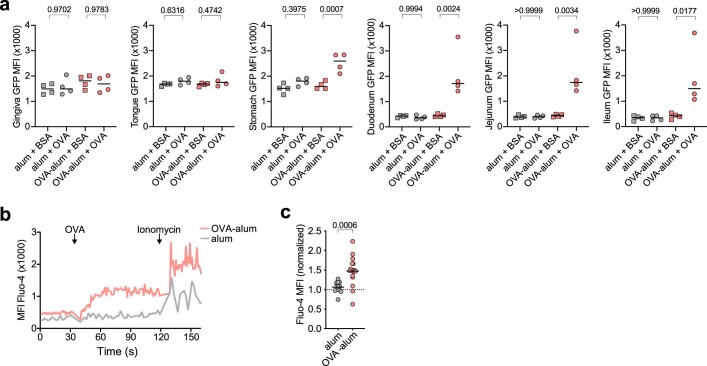
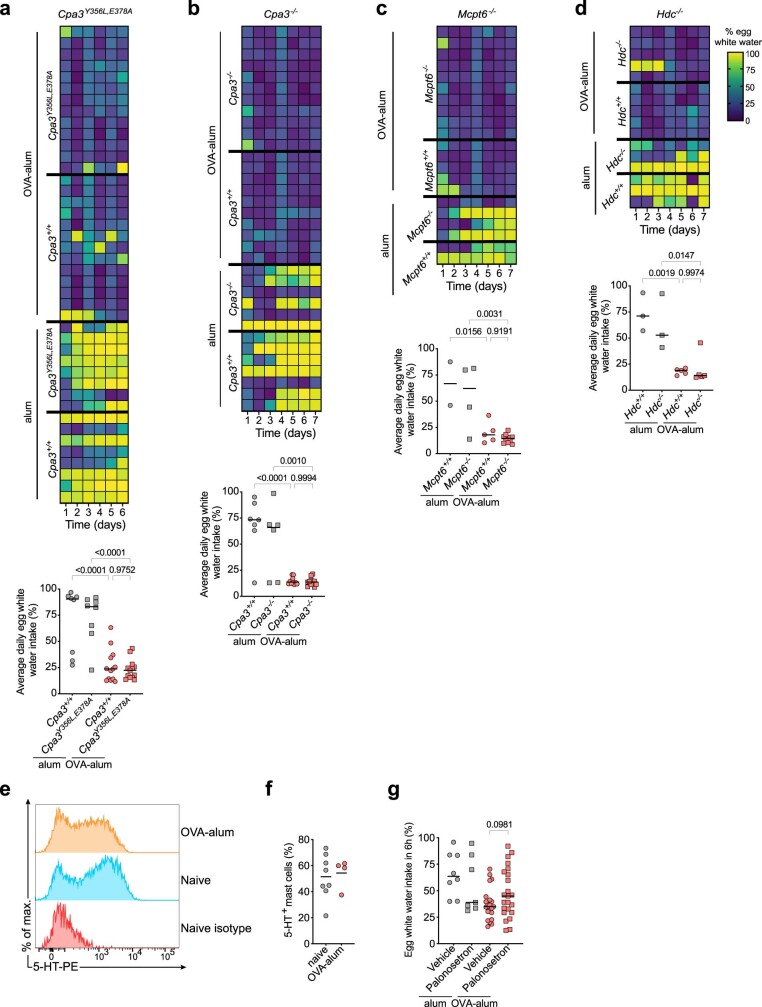
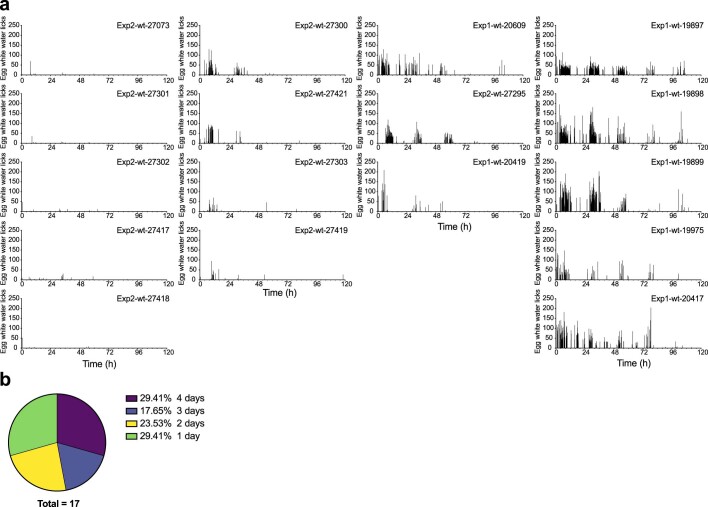
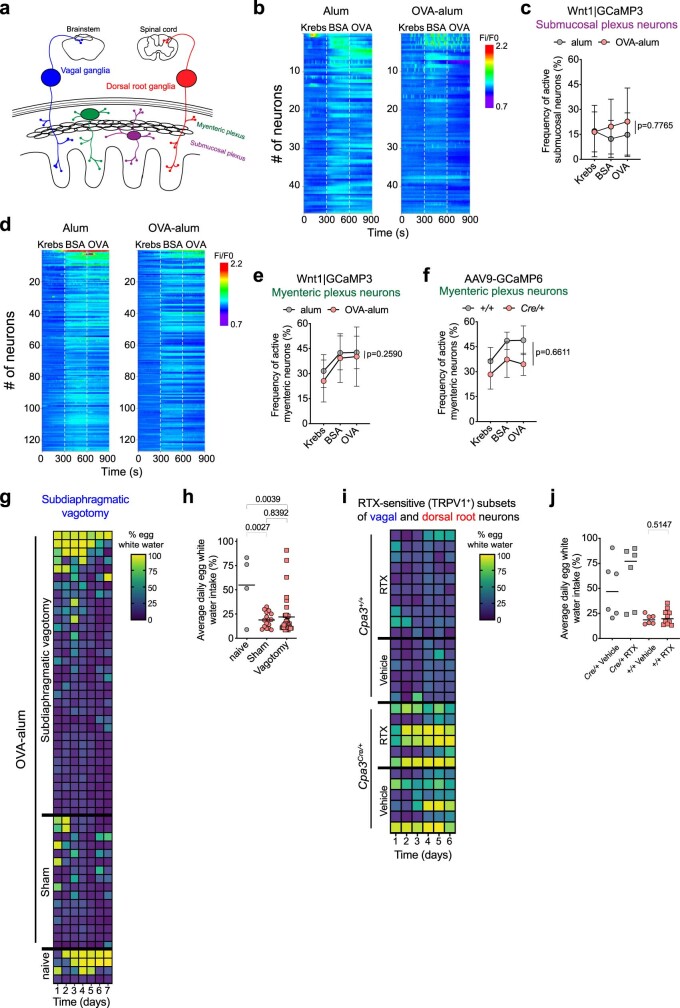
The physiological functions of mast cells remain largely an enigma. In the context of barrier damage, mast cells are integrated in type 2 immunity and, together with immunoglobulin E (IgE), promote allergic diseases. Allergic symptoms may, however, facilitate expulsion of allergens, toxins and parasites and trigger future antigen avoidance1-3. Here, we show that antigen-specific avoidance behaviour in inbred mice4,5 is critically dependent on mast cells; hence, we identify the immunological sensor cell linking antigen recognition to avoidance behaviour. Avoidance prevented antigen-driven adaptive, innate and mucosal immune activation and inflammation in the stomach and small intestine. Avoidance was IgE dependent, promoted by Th2 cytokines in the immunization phase and by IgE in the execution phase. Mucosal mast cells lining the stomach and small intestine rapidly sensed antigen ingestion. We interrogated potential signalling routes between mast cells and the brain using mutant mice, pharmacological inhibition, neural activity recordings and vagotomy. Inhibition of leukotriene synthesis impaired avoidance, but overall no single pathway interruption completely abrogated avoidance, indicating complex regulation. Collectively, the stage for antigen avoidance is set when adaptive immunity equips mast cells with IgE as a telltale of past immune responses. On subsequent antigen ingestion, mast cells signal termination of antigen intake. Prevention of immunopathology-causing, continuous and futile responses against per se innocuous antigens or of repeated ingestion of toxins through mast-cell-mediated antigen-avoidance behaviour may be an important arm of immunity.


Conflict of interest statement

The authors declare no competing interests.

Figures

Fig. 1
Fig. 1. Mast cells are essential for antigen-avoidance behaviour in type 2 immunized mice.
a,b, Type 2 immunization scheme, experimental timeline for avoidance test (a) and IntelliCage setup with bottle positioning (b). Purple symbols indicate water, yellow symbols indicate egg white water with sucrose. c, Egg white water preferences of alum-immunized and OVA-alum-immunized BALB/c Cpa3+/+ and Cpa3Cre/+ mice displayed as percentage of egg white water intake over total water intake (colour scale indicates percentages) during the course of experiments 1 and 2. Each row corresponds to an individual mouse. d, Egg white water preference displayed as number of egg white water licks over total number of water licks versus time. Data are presented as mean ± s.e.m. e, Egg white water preference displayed as the fraction of egg white water intake over total water intake as an average per day for the duration of the experiment. f,g, Serum amounts of anti-OVA IgE (f) and anti-OVA IgG1 (g) measured at the end of the IntelliCage experiments. hj, Absolute numbers of stomach mast cells (h), frequencies of small intestine intraepithelial mast cells (i) and small intestine lamina propria mast cells (j) among total live cells, measured at the end of the IntelliCage experiments. Bars represent mean values, and each dot corresponds to a single mouse. In cj, Cpa3+/+ alum (n = 13 mice for ch, n = 12 for i and n = 13 for j); Cpa3+/+ OVA-alum (n = 16 mice for ch, n = 15 for i and n = 16 for j); Cpa3Cre/+ alum (n = 9 mice for ch, n = 7 for i and n = 9 for j); Cpa3Cre/+ OVA-alum (n = 13 mice for ch, n = 11 for i and n = 13 for j). Statistical analysis was performed using one-way analysis of variance with Tukey multiple-comparison test (ej). Exact P values are shown. i.p., intraperitoneal. Source data
Fig. 2
Fig. 2. Role of IgE in immunity of avoidance.
ac, Egg white water preference of alum-immunized and OVA-alum-immunized BALB/c Igh-7+/+ and Igh-7−/− mice displayed as percentage of egg white water intake over total water intake (colour scale indicates percentages) during the course of the IntelliCage experiment (a). Each row corresponds to an individual mouse. The grey field indicates a mouse that had lost the transponder for 1 day, precluding measurement. b, Data from a displayed as egg white water licks over total water licks versus time. Data are presented as mean ± s.e.m. c, Data from a displayed as the fraction of egg white water intake over total water intake as an average per day for the duration of the experiment. d,e, Serum amounts of anti-OVA IgE (d) and anti-OVA IgG1 (e) at the end of the experiment. f,g, BALB/c Cpa3+/+ and Cpa3Cre/+ mice received mouse anti-OVA monoclonal IgE antibody on days 0 and 9 and were subjected to the avoidance test (IntelliCage as in Fig. 1b) starting on day 10 (Methods). f, Egg white water preference is displayed as in a. Each row represents an individual mouse. g, Egg white water preference is displayed as in c. h,i, Absolute numbers of stomach mast cells (h) and frequency of small intestine intraepithelial mast cells (i) among total live cells at the end of the experiment. j,k, CD63 expression, an indicator of mast cell activation, on stomach (j) and small intestine intraepithelial (k) mast cells from IgE-sensitized BALB/c Cpa3+/+ mice after intragastric gavage (i.g.) with OVA or control protein (BSA). l, Rectal temperatures after indicated challenges in IgE-sensitized (passive sensitization) or OVA-immunized (OVA-alum) BALB/c mice. Data are presented as mean ± s.e.m. For ae, Igh-7+/+ alum (n = 3 mice); Igh-7+/+ OVA-alum (n = 7); Igh-7−/− alum (n = 6); Igh-7−/− OVA-alum (n = 14). For fi, Cpa3+/+ (n = 7); Cpa3Cre/+ (n = 6). For jl, Cpa3+/+ IgE/BSA (n = 6); Cpa3+/+ IgE/OVA (n = 5); Cpa3+/+ OVA-alum/OVA (n = 2). Statistical analysis was performed using one-way analysis of variance with Tukey multiple-comparison test (ce) and two-sided Student’s t tests (gk). Exact P values are shown. MFI, mean fluorescence intensity. Source data
Fig. 3
Fig. 3. Antigen avoidance prevents immune activation and inflammation in gastrointestinal tissues.
ad, Volcano plots of DEG in stomach (a,b) and small intestine (c,d) tissues comparing avoiding mice (7-day two-bottle test; stomach n = 4, intestine n = 3) with mice receiving only water (stomach n = 2, intestine n = 3) (a,c) and non-avoiding mice (7-day gavage; stomach n = 3, intestine n = 3) with mice receiving only water (stomach n = 2, intestine n = 3) (b,d). The experimental outline is shown in Extended Data Fig. 4a. Red dots represent genes associated with immunity-related GO terms (Methods and Extended Data Fig. 5e, f). Blue dots represent manually annotated mast cell genes. e, Heatmaps of log2 fold change in gene expression in stomachs and small intestines of mice under avoidance and non-avoidance conditions on day 7. Genes shown are taken from b and d, satisfying log2 fold change >3 and P ≤ 0.05. Fold changes are indicated by scale: white indicates a gene not significantly regulated. All data are from wild-type BALB/c mice. Statistical comparisons were done using the DESeq2 package (Methods). P values were adjusted for multiple comparisons using the Benjamini–Hochberg algorithm. FC, fold change; NS, not significant.
Fig. 4
Fig. 4. In situ tracing of mast cell activation and role of FLAP in antigen avoidance.
a, Model for detection of FcεRI-activated mast cells using the Nr4a1-GFP reporter allele. In vivo OVA-responsive mast cells expressed GFP. b, (BALB/c x C57BL/6)F1 Nr4a1-GFP mice immunized with OVA-alum or alum only were given drinking water with OVA or BSA (Methods). Representative histograms (for data shown in Extended Data Fig. 7a) of GFP expression in tissue mast cells isolated ex vivo after drinking OVA- or BSA-containing water for 3 h. c, Model displaying the generation of leukotrienes and FLAP inhibition by MK-886. d,e, BALB/c wild-type mice were immunized with OVA-alum (as in Fig. 1a), and, 1 h before the IntelliCage (d), or two-bottle (e) test, mice were treated with PBS or MK-886 (Methods). Preference is displayed as the fraction of egg white water intake over total water intake for 6, 12 or 24 h. Bars represent mean values, and each dot corresponds to a single mouse. Alum vehicle (n = 5 mice), alum MK-886 (n = 5), OVA-alum vehicle (n = 8), OVA-alum MK-886 (n = 12) (d), alum vehicle (n = 14), alum MK-886 (n = 14), OVA-alum vehicle (n = 19), OVA-alum MK-886 (n = 19) (e). Statistical analysis was performed by two-sided Student’s t tests in d and e. Exact P values are shown. AA, arachidonic acid. Figure 4a created with BioRender.com. Source data
Fig. 5
Fig. 5. Mast cells and IgE promote immunity of avoidance.
Model of mast-cell-mediated avoidance behaviour in the framework of type 2 immunity. Barrier damage facilitates entry of antigens (for instance, occupational and innocuous proteins such as those from flour, eggs or peanuts, as well as from pathogens), leading to a type 2 immune response. Adaptive immunity generates specific IgG and IgE antibodies towards antigen neutralization. Antigen-specific IgE binds to mast cells, which, on reencounter with antigens, signal avoidance behaviour. Inhibition of FLAP-dependent leukotrienes impairs avoidance, indicating that this mediator may contribute to the immune–brain axis. Mice avoiding antigen (heeding avoidance) are largely protected from developing gastrointestinal immune activation and inflammation, which occur when avoidance is ignored. Immunity of avoidance is dependent on the presence of mast cells and IgE (not shown). B, B cell; DC, dendritic cell. Created with BioRender.com.
Extended Data Fig. 1
Extended Data Fig. 1. Anxiety and general behavioral tests of mast cell-deficient Cpa3Cre/+ mice.
C57BL/6 Cpa3+/+ and Cpa3Cre/+ mice were analyzed for behavioral deficits by elevated plus maze (a–d), open field (e–i), light dark chamber (j–m), and home cage monitoring (n–s). a. Model of the elevated plus maze. 300 s of behavior were digitally recorded, and automatically tracked using Sygnis tracker software. b, Time spent in middle, open, or closed arms of the plus maze. c, Number of visits into each arm. d, Run distance of mice within each arm. e, Model of the open field arena. 600 s of behavior were digitally recorded, and automatically tracked using ANY-maze video-tracking system. f, Number of outer zone entries. g, Time spent in outer zone as percentage of total observation time. h, Total run distance. i, Time spent immobile or mobile. j, Model of the light-dark box. 600 s of behavior were digitally recorded, and automatically tracked using Sygnis tracker software. k, Time delay for mice for first entrance into the dark area. l, Number of visits into the lit area. m, Time spent in outer zone as percentage of total observation time. The bars represent the mean values, and each dot is a single mouse (n = 6 mice in b–m). n–s, Laboras home cage monitoring results are depicted in (n) run distance, (o) climbing duration, (p) duration of resting, (q) grooming duration, (r) run speed, and (s) maximal run speed in one-hour bins over 24-hour observation periods. Day and night phases are shaded white and grey, respectively. The bars represent the mean values (± SD), and each dot is a single mouse (n = 9 mice for n–s). Source data
Extended Data Fig. 2
Extended Data Fig. 2. Antigen avoidance behavior independent of basophils.
a Basophil-deficient BALB/c Mcpt8-Cre, and BALB/c wild-type control (+/+) mice were immunized as in Fig. 1a, and analyzed in the two-bottle test. Egg white water preference of alum or OVA-alum immunized mice is displayed as percent egg white water intake over total water intake (color scale indicates percentages) over the course of the experiment. Each row is an individual mouse. b, Egg white water preference displayed as the fraction of egg white water intake over total water intake as an average per day for the duration of the experiment. c, Flow cytometric analysis of basophils in peripheral blood from the indicated mice. Red blood cell-lysed blood cells were stained for expression of CD49b versus IgE. Numbers in the gate indicate percentages of basophils among live CD45+CD90.2CD11cGr-1Siglec-FMHCIIB220 cells. d, Absolute numbers of basophils in peripheral blood from the indicated mice. Basophils were detected as in c, and total numbers calculated (Methods). e,f,g,h, Absolute numbers of stomach mast cells (e), and frequencies of small intestine intraepithelial mast cells among total live cells (f), and serum amounts of anti-OVA IgG1 (g), and anti-OVA IgE (h) at the end of the experiment. The bars represent mean values, and each dot a single mouse. +/+ alum (n = 5 mice for a,b, e–h, n = 11 for d), Mcpt8-Cre alum (n = 7 mice for a,b, e–h, n = 9 for d), +/+ OVA-alum (n = 12 mice for a,b, e–h, n = 11 for d), Mcpt8-Cre OVA-alum (n = 9 mice for a,b, e–h, n = 8 for d). Statistical analysis was performed using one-way ANOVA with Tukey multiple-comparison test (b,d–h). The exact P values are shown. Source data
Extended Data Fig. 3
Extended Data Fig. 3. Type 2 cytokines enhance antigen avoidance behavior.
a,b,c. IntelliCage drink avoidance experiments with alum and OVA-alum immunized C57BL/6 Cpa3+/+ (+/+) and Cpa3Cre/+ (Cre/+) mice displayed as percent egg white water intake over total water intake for the course of the experiments. Each row is an individual mouse. a, Mice given free choice between water, and 20% egg white water with 1% sucrose. +/+ alum (n = 3 mice); +/+ OVA-alum (n = 8); Cre/+ alum (n = 5); Cre/+ OVA-alum (n = 7). b, Mice given free choice between water, and 20% egg white water with 0.25% sucrose. +/+ alum (n = 3 mice); +/+ OVA-alum (n = 7); Cre/+ alum (n = 3); Cre/+ OVA-alum (n = 6). c, Mice received two intraperitoneal injections of a cytokine cocktail consisting of IL-3, anti-mouse IL-3, IL-4, anti-mouse IL-4 and IL-9 (cocktail abbreviated as IL-3/4/9) on days 2 and 16 prior to the avoidance test as in (b). +/+ alum (n = 2 mice); +/+ OVA-alum (n = 9); Cre/+ alum (n = 3); Cre/+ OVA-alum (n = 6). d,e,f, Egg white water preferences (from a,b,c) displayed as the fraction of egg white water intake over total water intake as an average per day for the duration of the experiment. g,h,i, At the end of the experiment, OVA-alum immunized mice from a–c were analyzed for serum amounts of anti-OVA IgE (g), and absolute numbers of stomach- (h), and percentages of small intestine intraepithelial mast cells among total live cells (i). +/+ 1% sucrose (n = 8 mice), Cre/+ 1% sucrose (n = 7), +/+ 0.25% sucrose (n = 7), Cre/+ 0.25% sucrose (n = 6), +/+ 0.25 sucrose + IL3/4/9 (n = 9), Cre/+ 0.25% sucrose + IL3/4/9 (n = 6) (g–i). j,k,l,m, C57BL/6 Nr4a1-GFP mice were OVA-alum immunized. Type 2 immunization scheme and experimental timeline (j). k,l, On day 21 mice received OVA or BSA via intragastric gavage (i.g). After 2 h, GFP expression in stomach mast cells (k), and small intestine intraepithelial mast cells (l) were analyzed by flow cytometry. m, On day 21, mice received OVA/BSA by intragastric gavage or by intravenous injection. Body temperature of mice was monitored via rectal thermometer. BSA i.g. (n = 5) (k–m); OVA i.g. (n = 5) (k–m); BSA i.v.(n = 4) (m); OVA i.v. (n = 5) (m). Horizontal bars represent the mean values, and each dot represents a single mouse (d-i; k,l). Data are mean (± SEM) in (m). Statistical analysis was performed using one-way ANOVA with Tukey multiple-comparison test for (di), and two-sided students t-tests for (k,l). The exact P values are shown. Source data
Extended Data Fig. 4
Extended Data Fig. 4. Ignoring avoidance results in local and systemic inflammation.
a, Experimental timeline of immunization, two-bottle test, and intragastric gavage. Groups of Cpa3+/+ (+/+) and Cpa3Cre/+ (Cre/+) mice were immunized, challenged, and analyzed as indicated in the figure. b, Egg white water intake in mice subjected to the two-bottle test. Total numbers of mice at the start of the experiment were n = 16 (+/+) and n = 17 (Cre/+). Data are mean (± SEM). Groups of mice were sacrificed on day 7 (+/+ n = 6; Cre/+ n = 6), day 11 (+/+ n = 5; Cre/+ n = 6), and day 16 (+/+ n = 5; Cre/+ n = 5) for RNA-sequencing (Fig. 3; Extended Data Fig. 5, 6) and for analyses shown in d–g. c, Diarrhea incidence of +/+ and Cre/+ mice on the indicated OVA gavage regimen (Methods). Total numbers of mice at the start of the experiment were n = 15 (+/+) and n = 19 (Cre/+). After 4 times gavage(day 7) n = 6 (+/+) and n = 6 (Cre/+), after 6 times gavage (day 11) n = 5 (+/+) and n = 6 (Cre/+), and after 8 times gavage (day 16) n = 4 (+/+) and n = 7 (Cre/+)mice were sacrificed for RNA-sequencing (Fig. 3; Extended Data Fig. 5) and for analyses shown in d–g. d,e, Quantification of stomach neutrophils (d), and small intestine intraepithelial neutrophils (e) of animals from the indicated experimental groups and time points (a). f,g, Quantification of serum levels of IL-4 (f), and IL-6 (g) for the indicated experimental groups and time points (a). Control mice were naive (+/+ n = 5; Cre/+ n = 6) or immunized (+/+ n = 5; Cre/+ n = 6) but unchallenged (dg). The bars represent mean values (d–g), and each dot a single mouse with n = 4-6 for all groups. Statistical analysis was performed using two-way ANOVA for (b), and two-sided students t-tests for (dg). The exact P values are shown. Source data
Extended Data Fig. 5
Extended Data Fig. 5. Transcriptional analysis of gastrointestinal tissues under conditions of avoidance versus non-avoidance in BALB/c mice.
a–d, Principal component analysis considering the 500 most variable genes in (a,c) stomach- and (b,d) small intestine tissue bulk RNA-Seq data of BALB/c Cpa3+/+ and Cpa3Cre/+ mice undergoing the experiment outlined in Extended Data Fig. 4a. The clustering of the samples per experimental condition attests reproducibility between mice. e,f, For experimental outline, see Extended Data Fig. 4a. Stomach (e) and small intestine (f) were analyzed by RNA sequencing on the indicated days. Based on log2Foldchange-ranked gene lists, gene set enrichment analysis revealed a strong contribution of immunological Gene Ontology (GO)-terms. We annotated these GO terms according to their description into 4 subgroups: “adaptive immunity”, “innate immunity”, “mucosal immunity” and “chemotaxis” (Supplementary Table 1). The underlying most impactful “core enrichment genes” (Methods) for each GO-term were categorized according to these immunological subgroups (Supplementary Table 2). Shown are absolute log2Foldchanges of core enrichment genes contained in significantly enriched immune-related GO-pathways for stomach (e) and small (f) intestine tissues of avoiding (two-bottle test) and non-avoiding (OVA gavage) mice. Genes were annotated manually as ‘innate immunity’, ‘adaptive immunity’, ‘mucosal immunity’, and ‘chemotaxis’. g,h, Log2Foldchanges of ‘Hallmark inflammatory response’ genes in stomach (g) and small intestine (h) tissues of avoiding (two-bottle test) and non-avoiding (OVA gavage) wild-type mice. Boxplots (e–h) show median and quantiles. Statistical analysis was performed using two-sided Wilcoxon-rank-sum tests for (e–h). Numbers of mice in a–d were (a) Cpa3+/+ stomach naive non-challenged (n = 2), immunized non-challenged (n = 3), immunized gavage (n = 8), immunized two-bottle test (n = 12); (b) Cpa3+/+ small intestine naive non-challenged (n = 3), immunized non-challenged (n = 3), immunized gavage (n = 7), immunized two-bottle test (n = 7), (c) Cpa3Cre/+ stomach naive non-challenged (n = 3), immunized non-challenged (n = 2), immunized gavage (n = 9), immunized two-bottle test (n = 9); (d) Cpa3Cre/+ small intestine naive non-challenged (n = 3), immunized non-challenged (n = 3), immunized gavage (n = 9), immunized two-bottle test (n = 8). Numbers of mice in e–h were (e,g) Cpa3+/+ stomach immunized non-avoidance (gavage) day 7 (n = 3), day 11 (n = 2), day 16 (n = 3), immunized avoidance (two-bottle test) day 7 (n = 4), day 11 (n = 4), day 16 (n = 4) (data pooled per group and compared to reference immunized non-challenged (n = 3)), (f,h) Cpa3+/+ small intestine immunized non-avoidance (gavage) day 7 (n = 3), day 11 (n = 2), day 16 (n = 2), immunized avoidance (two-bottle test) day 7 (n = 3), day 11 (n = 2), day 16 (n = 2) (data pooled per group and compared to reference immunized non-challenged (n = 3)). For numbers of genes in e,f, (log2FoldChange <−1 or log2FoldChange >1.5 in at least one comparison), see Supplementary Table 1. For numbers of genes in g,h, see Supplementary Table 4. e–h, Box boundaries delineate the 1st and 3rd quartiles of the data, the center line represents the median, whiskers represent the furthest points within 1.5× the interquartile range.
Extended Data Fig. 6
Extended Data Fig. 6. Mast cell-independent gastrointestinal inflammation.
a, Experimental timeline of immunization and two-bottle test (Methods). b,c, Absolute fold changes of core-enrichment genes contained in immune-related GO-pathways (Methods) for stomach (b) and small intestine (c) tissues of avoiding Cpa3+/+ and non-avoiding Cpa3Cre/+ mice from the two-bottle test. Genes were grouped into the manually curated categories ‘innate immunity’, ‘adaptive immunity’, ‘mucosal immunity’, and ‘chemotaxis’. Boxplots show median and quantiles. Statistical analysis was performed using two-sided Wilcoxon-rank-sum tests (b,c). Numbers of mice in b,c were (b) Cpa3Cre/+ stomach immunized non-avoidance (gavage) day 7 (n = 3), day 11 (n = 3), day 16 (n = 3), immunized avoidance (two-bottle test) day 7 (n = 3), day 11 (n = 3), day 16 (n = 3) (data pooled per group and compared to reference immunized non-challenged (n = 2)), (c) Cpa3Cre/+ small intestine immunized non-avoidance (gavage) day 7 (n = 3), day 11 (n = 3), day 16 (n = 3), immunized avoidance (two-bottle test) day 7 (n = 3), day 11 (n = 3), day 16 (n = 2) (data pooled per group and compared to reference immunized non-challenged (n = 3)). For numbers of genes in b,c, (log2FoldChange <−1 or log2FoldChange >1.5 in at least one comparison), see Supplementary Table 1. b,c, Box boundaries delineate the 1st and 3rd quartiles of the data, the center line represents the median, whiskers represent the furthest points within 1.5× the interquartile range.
Extended Data Fig. 7
Extended Data Fig. 7. Freshly isolated stomach mast cells respond to OVA in vitro by intracellular Ca2+ flux.
a, (BALB/c x C57BL/6)F1 Nr4a1-GFP mice immunized with OVA-alum, or alum only, were given drinking water with OVA or BSA (Methods). GFP mean fluorescence intensity (MFI) of tissue mast cells (n = 4 for each group) isolated 3 h after mice consumed OVA- or BSA-containing water. b, Representative traces of Fluo-4 fluorescence (indicating intracellular Ca2+ concentration) in stomach mast cells from OVA-alum or alum immunized mice. Cells were stimulated with OVA and ionomycin at the indicated times (arrows). c, Quantification of Fluo-4 mean fluorescence intensity (as in b), normalized to the first 30 s of measurement (set as 1.0) (see Methods), comparing mast cells from OVA-alum and alum immunized mice. OVA-alum (n = 17), alum (n = 13). Statistical analysis was performed by one-way ANOVA with Tukey multiple-comparison test for (a), and two-sided students t-tests for (c). The exact P values are shown. Source data
Extended Data Fig. 8
Extended Data Fig. 8. Avoidance behavior after genetic- or pharmacologic blockade of mast cell mediators.
a–d, BALB/c mice lacking mast cell proteases (a,b,c), or histidine decarboxylase (d) were immunized as described in Fig. 1a. Egg white water preference is displayed as the fraction of egg white water intake over total water intake per day for the duration of the two-bottle test (heatmap; each row is an individual mouse), and displayed as average fraction of egg white water intake over total water intake for the entire experiment (lower panels). Mutant mice were Cpa3Y356L,E378A (a), Cpa3−/− mice (b), Mcpt6−/− mice (c), and Hdc−/− mice (d). Cpa3+/+ alum (n = 8 mice), Cpa3Y356L,E378A alum (n = 8), Cpa3+/+ OVA-alum (n = 13), Cpa3Y356L,E378A OVA-alum (n = 13) (a); Cpa3+/+ alum (n = 7 mice), Cpa3−/− alum (n = 6), Cpa3+/+ OVA-alum (n = 10), Cpa3−/− OVA-alum (n = 11) (b); Mcpt6+/+ alum (n = 2 mice), Mcpt6−/− alum (n = 4), Mcpt6+/+ OVA-alum (n = 5), Mcpt6−/− OVA-alum (n = 10) (c); Hdc+/+alum (n = 3 mice), Hdc−/− alum (n = 3), Hdc+/+ OVA-alum (n = 5), Hdc−/− OVA-alum (n = 5) mice (d). e,f, Stomach mast cells of naive wild-type BALB/c mice (naive) and OVA-alum immunized wild-type BALB/c mice (OVA-alum) were stained intracellularly with anti-5-HT-specific or isotype control antibodies, and analyzed by flow cytometry (Methods). Histograms (representative for data in f) of intracellular 5-HT or isotype antibody staining (e), and frequencies of 5-HT+ stomach mast (f) are shown. Naive (n = 8 mice), OVA- alum (n = 4) (f). g, BALB/c wild-type mice were immunized with OVA-alum, and 12 h prior to the two-bottle test mice were treated with PBS or palonosetron (Methods). Displayed are percentages of egg white water intake per total water intake over 6 h. Alum vehicle (n = 8 mice); alum palonosetron (n = 7); OVA-alum vehicle (n = 21); OVA-alum palonosetron (n = 23) (g). The bars (a–d, f,g) represent the mean values, and each dot is a single mouse. Statistical analysis was performed using one-way ANOVA with Tukey multiple-comparison test (a–d), and two-sided students t-test for (g). The exact P values are shown. Source data
Extended Data Fig. 9
Extended Data Fig. 9. Kinetics of OVA avoidance.
a, Time-resolved egg white water lick counts of wild-type BALB/c mice (data taken from Fig. 1c, experiments 1 and 2). Egg white water licks of individual wild-type mice were recorded over the course of 12 days in the IntelliCage system, the first 120 h are shown. The experiment and mouse ID are stated in the top right corner of each graph (n = 17). b, Pie chart showing the distribution of the onset of egg white water avoidance in days in wild-type mice. Source data
Extended Data Fig. 10
Extended Data Fig. 10. Enteric-, vagal-, and Trpv1-expressing neurons not involved in antigen avoidance.
a, Model for gut-brain signaling pathways. Extrinsic vagal ganglion and dorsal root ganglion neurons signal from gut to brainstem and spinal cord, respectively. Intrinsic primary afferent neurons reside within submucosal and myenteric plexi. b–e, Microscopic recordings of submucosal plexus (b,c), myenteric plexus (d,e) neuron Ca2+ transients in full thickness gut preparations of alum and OVA-alum immunized Wnt1|GCaMP3 mice after consecutive mucosal superfusion of Krebs buffer (t = 0–299s), 1% BSA (t = 300–599s), and 1% OVA (t = 600–899s). b,c, based on analysis of 188 neurons from n = 5 alum mice, and of 178 neurons from n = 5 OVA-alum mice, calcium transients from 47 representative neurons (from n = 3 alum mice, and n = 3 OVA-alum mice) are shown (b), as well as proportions of active neurons among total neurons (c). d,e, based on analysis of 442 neurons from n = 5 alum mice, and of 419 neurons from n = 5 OVA-alum mice, calcium transients from 127 representative neurons (from n = 3 alum mice, and n = 3 OVA-alum mice) are shown (d), as well as proportions of active neurons among total neurons (e). f, Cpa3+/+ (+/+) and Cpa3Cre/+ (Cre/+) mice were transduced with the Ca2+ sensor GCaMP6 from a viral vector construct (Methods), and immunized as in Fig. 1a. Recordings of Ca2+ transients in myenteric plexus neurons in full thickness gut preparations (as in b). Shown is the proportion of active neurons among total neurons (n = 52 neurons from 2 alum mice, and 56 neurons from n = 2 OVA-alum mice). g,h, Egg white water preferences of naive or OVA-alum immunized BALB/c mice that underwent pyloroplasty (sham) or vagotomy (Methods) displayed as (g) the percentages of egg white water intake over total water intake over the course of the experiment, and (h) the fraction of egg white water intake over total water intake as average per day for the duration of the two-bottle test. In g, each row is an individual mouse (naive n = 4; sham n = 16; vagotomy n = 34). i, j, Egg white water preferences of OVA-alum immunized BALB/c Cpa3+/+ and Cpa3Cre/+ mice that underwent vehicle or resiniferatoxin (RTX)-injection (Methods). In i, shown are percentages of egg white water intake over total water intake over the course of the experiment. Each row is an individual mouse (Cpa3Cre/+ vehicle n = 6; Cpa3Cre/+ RTX n = 6; Cpa3+/+ vehicle n = 6; Cpa3+/+ RTX n = 10). In (j) the fraction of egg white water intake over total water intake as average per day over the duration of the two-bottle test. In c,e,f, dots represent mean values ± SD of microscopy recordings. In h,j, each dot is a single mouse, and bars represent mean values. Statistical analysis was performed using two-way ANOVA for (c,e,f,), and one-way ANOVA with Tukey multiple-comparison test for (h,j). The exact P values are shown. Source data

Comment in

Similar articles

Cited by

References

    1. Profet M. The function of allergy: immunological defense against toxins. Q. Rev. Biol. 1991;66:23–62. doi: 10.1086/417049. - DOI - PubMed
    1. Palm NW, Rosenstein RK, Medzhitov R. Allergic host defences. Nature. 2012;484:465–472. doi: 10.1038/nature11047. - DOI - PMC - PubMed
    1. Florsheim EB, Sullivan ZA, Khoury-Hanold W, Medzhitov R. Food allergy as a biological food quality control system. Cell. 2021;184:1440–1454. doi: 10.1016/j.cell.2020.12.007. - DOI - PubMed
    1. Cara DC, Conde AA, Vaz NM. Immunological induction of flavor aversion in mice. Braz. J. Med. Biol. Res. 1994;27:1331–1341. - PubMed
    1. Costa-Pinto FA, Basso AS. Neural and behavioral correlates of food allergy. Chem. Immunol. Allergy. 2012;98:222–239. doi: 10.1159/000336525. - DOI - PubMed