. 2023 Jul;619(7971):801-810.
doi: 10.1038/s41586-023-06311-1. Epub 2023 Jul 12.

Spatially resolved multiomics of human cardiac niches

Affiliations

Spatially resolved multiomics of human cardiac niches

Kazumasa Kanemaru et al. Nature. 2023 Jul.

Erratum in

  • Author Correction: Spatially resolved multiomics of human cardiac niches.
    Kanemaru K, Cranley J, Muraro D, Miranda AMA, Ho SY, Wilbrey-Clark A, Patrick Pett J, Polanski K, Richardson L, Litvinukova M, Kumasaka N, Qin Y, Jablonska Z, Semprich CI, Mach L, Dabrowska M, Richoz N, Bolt L, Mamanova L, Kapuge R, Barnett SN, Perera S, Talavera-López C, Mulas I, Mahbubani KT, Tuck L, Wang L, Huang MM, Prete M, Pritchard S, Dark J, Saeb-Parsy K, Patel M, Clatworthy MR, Hübner N, Chowdhury RA, Noseda M, Teichmann SA. Kanemaru K, et al. Nature. 2025 Apr;640(8058):E4. doi: 10.1038/s41586-025-08886-3. Nature. 2025. PMID: 40113895 Free PMC article. No abstract available.

Abstract

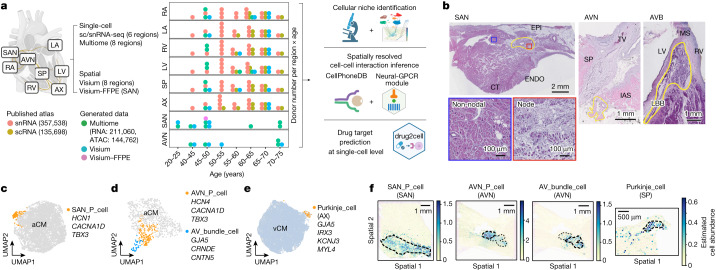
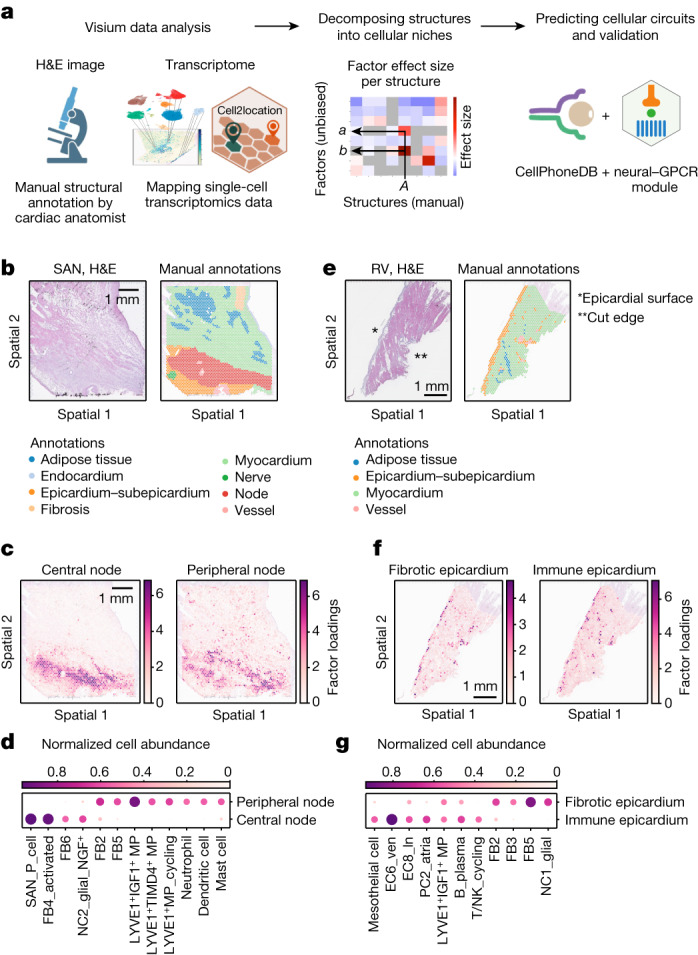
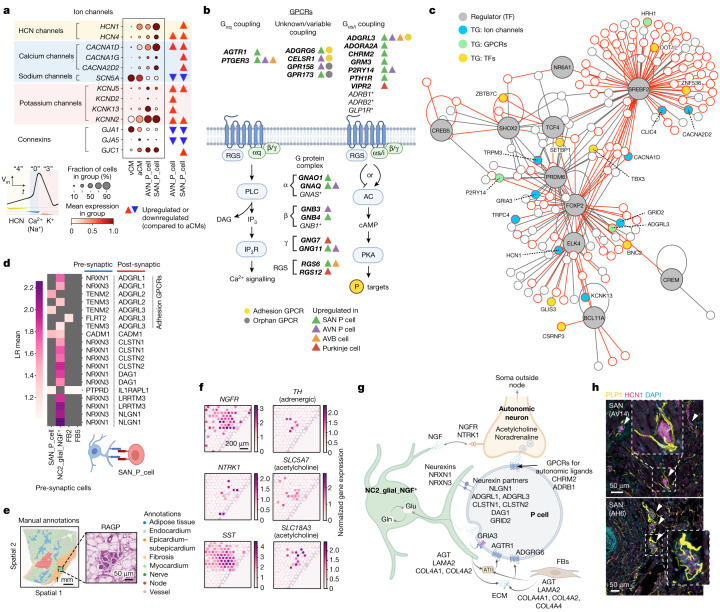
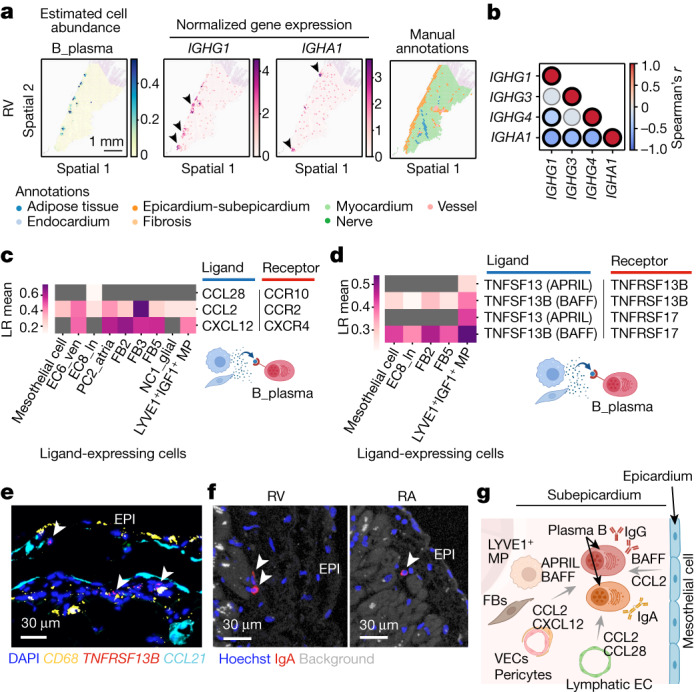
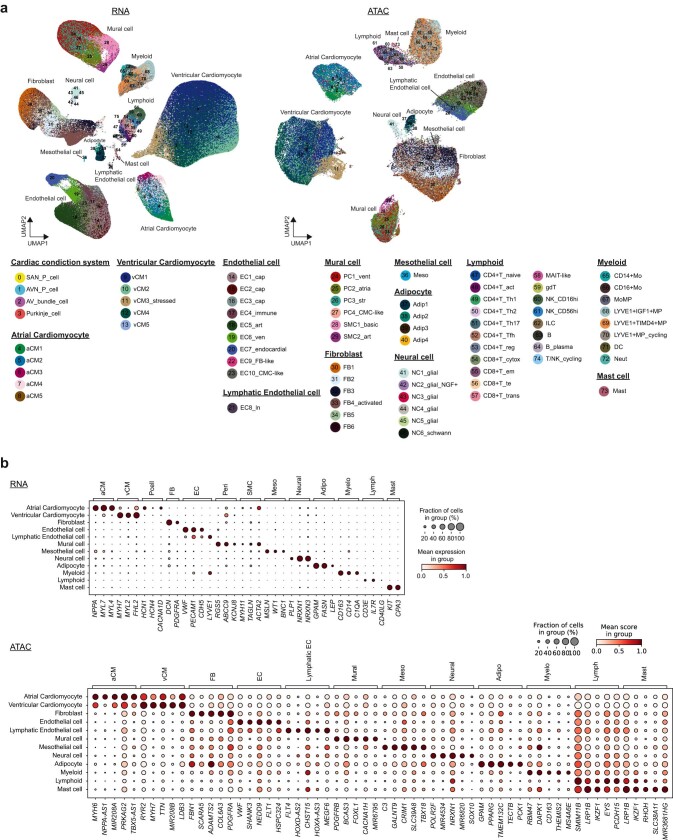
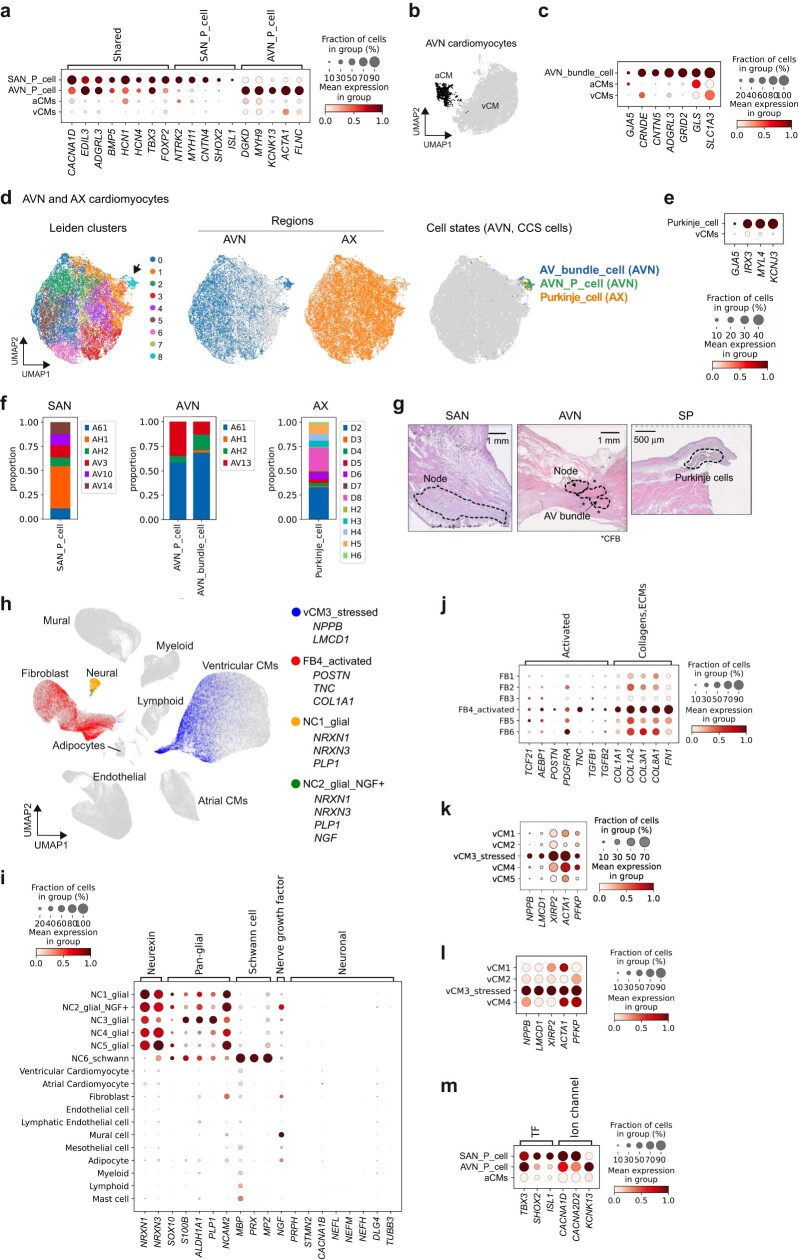
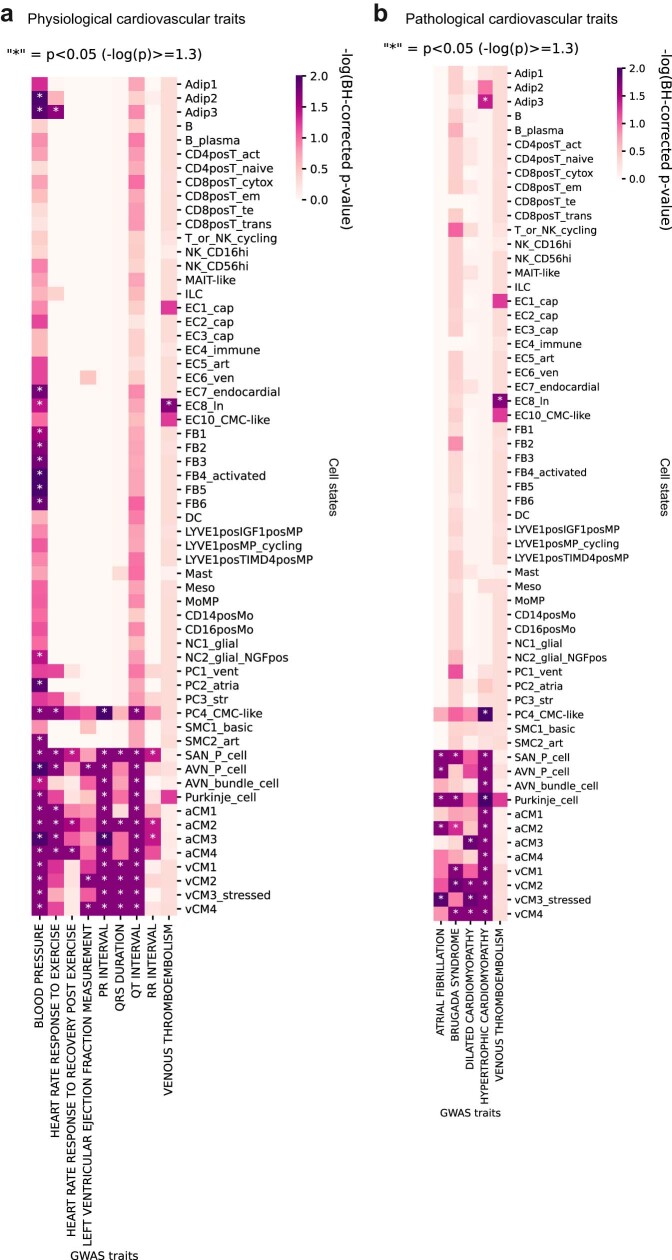
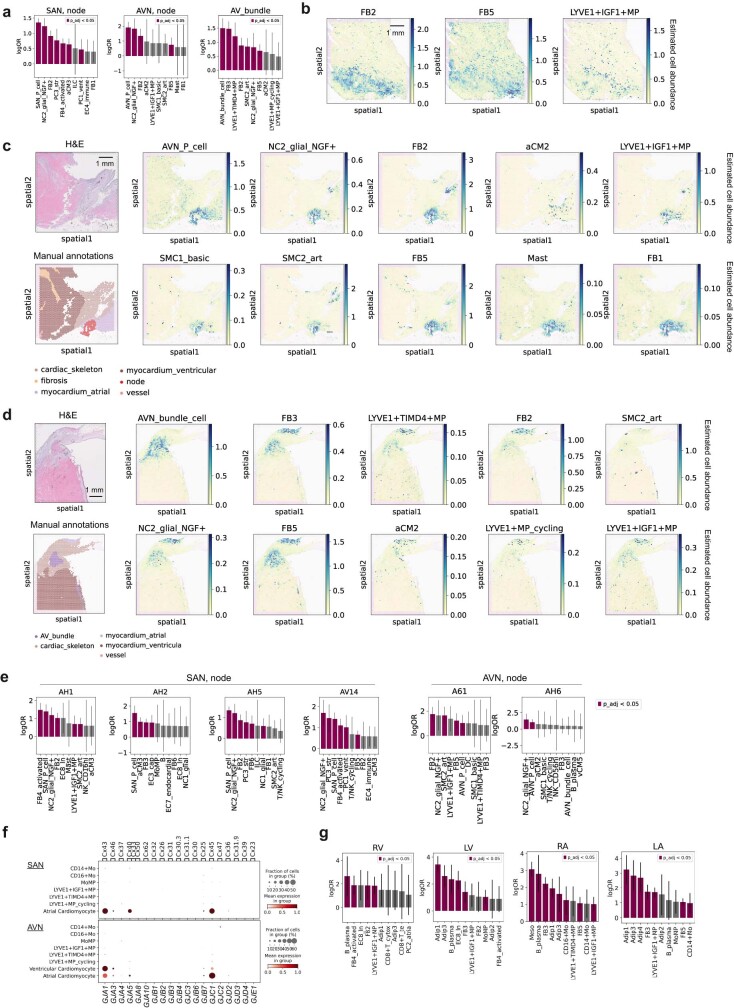
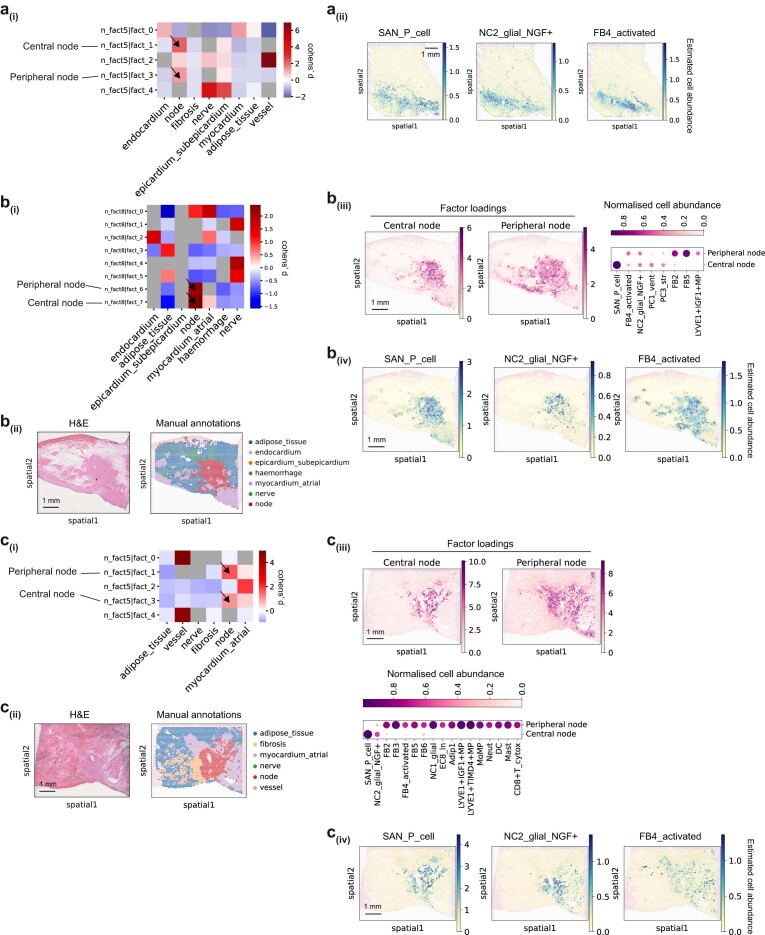
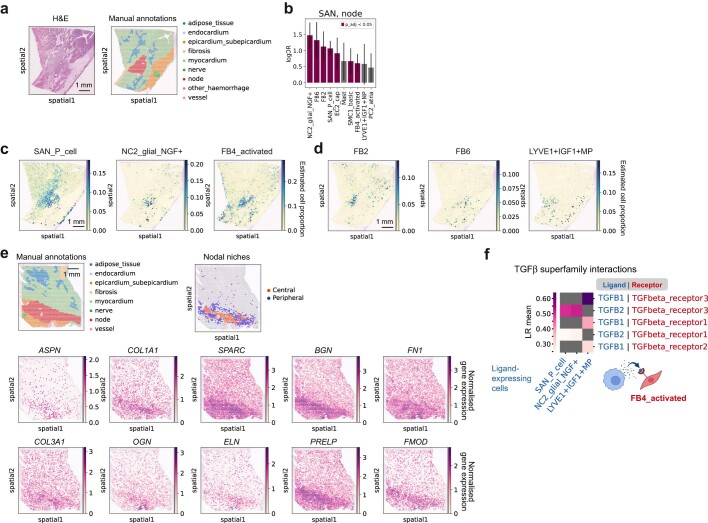
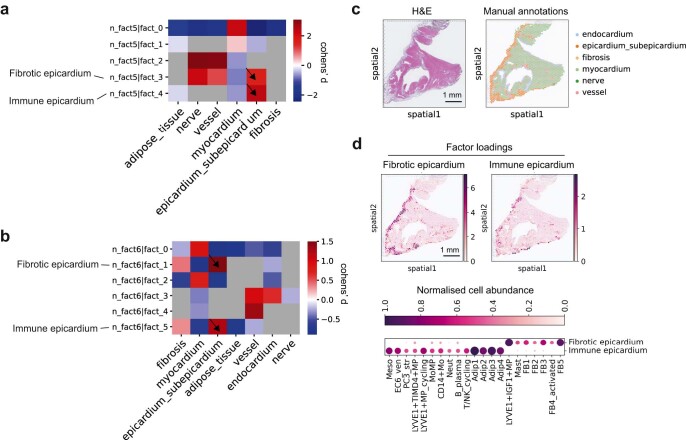
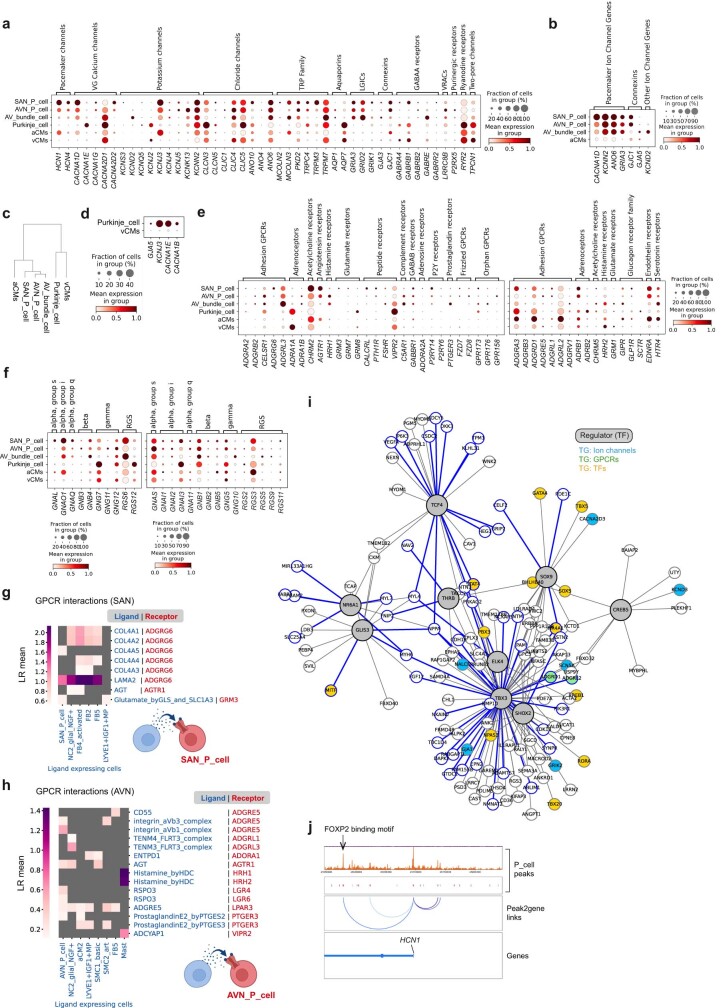
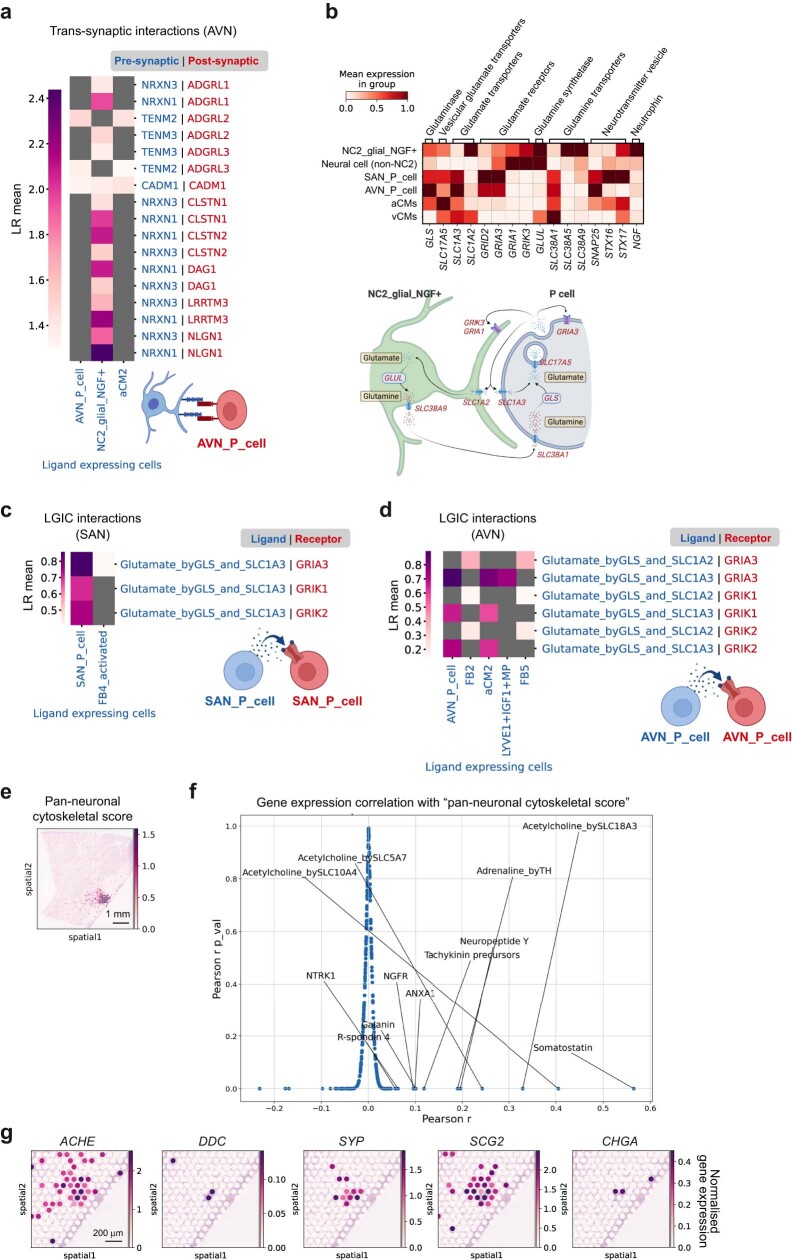
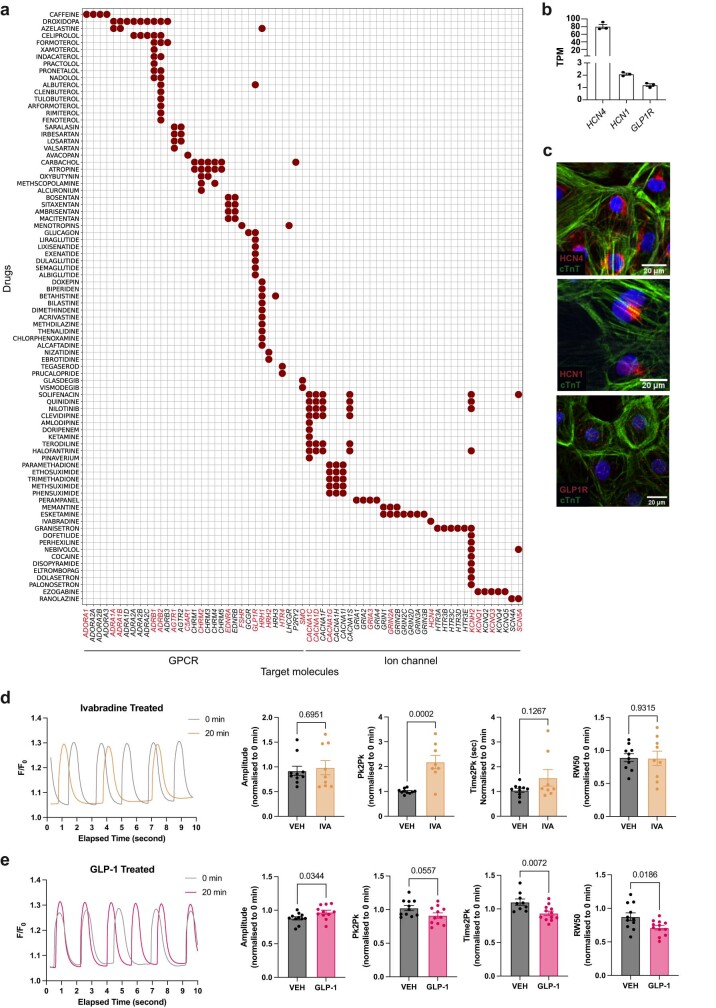
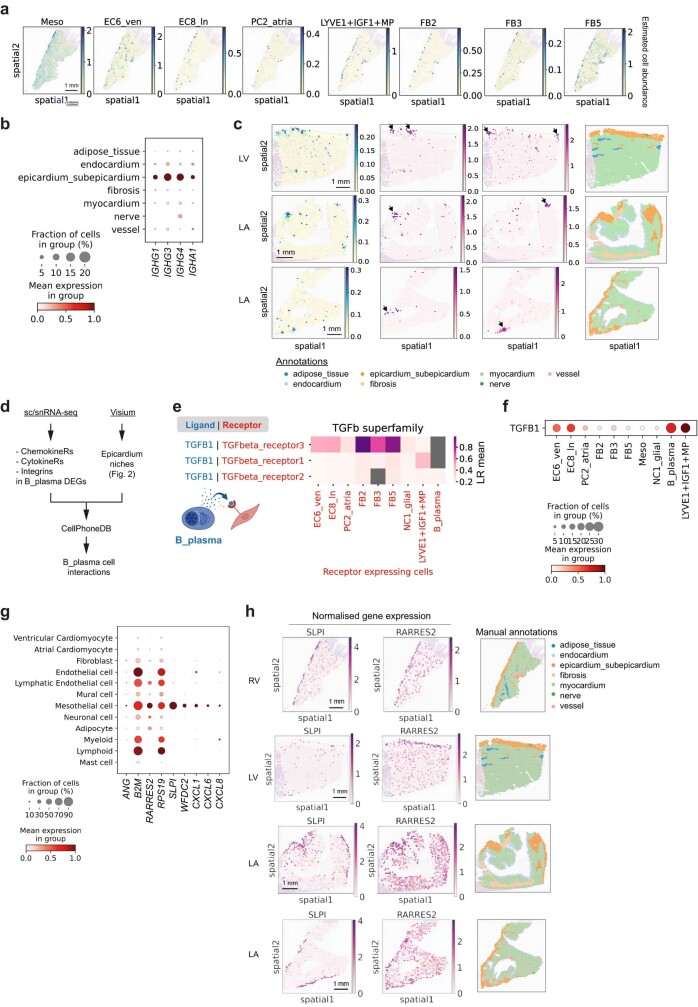
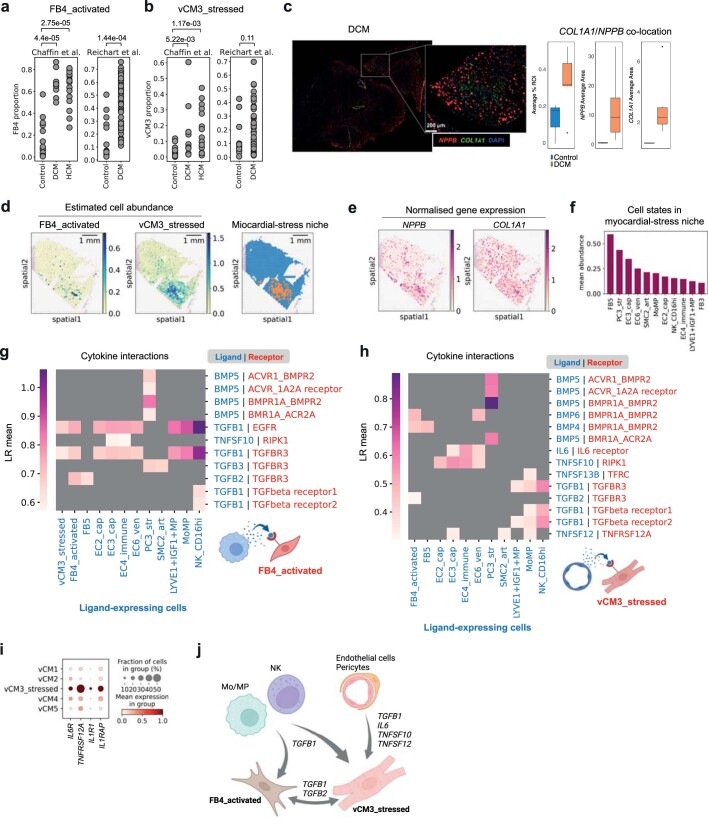
The function of a cell is defined by its intrinsic characteristics and its niche: the tissue microenvironment in which it dwells. Here we combine single-cell and spatial transcriptomics data to discover cellular niches within eight regions of the human heart. We map cells to microanatomical locations and integrate knowledge-based and unsupervised structural annotations. We also profile the cells of the human cardiac conduction system1. The results revealed their distinctive repertoire of ion channels, G-protein-coupled receptors (GPCRs) and regulatory networks, and implicated FOXP2 in the pacemaker phenotype. We show that the sinoatrial node is compartmentalized, with a core of pacemaker cells, fibroblasts and glial cells supporting glutamatergic signalling. Using a custom CellPhoneDB.org module, we identify trans-synaptic pacemaker cell interactions with glia. We introduce a druggable target prediction tool, drug2cell, which leverages single-cell profiles and drug-target interactions to provide mechanistic insights into the chronotropic effects of drugs, including GLP-1 analogues. In the epicardium, we show enrichment of both IgG+ and IgA+ plasma cells forming immune niches that may contribute to infection defence. Overall, we provide new clarity to cardiac electro-anatomy and immunology, and our suite of computational approaches can be applied to other tissues and organs.


Conflict of interest statement

In the past 3 years, S.A.T. has consulted or been a member of scientific advisory boards at Roche, Genentech, Biogen, GlaxoSmithKline, Qiagen and ForeSite Labs and is an equity holder of Transition Bio. The remaining authors declare no competing interests.

Figures

Fig. 1
Fig. 1. Multimodal profiling of the adult human heart.
a, Left, overview of study design and analyses. Multiome and Visium spatial transcriptomics data were generated from eight regions (RA, LA, RV, LV, SP, AX, SAN and AVN) of the adult human heart and integrated with a published sc/snRNA-seq atlas dataset. Middle, the dot plot shows the donor numbers by age group (x axis) and region (y axis). Dot colour represents data modality. The number of cells or nuclei is shown in parentheses. Right, data were used for cellular niche identification, spatially resolved cell–cell interaction analyses and drug-target discovery analysis (drug2cell). b, H&E micrographs of the SAN, the AVN and the AVB (yellow bordered). P cells in the nodal tissue (red box) are smaller than neighbouring CMs in non-nodal tissue (blue box) and embedded in dense ECM. The AVB is pictured at its transition to the left bundle branch (LBB). Images are representative of sections from four (SAN), two (AVN) and four (AVB) donors. CT, crista terminalis; ENDO, endocardium; EPI, epicardium; IAS, interatrial septum; MS, membranous septum; TV, tricuspid valve. ce, UMAP embedding of gene expression data of SAN aCMs (c), AVN aCMs (d), and AX and AVN CMs (e). Marker genes of CCS cells are shown. f, Abundance of CCS cell states in spatial coordinates of SAN, AVN and SP Visium sections as estimated by cell2location. Dashed lines highlight SAN, AVN, AVB and Purkinje cells defined by histology (Extended Data Fig. 2g). Illustrations in a were created using BioRender (https://biorender.com). The CellPhoneDB illustration is courtesy of the Wellcome Sanger Institute.
Fig. 2
Fig. 2. Identification of cellular niches in the adult human heart.
a, Overview of the spatial data analysis workflow. Visium spots were histologically annotated. Cell states defined by sn/scRNA-seq analysis were mapped to Visium spots using cell2location. NMF was used to decompose manually annotated structures into factors. Spatially resolved analysis of cell–cell interactions was performed using a custom neural–GPCR CellPhoneDB module. bg, Cellular microenvironment identification in the SAN (bd) and the RV (eg). Histological structures were manually annotated on the basis of H&E stainings (representative of four hearts) (b,e). Factor loadings (estimated abundance of cell state group) of factors identified using cell2location NMF analysis are shown in spatial coordinates (c,f). Dot plots illustrate cell states with more than 0.4 normalized cell abundance (dot colour and size) in a factor (d,g). Illustrations in a were created using BioRender (https://biorender.com). The cell2location illustration is reproduced with permission from ref. , Springer Nature America. The CellPhoneDB illustration is courtesy of the Wellcome Sanger Institute.
Fig. 3
Fig. 3. Human P cell profiles and nodal niche interactions.
a, Top, expression of genes encoding ion channel subunits in P cells. Triangles indicate differential expression. A typical pacemaker action potential is illustrated on the bottom left, with diastolic depolarization (phase 4, yellow), upstroke (phase 0, blue) and repolarization (phase 3, red). Principal currents are depicted with corresponding channel subunit expressions. b, Schematic representation of GPCRs and G protein signalling in CCS cells. Differentially expressed genes (versus other aCMs) are in bold. Asterisks mark genes expressed in >10% of P cells that are not differentially expressed (Extended Data Fig. 8e,f). c. Predicted TF network governing P cell identity. TFs (grey) and their predicted target genes (TGs) are displayed. Interactions inferred from ATAC-seq analysis are highlighted in red. For a complete list of TGs, see Supplementary Table 5. d, Inferred cell–cell (trans-synaptic) interactions between nodal cell states, with ‘receiver’ cells (post-synaptic SAN_P_cells) in red and ‘sender’ (pre-synaptic) cells in blue. LR mean, mean expression levels of the interacting ligand–receptor partners. e, Histological annotations of a SAN Visium section (FFPE) and H&E image of a RAGP. Representative of three hearts. f, Expression of neural genes in the RAGP (Visium–FFPE). g, Schematic representation of interactions in the nodal niche. P cells interact with ECM proteins (secreted by FBs) and NC2_glia_NGF+ cells, forming synapse-like connections through neurexins. NC2_glia_NGF+ cells support glutamatergic signalling and release NGF, which interacts with receptors on autonomic neurons. P cells express receptors for autonomic neurotransmitters, glutamate and angiotensin II (ATII), which is produced locally by NC2_glial_NGF+ cells and FBs. h, Immunofluorescence staining of the SAN with anti-HCN1 (pink) and anti-PLP1 (yellow) antibodies and nuclei (DAPI, blue). Arrowheads indicate colocalization of HCN1 and PLP1. Images from two independent donors (AV14 and AH6) are shown. Illustrations in a,b,d,g were created using BioRender (https://biorender.com).
Fig. 4
Fig. 4. Drug target exploration at the single-cell level.
a, Schematic of drug2cell analysis. Drugs and their target molecules from the ChEMBL database were queried and filtered on the basis of bioactivity metrics, Anatomical Therapeutic Chemical (ATC) classification, clinical trial phase and classes of molecular targets. Single-cell gene expression data were used to calculate scores and to predict drug interactions for a given cell state. Scores were used to achieve the following aims: (1) find cells targeted by drugs of interest; (2) find drugs targeting cells of interest; and (3) find target molecules expressed in the target cells to infer the effect of a drug. b, Heatmap of drug scores that are significantly higher in P cells compared with other cell states (two-sided Wilcoxon test, log2(fold change) > 2, P value < 0.05, corrected using the Benjamini–Hochberg method). Heatmap colours show the values scaled to z-scores for each drug. Categories of drugs are based on the ATC classification. EC, endothelial cell. c, Schematic representation of putative cell targets for chronotropic drugs. Single-cell profiling revealed that P cells express genes encoding targets of chronotropic drugs (yellow circle), indicative of ANS-independent mechanisms, such as in the case of the GLP1 analogues and perampanel. β, β-adrenergic receptor; M2, muscarinic acetylcholine receptor M2. Illustrations in a,c were created using BioRender (https://biorender.com).
Fig. 5
Fig. 5. Immune niche in the epicardium.
a, Images show abundances of plasma B cells (estimated using cell2location), IGHG1 and IGHA1 expression, and annotations of histological structures in spatial transcriptomics sections from the RV region. b, Correlation between paired IGH gene expressions in the epicardium–subepicardium. Colour scale indicates Spearman correlation coefficient and significant correlations (two-sided, P value < 0.05, adjusted using the Bonferroni method) are indicated by thick edges. c,d, Heatmaps summarize the inferred cell–cell interactions mediated by chemokines (c) and cytokines (d) from cells sending the signals (x axis) to the plasma B cells expressing their cognate receptors. LR mean, mean expression levels of the interacting ligand–receptor partners. e, Multiplex smFISH (RNAscope) of the LV epicardial region for TNFRSF13B, CCL21 and CD68. DAPI was used to stain nuclei. Image representative of three independent replicates. f, Immunofluorescence of the epicardial regions (RV and RA) stained with anti-IgA antibody and Hoechst for nuclei. Background signals are white. Image representative of three independent replicates. EPI, epicardium. g, Schematic of the immune niche in the epicardium and subepicardium shows plasma B cells, MPs, FBs and ECs. VECs, vascular ECs. Illustrations in c,d,g were created using BioRender (https://biorender.com).
Extended Data Fig. 1
Extended Data Fig. 1. Profiling of cardiac cells.
a. UMAP representation of from the eight regions showing the fine-grained cell state labels. The data were integrated based on their gene expression (left) or chromatin accessibility (right) with accounting for batch effects and embedded in two-dimensional UMAP space. b. Dot plot showing the expressions of curated lineage-specific genes (upper) and the gene scores of differentially accessible genes (lower) in the 12 major cell types.
Extended Data Fig. 2
Extended Data Fig. 2. Identification of fine-grained cell states.
a. Dot plot showing the marker gene expressions of SAN and AVN P cells. b. UMAP representation of gene expression data of AVN atrial and ventricle CMs. Dimensional reduction and leiden clustering were repeated for atrial CMs and CCS cell clusters (colored in black) (Fig. 1d). c. Dot plot showing the marker gene expressions of AV bundle cells. d. UMAP representation of gene expression data of AX and AVN atrial and ventricle CMs. With the labels of leiden clusters, regions, and AVN CCS cells. e. Dot plot showing the marker gene expressions of Purkinje cells. f. Donor proportions of CCS cell. g. H&E morphology of the CCS spatial transcriptomic samples shown in Fig. 1f. Histologically identified CCS regions are in dashed lines. Images representative of sections from four (‘node’ in SAN), two (‘node’ in AVN), and four (‘AV bundle’ in AVN) donors. The ‘Purkinje cell’ structure was identified in this section only. The middle panel shows a section which is oblique to the long axis of the heart which captures the compact AVN at its junction with the origin of the AV bundle. The bundle penetrates into, but not completely through the CFB (central fibrous body, marked by asterisks) in this section. h. UMAP embedding of gene expression data from eight cardiac anatomical regions (704,296 cells and nuclei). Highlighted in colour are four non-CCS cell states with a refined annotation compared to the previously published human heart atlas. i. Dot plot showing the expressions of glial, schwann, and neuronal cell marker genes in neural cell populations and other cell types. j. Dot plot showing the FB activation and ECM gene signature expressions in FB cell states. k. Dot plot showing the signature genes of cardiomyocyte stress in vCM cell states. l. Dot plot showing the gene scores of the cardiomyocyte stress signature genes in vCM cell states. m. Dot plot showing the gene scores of the marker genes of SAN and AVN P cells.
Extended Data Fig. 3
Extended Data Fig. 3. GWAS SNP enrichment analysis.
Heatmaps demonstrating enrichment of cell state-specific open chromatin regions for SNPs associated with physiological (a) and pathological (b) cardiovascular traits. A non-cardiac trait, ‘Venous Thromboembolism’ is a control trait. This was evaluated using a permutation test (Methods), in brief: A binary cell type by peak matrix was created indicating peaks open in cell types. The presence of GWAS trait-associated SNPs in peaks was evaluated. The proportion of SNPs in open peaks was calculated (“SNP proportion”). This was compared to a null distribution of SNP proportion generated by 1000 random permutations of the true open peaks. The p-value being the proportion of the 1000 random permutations with a greater SNP proportion than the observed SNP proportion. p-values were corrected for multiple testing using the Benjamini-Hochberg method.
Extended Data Fig. 4
Extended Data Fig. 4. Cell state spatial enrichment in histologically annotated structures.
a. Cell state enrichment (odds ratio) in the CCS structures: ‘node’ of SAN and AVN, and ‘AV bundle’ of AVN. Visium spot numbers are SAN: 27,108, AVN: 24,026. b. Abundance of the cell states (mapped by cell2location) enriched in the ‘node’ of SAN. c,d. H&E image, manual structural annotations, and abundance of the cell states enriched in the ‘node’ (c) or ‘AV bundle’ (d) of AVN. H&E images are representative of sections from two (‘node’) and four (‘AV bundle’) donors. e. Cell state enrichment (odds ratio) in the CCS structures for each donor: ‘node’ of SAN and AVN. Visium spot numbers in the analyses are AH1: 4,243, AH2: 3,802, AH5: 12,781, AV14: 6,282 for SAN and A61: 10,278 and AH6: 2,942 for AVN. f. Dot plot showing expression of connexin genes in MP and monocyte cell states from the SAN and AVN regions. g. Cell state enrichments (odds ratio) in the ‘epicardium-subepicardium’ of the free wall of the four regions: RV, LV, RA, and LA. Visium spot numbers are RV: 5,039, LV: 9,626, RA: 7,027, and LA: 5,822. Data of cell state spatial enrichment analyses (a,e,g) show log odds ratio with upper and lower 95% confidence interval, and statistically significant enrichments (chi-square test, p < 0.05, p-values were adjusted for multiple comparisons using the Benjamini-Hochberg method) are shown in magenta-pink.
Extended Data Fig. 5
Extended Data Fig. 5. Cellular niche identification in the node.
a(i), b(i), c(i). Selected factors which had high effect size in the ‘node’ of SAN visium sections (as indicated by the arrows): donor AH1 (section HCAHeartST10659160) (a(i)), donor AV14 (section HCAHeartST13228105) (b(i)), and donor AH5 (section HCAHeartST13233996) (c(i)). The factor names were assigned based on Fig. 2c, Extended Data Fig. 5b(iii), and Extended Data Fig. 5c(iii). a(ii), b, c. Cellular microenvironment identification in the SAN. Manual structural annotations were performed based on the H&E images (b(ii), c(ii)). Factors from cell2location NMF analysis which showed high similarity (Cohen’s d) with the ‘node’ structure were selected (as described in Methods). Factor loadings across locations (estimated abundance of cell state group) are shown in spatial coordinates for the selected factors (b(iii), c(iii)). The accompanying dot plot illustrates cell states with more than 0.4 normalised cell abundance (visualised by dot size and colour) in the selected factors (b(iii), c(iii)). Estimated abundance of representative cell states in the central node of SAN sections (a(ii), b(iv), c(iv)). Images of b(ii) and c(ii) are representative of sections from four donors.
Extended Data Fig. 6
Extended Data Fig. 6. Cellular localisations in the node.
ad. Analyses on Visium-FFPE slides of the SAN region: H&E image and manual structural annotations (representative of three independent replicates)(a), cell state enrichments in the ‘node’ of SAN (b), and the proportions of the cell states (mapped by cell2location) enriched in the ‘node’ (c,d). Data in (b) show log odds ratio with upper and lower 95% confidence interval, and statistically significant enrichments (chi-square test, p < 0.05, p-values were adjusted for multiple comparisons using the Benjamini-Hochberg method) are shown in magenta-pink. Visium spot number used in (b) is 11,312. e. Expression of extracellular cellular matrix component genes which were differentially expressed in the central nodal niche compared with the peripheral niche (two-sided t-test, p < 0.05, log2FC>0.5, p-values were adjusted for multiple comparisons using the Benjamini-Hochberg method). Each niche was defined based on the NMF analysis and the corresponding spots were selected by thresholding the factor loadings (top 10% of all spots). f. Inferred spatial cell-cell interactions involving TGFβ superfamily member ligands in the node, signalling to cognate receptors in the FB4_activated cells (LR mean>0.5). LR mean (mean expressions of the interacting ligand-receptor partners). Illustrations in f were created using BioRender (https://biorender.com).
Extended Data Fig. 7
Extended Data Fig. 7. Epicardial cellular niches.
a. Selected factors (n_fact = 5) which had high effect size in the ‘epicardium-subepicardium’ of RV. The factor names were assigned based on Fig. 2e. b. Selected factors (n_fact = 6) which had high effect size in the ‘epicardium-subepicardium’ of LA. The factor names were assigned based on Extended Data Fig. 7d. c. Manual structural annotations based on the H&E image. Image representative of sections from four donors. d. The factor loadings across locations (estimated abundance of cell state group) are shown in spatial coordinates for the selected factors in (b). The accompanying dot plot illustrates cell states with more than 0.4 normalised cell abundance (visualised by dot size and colour) in the selected factors.
Extended Data Fig. 8
Extended Data Fig. 8. Characterisation of human pacemaker cells and their niche.
a. Dot plot shows the expression of the DEGs (log2FC>0, p < 0.05) encoding ion channels in any of the CCS cell states compared with the other aCMs. b. Dot plot shows the expression of P cell ion channel genes, genes encoding Connexins 45 (GJC1) and 40 (GJA5), and the potassium channel gene KCND2. c. Dendrogram comparing overall gene expression profile of working (aCMs, vCMs) and CCS cell states. d. Dot plot shows ion channel genes highly expressed in Purkinje cells compared to other vCMs. e,f. Dot plot shows the expression of the DEGs (log2FC>0, p < 0.05) encoding GPCRs (e) or G-protein complexes and RGS (f) in any of the CCS cell states compared with the other aCMs (left). Dot plot shows the genes expressed (>10%) in any of the CCS cell states (right). RGS (regulators of G-protein signalling). g,h. Inferred spatial cell-cell interactions of GPCRs (CellPhoneDB with neural-GPCR module) in the central node of SAN (g) or the ‘node’ structure of AVN (h), with P cell as the receiver. LR mean (mean expressions of the interacting ligand-receptor partners). i. Analysis of TF repressor network in P cells using pySCENIC (Methods). TFs (grey) and their predicted target genes (TGs) are displayed. Interactions inferred from snATAC-seq analysis are highlighted in blue. TG colours represent class: GPCRs (green), ion channels (blue), or TFs (yellow). For a complete list of TG see Supplementary Table 6. j. Peak-to-gene linkage plot of HCN1 (ArchR). One of the peaks linked to HCN1 has FOXP2 binding motif as indicated. DEG testing (a,e,f) was performed with two-sided t-test. p-values were adjusted for multiple comparisons using the Benjamini-Hochberg method (Supp. Table 2). Illustrations in g,h were created using BioRender (https://biorender.com).
Extended Data Fig. 9
Extended Data Fig. 9. Cell-cell interactions in the node.
a. Inferred cell-cell trans-synaptic interactions (CellPhoneDB neural-GPCR module) in the AVN, spatially refined by cell states enriched in the ‘node’ structure, with AVN_P_cells as the receiver cells with expression receptors (LR mean>1). LR mean (mean expressions of the interacting ligand-receptor partners). b. Mean expression of glutamatergic signalling machinery genes (heatmap, upper). A schematic illustrates paracrine glutamatergic signalling involving P cells and NC2_glial_NGF+ (lower). c,d. Inferred spatial cell-cell interactions of LGICs in the node of SAN (b) or AVN (c) region, with P cell as the receiver. e. Plot of ‘pan-neuronal cytoskeleton score’ (Methods) in spatial coordinates matches RAGP (inset showing RAGP in the associated H&E image in Fig. 3e). f. Several GPCR ligands correlate with the pan-neuronal nerve cytoskeleton score. Correlation (Pearson’s r) of individual ligand genes with the pan-neuronal nerve cytoskeleton score (Methods). Ligand genes with p value < 0.05 and Pearson’s r > 0.1 are labelled. p-values were corrected for multiple testing using the Benjamini-Hochberg method. g. Plots of significantly correlated ligand genes in spatial coordinates. Illustrations in a-d were created using BioRender (https://biorender.com).
Extended Data Fig. 10
Extended Data Fig. 10. In vitro validation of chronotropic effects of GLP1.
a. Dotplot shows clinically approved drugs (y-axis) which target GPCRs or Ion channels and had higher scores in P cells compared to other cell states. Genes encoding their molecular targets are shown on the x-axis. Target genes expressed in ≥10% of P cells are highlighted in red. b. Bar graphs showing normalised transcript per million (TPM) values obtained from bulk RNA sequencing of hiPSC-CMs for genes encoding for HCN channels and GLP1R. Data shown as mean ± SEM; n = 3 independent experiments. c. Representative confocal images of HCN4, HCN1 and GLP1R expression in hiPSC-CMs. Cardiac troponin T (cTnT) was used to visualise CMs and nuclei were stained with DAPI. Images representative of three independent replicates. d. Left, representative calcium transient peaks, shown as relative fluorescence intensity (F/F0), detected in hiPSC-CMs before and after 20 min of Ivabradine treatment. Right, bar graphs showing normalised Amplitude, Pk2Pk, Time2Pk and RW50 values. Data shown as mean ± SEM; unpaired two-tailed t-tests; N = 3 independent differentiation batches, n = 9–12 experimental replicates. e. Left, representative calcium transient peaks, shown as relative fluorescence intensity (F/F0), detected in hiPSC-CMs before and after 20 min of GLP1 treatment. Right, bar graphs showing normalised Amplitude, Pk2Pk, Time2Pk and RW50 values. Data shown as mean ± SEM; unpaired two-tailed t-tests; N = 3 independent differentiation batches, n = 9–12 experimental replicates.
Extended Data Fig. 11
Extended Data Fig. 11. An immune niche in the epicardium.
a. Abundance of the co-locating cell states (estimated by cell2location) in the ‘epicardium-subepicardium’ structure of RV (Fig. 2f). b. Dot plot showing expressions of IGH genes significantly enriched in the ‘epicardium-subepicardium’ compared with other manually annotated structures (p-value<0.05, log2FC>1). c. Images show abundances of plasma B cells (estimated using cell2location), mapping of IGHG1 and IGHA1 expression, and annotations of histological structures in spatial transcriptomic sections from the indicated anatomical regions. d. Workflow of spatial CellPhoneDB analysis focusing on B_plasma cells. e. Inferred spatial cell-cell interactions of TGFβ superfamily, spatially refined by niche partner cell states, with plasma B cells as the sender cell expressing ligands. LR mean (mean expressions of the interacting ligand-receptor partners). f. Dot plot showing TGFB1 expression in the cell states localised in the epicardial niches. g. Dot plot showing the expressions of ‘antimicrobial humoral response’ genes (Gene Ontology Term, GO:0019730) which were expressed significantly higher in mesothelial cells compared to other cells (p-value<0.05, log2FC>1). h. Expression of antimicrobial response genes, SLPI and RARRES2, in spatial transcriptomics data. DEG testing (b,g) was performed with two-sided wilcoxon test. p-values adjusted for multiple comparisons using the Benjamini-Hochberg method. Illustrations in e were created using BioRender (https://biorender.com).
Extended Data Fig. 12
Extended Data Fig. 12. Ventricular myocardial-stress niche.
a,b. Comparisons of FB4_activated proportions amongst FBs (a) and vCM3_stressed amongst vCMs (b) between control and diseased samples in publicly available DCM and HCM datasets,. Cell state labels were transferred from the dataset in this study using scNym. p-values are provided for each comparison (two-sided wilcoxon rank-sum test, p-values were adjusted for multiple comparisons using the Benjamini-Hochberg method). c. Multiplex single-molecule fluorescence in situ hybridization (RNAscope) of left ventricular regions (LV, SP, and AX) for NPPB and COL1A1. DAPI (blue) was used to stain nuclei. The proportions of the COL1A1/NPPB co-location and the expressions of each gene in the area of COL1A1/NPPB co-location were quantified for control (n = 2 donors x 3 regions) and DCM samples (n = 2 donors x 3 regions). For the box plots, the centre line shows the median, the box limits represent the 25th and 75th percentiles, the whiskers show the minimum and maximum values, and the dots represent potential outliers. d,e. Visium section of SP showing FB4_activated and vCM3_stressed abundances (d), and expression of their markers NPPB and COL1A1 (e). The myocardial-stress niche was defined based on the abundances of FB4_activated and vCM3_stressed (Methods). f. Cell states enriched in the myocardial-stress niche, ordered by mean abundance. g,h. Inferred cell-cell interactions of cytokines in the myocardial-stress niche cell states, with FB4_activated (g) or vCM3_stressed (h) as the receiver. i. Dotplot showing inflammatory cytokine receptor expressions in vCM3_stressed and other vCMs of left ventricular regions (LV, SP, and AX). j. Myocardial-stress niche in the ventricle. TGFβ superfamily interactions from immune cells and vasculature cells to FB4_activated and vCM3_stressed may cause pathogenic fibrosis. Vasculature cells also express inflammatory cytokines which may directly affect vCMs and lead to adverse cardiac remodelling. Illustrations in g,h,j were created using BioRender (https://biorender.com).

Comment in

References

    1. van Eif, V. W. W., Devalla, H. D., Boink, G. J. J. & Christoffels, V. M. Transcriptional regulation of the cardiac conduction system. Nat. Rev. Cardiol.15, 617–630 (2018). - PubMed
    1. Litviňuková, M. et al. Cells of the adult human heart. Nature588, 466–472 (2020). - PMC - PubMed
    1. Miranda, A. M. A. et al. Single-cell transcriptomics for the assessment of cardiac disease. Nat. Rev. Cardiol.20, 289–308 (2023). - PubMed
    1. Asp, M. et al. A spatiotemporal organ-wide gene expression and cell atlas of the developing human heart. Cell179, 1647–1660.e19 (2019). - PubMed
    1. Kuppe, C. et al. Spatial multi-omic map of human myocardial infarction. Nature608, 766–777 (2022). - PMC - PubMed

Publication types

MeSH terms