. 2023 Jul;619(7971):819-827.
doi: 10.1038/s41586-023-06322-y. Epub 2023 Jul 12.

PLSCR1 is a cell-autonomous defence factor against SARS-CoV-2 infection

Affiliations

PLSCR1 is a cell-autonomous defence factor against SARS-CoV-2 infection

Dijin Xu et al. Nature. 2023 Jul.

Abstract

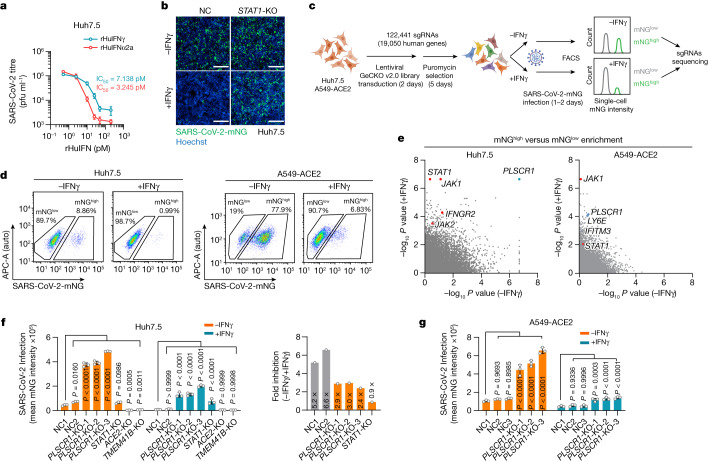
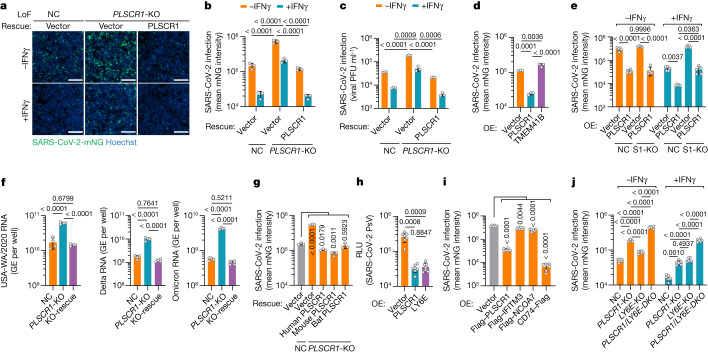
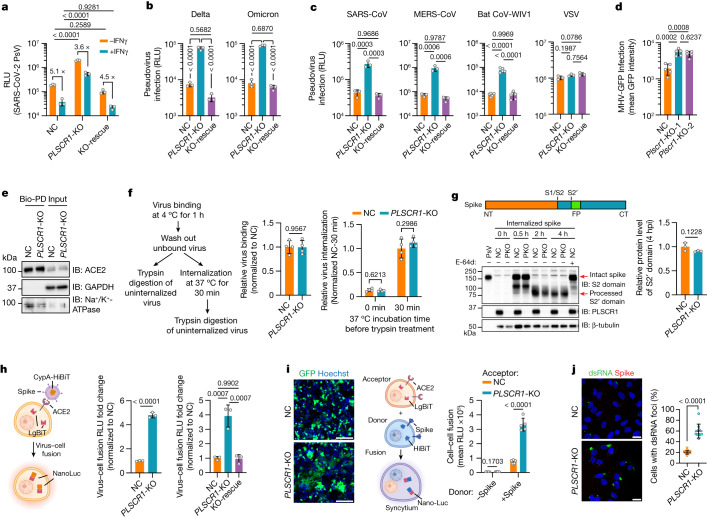
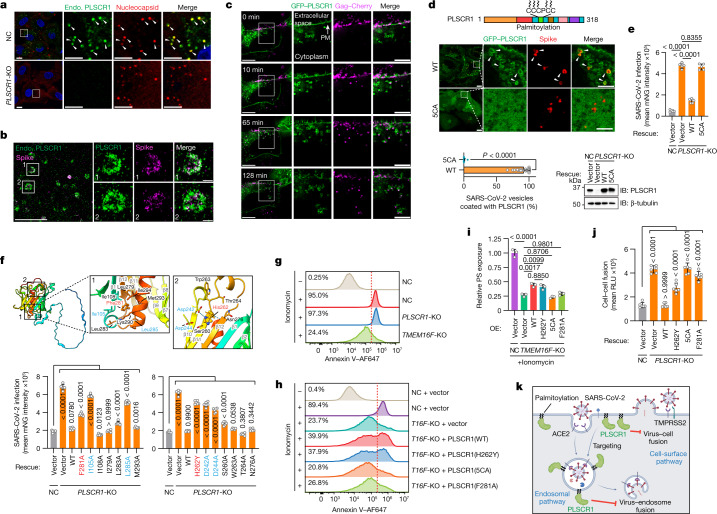
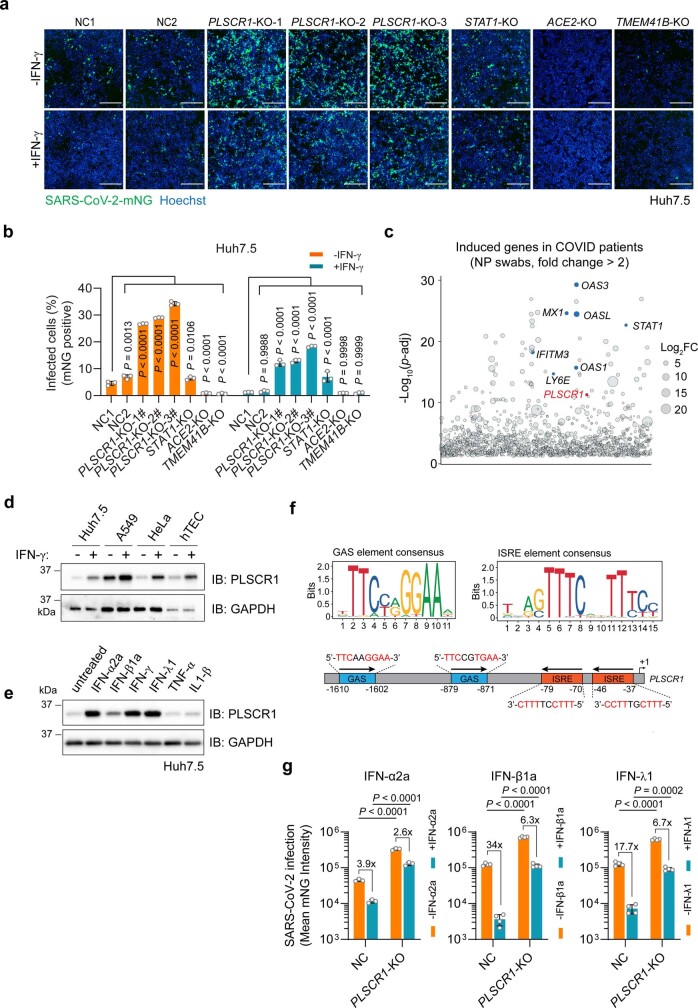
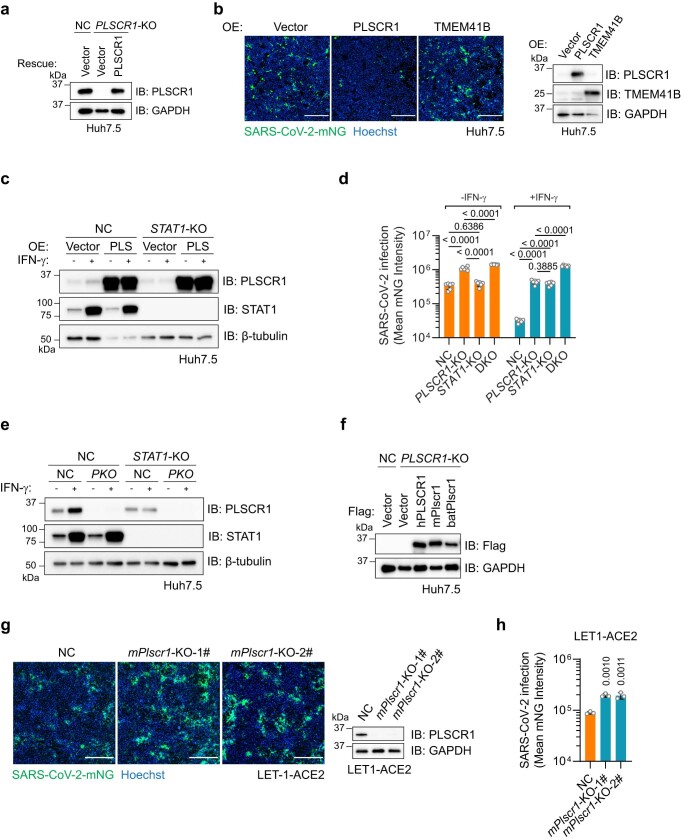
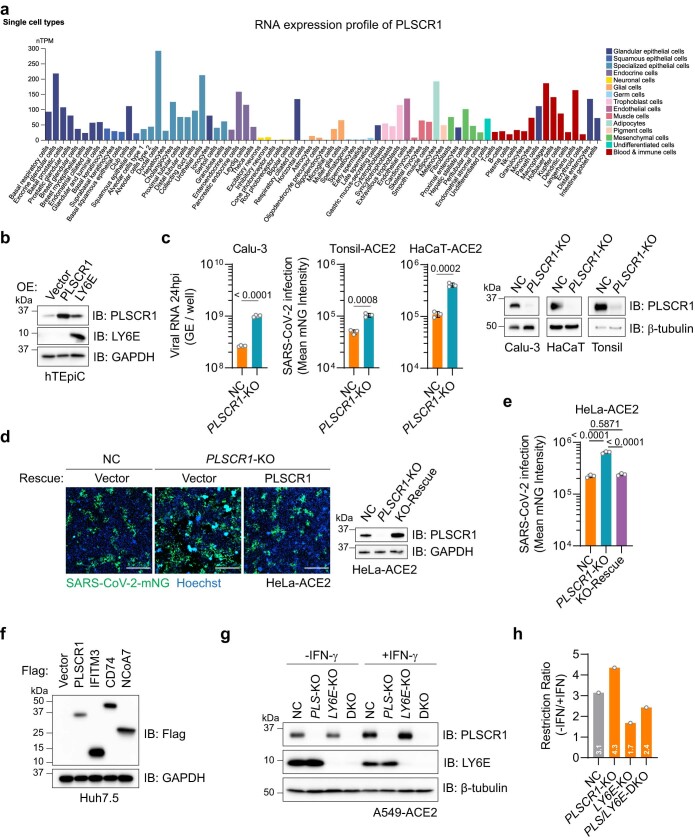
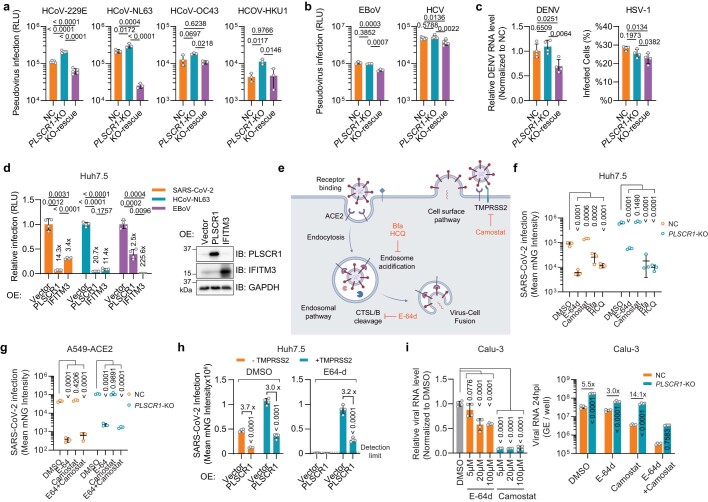
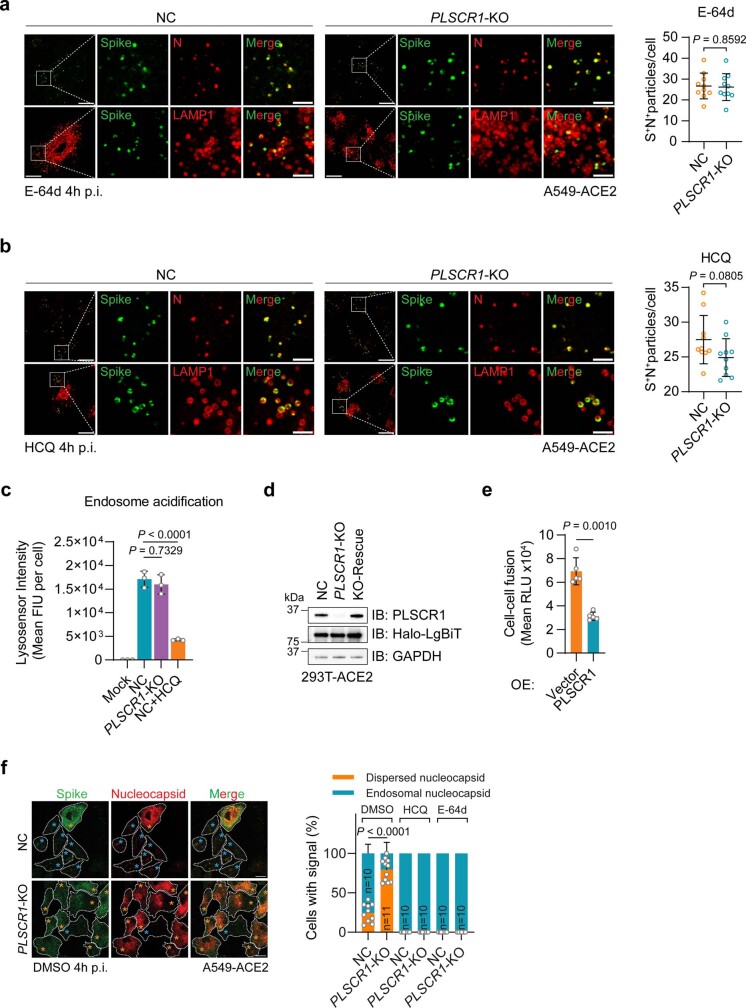
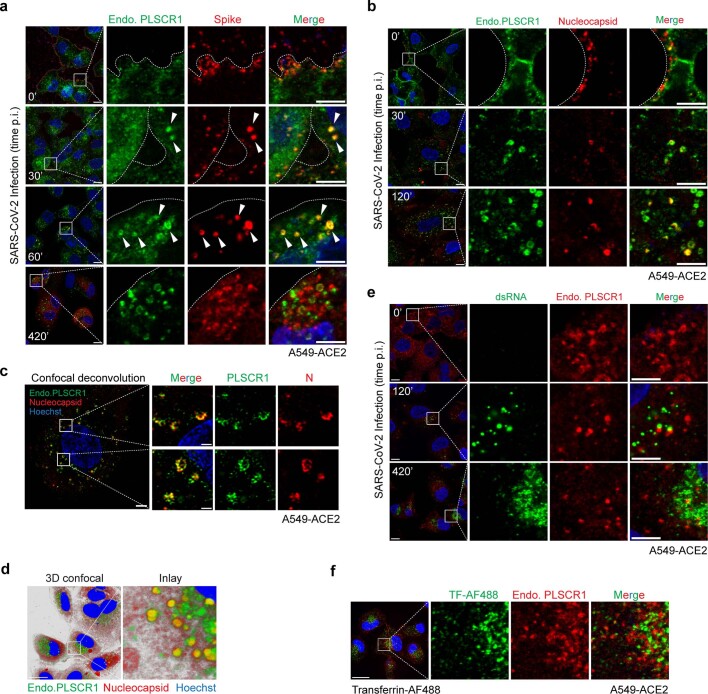
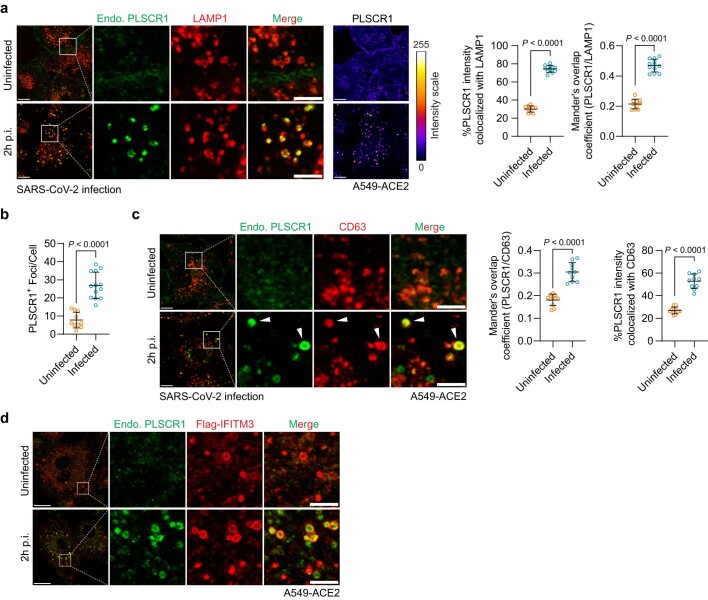
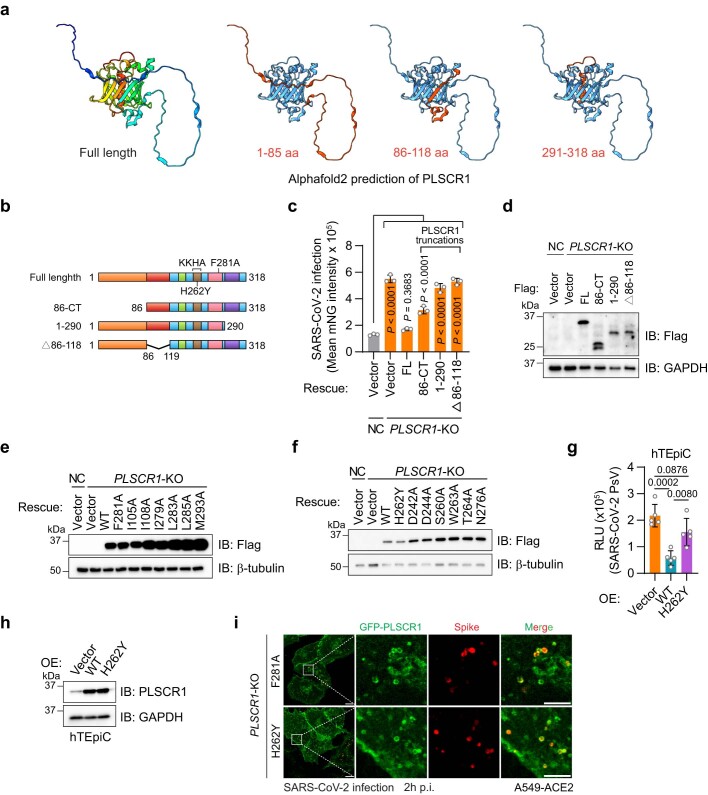
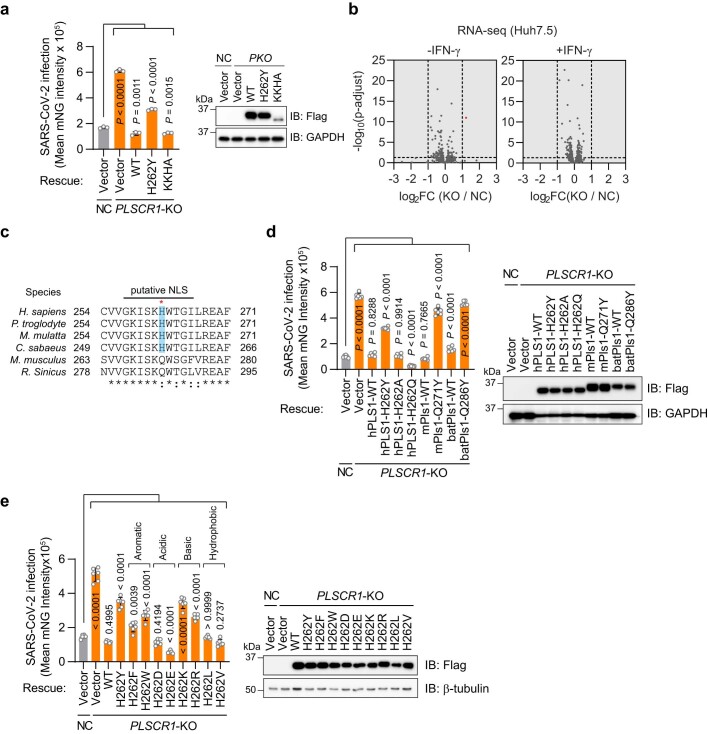
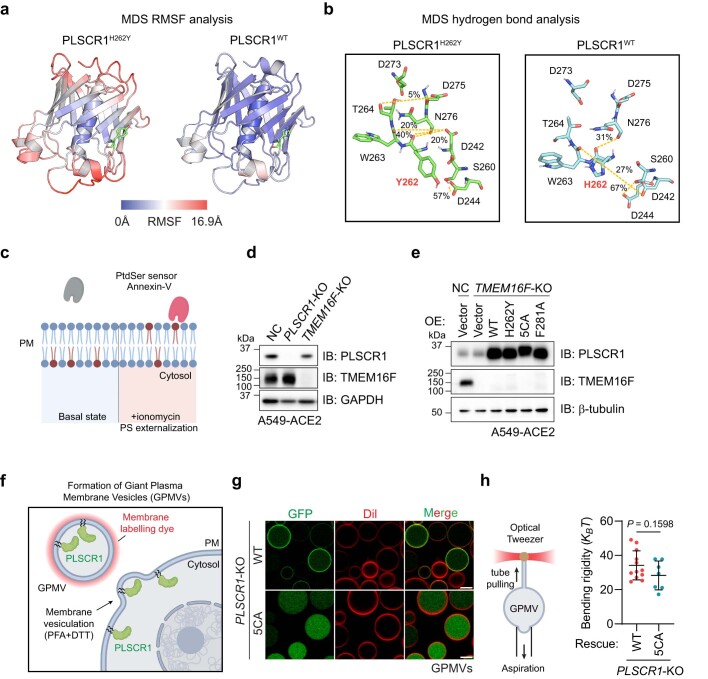
Understanding protective immunity to COVID-19 facilitates preparedness for future pandemics and combats new SARS-CoV-2 variants emerging in the human population. Neutralizing antibodies have been widely studied; however, on the basis of large-scale exome sequencing of protected versus severely ill patients with COVID-19, local cell-autonomous defence is also crucial1-4. Here we identify phospholipid scramblase 1 (PLSCR1) as a potent cell-autonomous restriction factor against live SARS-CoV-2 infection in parallel genome-wide CRISPR-Cas9 screens of human lung epithelia and hepatocytes before and after stimulation with interferon-γ (IFNγ). IFNγ-induced PLSCR1 not only restricted SARS-CoV-2 USA-WA1/2020, but was also effective against the Delta B.1.617.2 and Omicron BA.1 lineages. Its robust activity extended to other highly pathogenic coronaviruses, was functionally conserved in bats and mice, and interfered with the uptake of SARS-CoV-2 in both the endocytic and the TMPRSS2-dependent fusion routes. Whole-cell 4Pi single-molecule switching nanoscopy together with bipartite nano-reporter assays found that PLSCR1 directly targeted SARS-CoV-2-containing vesicles to prevent spike-mediated fusion and viral escape. A PLSCR1 C-terminal β-barrel domain-but not lipid scramblase activity-was essential for this fusogenic blockade. Our mechanistic studies, together with reports that COVID-associated PLSCR1 mutations are found in some susceptible people3,4, identify an anti-coronavirus protein that interferes at a late entry step before viral RNA is released into the host-cell cytosol.


Conflict of interest statement

The authors declare no competing interests.

Figures

Fig. 1
Fig. 1. Genome-wide CRISPR–Cas9 screens identify PLSCR1 as a potent anti-SARS-CoV-2 defence factor.
a, Huh7.5 cells were treated with different concentrations of IFNs (recombinant human IFNγ (rHuIFNγ) or recombinant human IFNα2a (rHuIFNα2a)) and then infected with SARS-CoV-2 (isolate USA-WA1/2020) at a multiplicity of infection (MOI) of 1. Virus production (plaque-forming units (PFU) per ml) was quantified by plaque assay at 2 days post-infection (dpi) (n = 3). b, Representative images showing infection with SARS-CoV-2 expressing mNeonGreen (SARS-CoV-2-mNG, isolate USA-WA1/2020) in negative control (NC) or STAT1-KO Huh7.5 cells in resting or IFNγ (8 U ml−1)-activated conditions. Green, SARS-CoV-2-mNG; blue, Hoechst. c, Schema showing the genome-wide CRISPR screening workflow. d, FACS plots of resting or IFNγ-activated Huh7.5 (8 U ml−1) (left) and A549-ACE2 (70 U ml−1) (right) cells infected with SARS-CoV-2-mNG at an MOI of 1 for 48 h or an MOI of 0.3 for 24 h, respectively. The percentage of infected cells is shown for populations with a high (mNGhigh) or low (mNGlow) level of mNG expression. e, Comparisons of gene-level enrichment scores (mNGhigh versus mNGlow populations) between untreated and IFNγ-treated conditions in Huh7.5 (left) and A549-ACE2 (right) cells. f, SARS-CoV-2-mNG fluorescent intensity (normalized to cell counts) in Huh7.5 (left) and average restriction ratio (−IFNγ/+IFNγ) in Huh7.5 cells of the indicated genotypes (right) (n = 3). g, SARS-CoV-2-mNG fluorescent intensity in A549-ACE2 cells of the indicated genotypes. The fluorescent intensity of mNeonGreen was quantified at 2 dpi for Huh7.5 cells (f) and 1 dpi for A549-ACE2 cells (g). Three PLSCR1-KO cell lines were generated using different sgRNAs (n = 3). Data are mean ± s.d. P values from one-way ANOVA followed by Tukey’s multiple comparison test in f,g. Scale bars (b), 500 μm. Experiments performed three times. Source Data
Fig. 2
Fig. 2. PLSCR1 is an evolutionarily conserved defence protein against coronavirus infection.
a, Representative images showing the infectivity of SARS-CoV-2-mNG in resting or IFNγ-activated NC, PLSCR1-KO and PLSCR1-KO-complemented Huh7.5 cells at 48 hours post-infection (hpi) (MOI = 1). b, Stable genetic complementation. Quantification of SARS-CoV-2-mNG fluorescent intensity in Huh7.5 cells (n = 3). c, Complementation against virus production. Plaque assay showing the production of infectious viruses in Huh7.5 cells infected for 48 h at an MOI of 0.5 (n = 3). d, SARS-CoV-2-mNG infection in Huh7.5 cells overexpressing (OE) the indicated proteins (n = 3). e, SARS-CoV-2-mNG infection in control or STAT1-KO (S1-KO) Huh7.5 cells overexpressing PLSCR1 in the presence or absence of IFNγ (n = 5). f, Intracellular levels of SARS-CoV-2 RNA in Huh7.5 cells at 24 hpi. Primers detecting nucleocapsid were used to amplify viral RNA. GE, genome equivalents. Cells were infected with SARS-CoV-2 USA-WA1 (left), Delta B.1.617.2 (middle) or Omicron BA.1 (right) variants at an MOI of 0.5 (n = 4). g, SARS-CoV-2-mNG infection in PLSCR1-KO Huh7.5 cells complemented with vector control or human (Homo sapiens), mouse (Mus musculus) or bat (Rhinolophus sinicus) orthologues of PLSCR1 (n = 3). h, Pseudovirus (PsV) infection in hTEpiCs overexpressing the indicated proteins. An HIV-1-based luciferase-expressing vector pseudotyped with SARS-CoV-2 spike (Omicron) was quantified by luciferase activity at 48 hpi. RLU, relative light units (n = 6). i, Quantification of SARS-CoV-2 infection in Huh7.5 cells stably overexpressing the indicated ISGs (MOI = 1, 48 hpi) (n = 6). j, SARS-CoV-2 infection in A549-ACE2 cells of the indicated genotypes (DKO, double knockout) in the presence or absence of IFNγ (100 U ml−1) at 24 hpi. (MOI = 0.2) (n = 6).Data are mean ± s.d. P values from one-way ANOVA followed by Tukey’s multiple comparison test in bd,e (−IFNγ group) and f,g,j (+IFNγ group) and Brown–Forsythe or Welch ANOVA with Dunnett’s post-hoc test in e (+IFNγ group) and h,i,j (−IFNγ group). Scale bars (a), 500 μm. All experiments performed three times, except b (five times). Source Data
Fig. 3
Fig. 3. PLSCR1 blocks coronavirus entry and spike-mediated membrane fusion with host cells.
a, Virus entry into Huh7.5 cells of the indicated genotypes. Cells were challenged with an HIV-1-based luciferase-expressing vector pseudotyped with SARS-CoV-2 spike (USA-WA1/2020) and assayed for luciferase activity at 48 hpi. (n = 3). b, Virus entry into Huh7.5 cells inoculated with pseudovirus bearing spike proteins from SARS-CoV-2 Delta (left) or Omicron (right) (n = 3). c, Viral entry efficiency into Huh7.5 cells inoculated with PsVs bearing fusion proteins from SARS-CoV (n = 3), MERS-CoV (n = 3), bat CoV-WIV1 (n = 5) or VSV (n = 3). d, Quantification of MHV-A59-GFP fluorescent intensity in LET1-ACE2 cells (MOI = 0.1, 24 hpi, n = 5). e, Levels of ACE2 in NC or PLSCR1-KO A549-ACE2 cells using surface biotinylation. Membrane-impermeable biotin was used to label cell-surface proteins, followed by streptavidin pulldown. Surface ACE2 was then quantified by western blot. GAPDH was used as a cytosol marker. Bio-PD, biotin pulldown. f, Virus binding and internalization in NC or PLSCR1-KO Huh7.5 cells. The amount of viral RNA in NC cells was normalized to 1 (n = 4). g, Cleavage of the SARS-CoV-2 spike protein in NC or PLSCR1-KO (PKO) A549-ACE2 cells infected with PsV carrying SARS-CoV-2 spike for the indicated time periods. Cells treated with E-64d (20 μM) served as a negative control (n = 3). IB, immunoblot; NT, N-terminus; FP, fusion peptide; CT, C-terminus. h, Virus–cell fusion assay in Huh7.5 (middle) and 293T-ACE2 (right) cells (n = 3). Fusion was measured by complemented (NanoLuc) activity. i, Left, representative images showing syncytia formation after co-culturing Huh7.5 cells of the indicated genotypes and 293T cells expressing SARS-CoV-2 spike and EGFP. Right, quantification of fusion activity in Huh7.5 cells of the indicated genotypes. Cell–cell fusion was measured by complemented NanoLuc activity (n = 5). j, Left, representative images showing the formation of dsRNA foci in A549-ACE2 cells at 3 hpi. (MOI = 5). dsRNA was detected with a monoclonal rJ2 antibody (MABE1134). Right, percentage of cells with dsRNA foci. n = 10 image fields (NC, 209 cells; PLSCR1-KO, 210 cells analysed). Data are mean ± s.d. P values from two-sided Student’s t-test in f,g,h (middle) and i (−Spike group), two-sided Student’s t-test with Welch’s correction in i (+Spike group), one-way ANOVA followed by Tukey’s multiple comparison test in ad,h (right) and two-sided Mann–Whitney test in j. Scale bars, 200 μm (i) and 20 μm (j). All experiments performed three times, except a,g,i (four times). Source Data
Fig. 4
Fig. 4. The lipid scramblase and antiviral activities of PLSCR1 are uncoupled.
a, Confocal images showing the localization of endogenous (endo.) PLSCR1 and SARS-CoV-2 nucleocapsid in NC or PLSCR1-KO A549-ACE2 cells infected with SARS-CoV-2 (2 hpi, MOI = 25). b, W-4Pi-SMS nanoscopy of endogenous PLSCR1 and SARS-CoV-2 spike detected at single-molecule resolution in A549-ACE2 cells infected with SARS-CoV-2 (2 hpi, MOI = 25). c, Dynamic formation of PLSCR1-coated SARS-CoV-2-containing vesicles. Time-lapse images were obtained at 1-min intervals for around 2 h and snapshots at the indicated time points are presented. A549-ACE2 cells were infected with SARS-CoV-2-PsV-Cherry. PM, plasma membrane. d, Localization of wild-type (WT) PLSCR1 or mutant PLSCR1(5CA) (C184CCPCC189 to AAAPAA) on SARS-CoV-2-containing vesicles. PLSCR1-KO A549-ACE2 cells stably expressing GFP–PLSCR1(WT) or GFP–PLSCR1(5CA) were infected with SARS-CoV-2 for 2 h (MOI = 25) (WT, n = 24 cells; 5CA, n = 28 cells). e, Quantification of SARS-CoV-2 infection in Huh7.5 cells expressing the indicated mutants (MOI = 1, 48 hpi, n = 5). f, Top, AlphaFold2 prediction of surrounding amino acid residues of the Phe281 and His262 sites. Rainbow-coloured from N terminus (blue) to C terminus (red). Bottom, comparative SARS-CoV-2 infection in control or PLSCR1-KO Huh7.5 cells expressing the indicated mutants (MOI = 1, 48 hpi, n = 6). g, FACS plots showing PS externalization in NC, PLSCR1-KO or TMEM16F-KO A549-ACE2 cells in the absence or presence of 10 μM ionomycin. Ionomycin is a membrane-permeable Ca2+ carrier that increases intracellular Ca2+ levels, which triggers PS externalization in a percentage of cells (threshold, dotted line). h, FACS plots showing PS externalization in NC or TMEM16F-KO A549-ACE2 cells stably overexpressing the indicated PLSCR1 mutants in the absence or presence of 10 μM ionomycin. i, Relative PS externalization activity in NC A549-ACE2 cells treated with ionomycin, normalized to 1 (n = 3). j, Cell–cell fusion assay in Huh7.5 cells stably expressing the indicated PLSCR1 mutants co-cultured with 293T cells expressing SARS-CoV-2 spike (n = 6). k, Model of SARS-CoV-2 restriction by PLSCR1. All data are mean ± s.d. P values from two-sided Mann–Whitney test in d and one-way ANOVA followed by Tukey’s multiple comparison test in e,f,i,j. Scale bars 10 μm (a,c,d, main), 5 μm (b, main and a,c,d, inlays) and 500 nm (b, inlays). All experiments performed three times, except a (five times). Source Data
Extended Data Fig. 1
Extended Data Fig. 1. PLSCR1 expression profiles in patients with COVID-19 and in various cell types, together with antiviral responses to different immune stimuli.
a, Representative images of resting or IFNγ-activated Huh7.5 cells infected with SARS-CoV-2-mNG at an MOI of 1 for 48 h. Genotypes of Huh7.5 cells are indicated. Related to Fig. 1f. b, Quantification of % infected cells in a. (n = 3). c, Comparison of the expression level of mRNAs extracted from nasopharyngeal swab between patients with COVID-19 (n = 30) and control individuals who were negative for SARS-CoV-2 (n = 8). Only transcripts with log2-transformed fold change > 1 and adjusted P value < 0.05 are presented on the plot. Several upregulated ISGs with known antiviral activities were highlighted. d, Western blot showing the IFNγ-induced upregulation of PLSCR1 across cell lines. hTEC: human primary tracheal epithelial cells. e, Western blot showing the protein expression of PLSCR1 in cells treated with the indicated cytokines for 20 h. Concentrations used: IFNα2a/β1a (500 U ml−1), IFNγ (500 U ml−1), IFNλ1 (1 ng ml−1), TNF (100 ng ml−1), IL1β (25 ng ml−1). f, Schema depicting the presence and position of GAS and ISRE elements in the promoter region (2 kb upstream from the transcription initiation site) of human PLSCR1 gene. g, Effect of PLSCR1 deficiency on IFNα2a (n = 3), IFNβ1a (n = 4) or IFN λ1 (n = 4) mediated restriction of SARS-CoV-2-mNG infection in Huh7.5 cells (MOI = 1, 48 hpi). Concentrations used: IFNα2a (50 U ml−1), IFNβ1a (2,000 U ml−1) and IFNλ1 (1 ng ml−1). Data are mean ± s.d. P values were calculated using one-way ANOVA followed by Tukey’s multiple comparison test (b) or two-way ANOVA, followed by Tukey’s test (g). Scale bar in a: 500 μm. Experiments in this figure were performed three times. Source Data
Extended Data Fig. 2
Extended Data Fig. 2. The anti-SARS-CoV-2 activity of PLSCR1 in basal conditions is independent of STAT1 and conserved across species.
a, Western blot showing the expression level of the indicated proteins in Huh7.5 cells. Related to Fig. 2b. b, Left, representative images showing the infectivity of SARS-CoV-2-mNG in Huh7.5 cells overexpressing the indicated proteins. Right, western blot showing the expression level of the indicated proteins. Related to Fig. 2d. c, Western blot showing the expression level of the indicated proteins. Related to Fig. 2e. d, Quantification of SARS-CoV-2 infection in Huh7.5 cells of the indicated genotypes in the presence or absence of IFNγ (10 U ml−1) (MOI = 1, 48 hpi). DKO: PLSCR1/STAT1 double-KO. (n = 6) e, Western blot showing the expression level of the indicated proteins in d. f, The expression level of PLSCR1 orthologues in Huh7.5 cells. hPLSCR1: H. sapiens, mPlscr1: M. musculus, batPlscr1: R. sinicus. Related to Fig. 2g. g, Left, representative images showing the infectivity of SARS-CoV-2-mNG in NC or mPlscr1-KO LET1-ACE2 cells. Right, western blot showing the expression level of the indicated proteins. h, Quantification of SARS-CoV-2-mNG infection in LET1-ACE2 cells in g (MOI = 0.1, 24 hpi) (n = 3). Data are mean ± s.d. P values were calculated using one-way ANOVA followed by Tukey’s multiple comparison test in d, h. Scale bar in b: 500 μm. Experiments in this figure were performed three times, except a (five times). Source Data
Extended Data Fig. 3
Extended Data Fig. 3. Anti-SARS-CoV-2 activity across different cell types and ISGs.
a, Expression profile of PLSCR1 across cell types. Data were extracted from the Human Protein Atlas database. b, Western blot showing the protein expression level in hTEpiCs overexpressing the indicated proteins. Related to Fig. 2h. c, Left, quantification of intracellular SARS-CoV-2 RNA in Calu-3 cells (MOI = 1, 24 hpi, n = 4) or SARS-CoV-2-mNG infection in HaCaT-ACE2 (MOI = 1, 24 hpi, n = 3), and Tonsil-ACE2 (MOI = 1, 24 hpi, n = 3) cells. Right, western blot showing the expression level of the indicated proteins in Calu-3, HaCaT-ACE2 or Tonsil-ACE2 cells. d, Left, representative images showing the infectivity of SARS-CoV-2-mNG in HeLa-ACE2 of indicated genotypes. Right, western blot showing the expression level of the indicated proteins in HeLa-ACE2. e, Quantification of intracellular SARS-CoV-2 RNA in heLa-ACE2 in d (MOI = 0.2, 24 hpi, n = 3) cells. f, Western blot showing the expression level in Huh7.5 cells stably overexpressing the indicated ISGs. Related to Fig. 2i. g, Western blot showing the endogenous expression levels of PLSCR1 and LY6E in A549-ACE2 single- or double-KO cells. Related to Fig. 2j. h, Bar graph showing the average restriction ratio (−IFNγ/+ IFNγ) in A549-ACE2 cells after SARS-CoV-2 infection of the indicated genotypes in the presence or absence of IFNγ (100 U ml−1) 48 hpi (MOI = 0.2) (n = 6). Related to Fig. 2j. Data are mean ± s.d. P values were calculated using two-sided Student’s t-test in c (middle and right), two-sided Student’s t-test with Welch’s correction in c (left) or one-way ANOVA followed by Tukey’s multiple comparison test in e. Scale bar in b, f: 500 μm. Experiments in this figure were performed three times. Source Data
Extended Data Fig. 4
Extended Data Fig. 4. PLSCR1 engages both the endosomal pathway and the cell-surface pathway of SARS-CoV-2 entry.
a,b, Quantification of viral entry efficiency in Huh7.5 cells inoculated with pseudoviruses bearing fusion proteins from HCoV-229E (n = 5), HCoV-OC43 (n = 3), hCoV-NL63 (n = 3), hCoV-HKU1 (n = 3), EBoV (n = 3) and HCV (n = 5). EBoV: Ebola virus, HCV: Hepatitis C virus. c, Left, relative amount of intracellular viral RNA in Huh7.5 cells infected with DENV (Dengue virus type I) at an MOI = 0.5 for 24 h. The amount of viral RNA in NC cells was normalized to 1. (n = 4) Right: Quantification of % infected cells in HeLa cells infected with HSV-1 VP26-GFP at an MOI of 0.1 for 48 h. d, Quantification of the relative entry efficiency of the indicated pseudovirus in Huh7.5 cells overexpressing (OE) PLSCR1 or IFITM3. The luminescence intensity in vector group was normalized to 1. n = 4. e, Schematic showing the dissection of the cell entry route of SARS-CoV-2. f,g, Effect of the indicated compounds on SARS-CoV-2 entry in Huh7.5 cells (MOI = 1, 48 hpi, n = 3) (f) and A549-ACE2 cells (MOI = 0.2, 24 hpi, n = 3) (g). E-64d: 20 μM, Camostat: 30 μM, Bfa (Brefeldin a): 10 μM, HCQ: 10 μM. Cells were treated with indicated compounds 2 h before infection. h, Quantification of SARS-CoV-2 infection in E-64d (20 μM) treated or untreated Huh7.5 cells overexpressing vector or PLSCR1 with or without ectopic expression of TMPRSS2 (MOI = 1, 48 hpi). (n = 4) i, Left, dose response of indicated compounds on SARS-CoV-2 infection in Calu-3 (MOI = 1, 24 hpi, n = 4). The amount of viral RNA in DMSO group was normalized to 1. E64-d and Camostat groups share the same DMSO control group. Right, quantification of SARS-CoV-2 infection in Control or PLSCR1-KO Calu-3 (MOI = 1, 24 hpi, n = 4) treated with indicated compounds (E-64d: 20 μM, Camostat: 20 μM). Cells were treated with the indicated compounds 2 h before infection. The amount of viral RNA in NC-DMSO group was normalized to 1. Data are mean ± s.d. P values were calculated using one-way ANOVA followed by Tukey’s multiple comparison test in ac,d (HCoV-NL63 group), f,g, Brown–Forsythe and Welch ANOVA with Dunnett’s post-hoc test in d (SARS-CoV-2 and EBoV group), two-sided Student’s t-test in h, two-way ANOVA followed by Tukey’s multiple comparison test in i (left) or two-way ANOVA followed by Šídák’s multiple comparisons test in i (right). Experiments in this figure were performed three times. Source Data
Extended Data Fig. 5
Extended Data Fig. 5. PLSCR1 blocks virus–cell membrane fusion and the subsequent release of viral content.
a, Representative images showing the localization of indicated proteins in uninfected or infected WT A549-ACE2 cells treated with 20 μM E-64d at MOI = 20 for 4 h (left). Quantification of the average amount of spike and nucleocapsid double-positive particles per cell (right). n = 10 image fields (NC: 146 cells, KO: 131 cells). b, Representative images showing the localization of indicated proteins in uninfected or infected WT A549-ACE2 cells treated with 20 μM HCQ at MOI = 20 for 4 h (left). Quantification of the average amount of spike and nucleocapsid double-positive particles per cell (right). n = 10 image fields (NC: 141 cells, KO: 156 cells). c, Quantification of fluorescence intensities of Lysosensor in control or PLSCR1-KO A549-ACE2 cells in the presence or  absence of HCQ (20 μM). (n = 3). d, Western blot showing the protein expression levels in 293T-ACE2 cells. Related to Fig. 3h. e, Quantification of cell–cell fusion by co-culture of Huh7.5 cells overexpressing vector or PLSCR1 and 293T cells expressing SARS-CoV-2 spike. (n = 6). f, Left, representative images showing the of distribution of SARS-CoV-2 spike and nucleocapsid protein in control or PLSCR1-KO A549-ACE2 cells (MOI = 10, 4 hpi). Orange stars represent cells with dispersed and bright nucleocapsid signal. Blue stars represent cells with endosomal nucleocapsid signal. Right, quantification of the percentage of cells with dispersed or endosomal nucleocapsid signal. Number of cells analysed within each of 10–11 fields (left to right):142, 181, 146, 131, 141 and 156. n values are labelled on graph. Data are mean ± s.d. P values were calculated using two-sided Student’s t-test in a,b,f, two-sided Student’s t-test with Welch’s correction in e or one-way ANOVA followed by Tukey’s multiple comparison test in c. Scale bar in a, b, f: 20 μm, inlays: 5 μm. Experiments in this figure were performed three times. Source Data
Extended Data Fig. 6
Extended Data Fig. 6. Cell biology of PLSCR1 in anti-SARS-CoV-2 activity.
a, Representative images showing the localization of endogenous PLSCR1 and SARS-CoV-2 spike in WT A549-ACE2 cells during the early stage of virus entry. Time post-infection is indicated. (MOI = 25). b, Representative images showing the localization of endogenous PLSCR1 and SARS-CoV-2 nucleocapsid in WT A549-ACE2 cells during the early stage of virus entry. Time post-infection is indicated. (MOI = 25). c, Deconvolution confocal images showing the colocalization of endogenous PLSCR1 and SARS-CoV-2 nucleocapsid. (MOI = 25, 2 hpi). d, Three-dimensional confocal microscopy images showing the colocalization of endogenous PLSCR1 and SARS-CoV-2 nucleocapsid in A549-ACE2 cells at 2 hpi. (MOI = 25). e, Representative images of the localization of endogenous PLSCR1 and viral replication centre (indicated by dsRNA) in A549-ACE2 cells during virus infection. Time post-infection is indicated. (MOI = 25). f, Representative images showing the localization of endogenous PLSCR1 and human transferrin–Alexa Fluor 488 30 min after treatment. Scale bar in a,b,e: 10 μm, inlays: 5 μm. Scale bar in c: 5 μm, inlays: 1 μm. Scale bar in d,f: 20 μm, inlays: 5 μm. Experiments in this figure were performed three times, except ac (five times).
Extended Data Fig. 7
Extended Data Fig. 7. Comparison of PLSCR1 with other endolysosomal membrane proteins during SARS-CoV-2 infection.
a, Left, confocal images showing the localization of endogenous PLSCR1 and LAMP1 in uninfected or infected WT A549-ACE2 cells (MOI = 20, 2 hpi). Middle and right, quantification of the percentage of PLSCR1 intensity colocalized with LAMP1 (middle) or the Mander’s colocalization coefficient of PLSCR1 with LAMP1 (right). Uninfected group: n = 10 image fields (63 cells), infected group: n = 13 image fields (96 cells). b, Quantification of the average number of PLSCR1-positive foci per cell. Uninfected group: n = 10 image fields (63 cells), infected group: n = 13 image fields (96 cells). c, Left, representative images showing the localization of endogenous PLSCR1 and CD63 in uninfected or infected WT A549-ACE2 cells (MOI = 20, 2 hpi). Middle and right, quantification of the Mander’s colocalization coefficient of PLSCR1 with CD63 (middle) or the percentage of PLSCR1 intensity colocalized with CD63 (right). Uninfected group: n = 11 image fields (51 cells), infected group: n = 10 image fields (54 cells). d, Representative images showing the localization of endogenous PLSCR1 and Flag–IFITM3 in uninfected or infected WT A549-ACE2 cells (MOI = 20, 2 hpi). Data are mean ± s.d. P values were calculated using two-sided Student’s t-test in a,b,c (middle) or two-sided Student’s t-test with Welch’s correction in c (right). Scale bar in a and c: 10 μm, inlays: 5 μm. Scale bar in d: 20 μm, inlays: 5 μm. Experiments in this figure were performed three times. Source Data
Extended Data Fig. 8
Extended Data Fig. 8. Structure–function determinants of PLSCR1 anti-SARS-COV-2 activity.
a, AlphaFold2 structure prediction of sequences deleted from PLSCR1. b, Domain map depicting the generation of truncations and mutations of PLSCR1. c, Quantification of SARS-CoV-2 infection in control or PLSCR1-KO Huh7.5 cells expressing the indicated truncations (MOI = 1, 48 hpi). (n = 3). d, Western blot showing the expression level of the indicated truncations or mutations of PLSCR1 in Huh7.5 cells in c. e,f, Western blots showing the expression level of the indicated truncations or mutations of PLSCR1 in Huh7.5 cells. Related to Fig. 4f. g, Quantification of SARS-CoV-2 pseudovirus infection in hTEpiCs stably expressing the indicated PLSCR1 mutants. Luciferase activity was measured at 48 hpi (n = 5). h, Western blot showing the expression level of the indicated mutations of PLSCR1 in hTEpiCs in g. i, Representative images showing the localization of GFP–PLSCR1 F281A and H262Y mutants on SARS-CoV-2-containing vesicles in A549-ACE2 PLSCR1-KO cells infected with SARS-CoV-2 for 2 h (MOI = 25). Data are mean ± s.d. P values were calculated using one-way ANOVA followed by Tukey’s multiple comparison test in c,g. Scale bar in i: 10 μm, inlays: 5 μm. Experiments in this figure were performed three times. Source Data
Extended Data Fig. 9
Extended Data Fig. 9. The anti-SARS-CoV-2 activity of PLSCR1 is independent of its nuclear localization signal.
a, Left, quantification of SARS-CoV-2 infection in Huh7.5 cells expressing the indicated mutants of PLSCR1 (MOI = 1, 48 hpi). KKHA: K258K261H262 to Ala. Right, western blot showing the protein expression. (n = 3). b, Volcano plot comparing the mRNA expression level between NC and PLSCR1-KO Huh7.5 in the absence or presence of IFNγ. Transcripts with Log2FC > 1 and adjusted P value < 0.05 are highlighted in red. (n = 3). c, Sequence homology alignment of sequences flanking the H262 residue in PLSCR1 orthologues. d, Left, quantification of SARS-CoV-2 infection in NC or PLSCR1-KO Huh7.5 cells expressing the indicated mutants of human, mouse or bat PLSCR1. (MOI = 1, 48 hpi). Right, western blot showing the protein expression. (n = 6). e, Left, quantification of SARS-CoV-2 infection in NC or PLSCR1-KO Huh7.5 cells expressing the indicated single-point substitutions of the H262 residue. (MOI = 1, 48 hpi). Right, western blot showing the protein expression. (n = 6). Data are mean ± s.d. P values were calculated using one-way ANOVA followed by Tukey’s multiple comparison test in a,d,e or DESeq2 algorithm in b. Experiments in this figure were performed three times. Source Data
Extended Data Fig. 10
Extended Data Fig. 10. The anti-SARS-CoV-2 activity of PLSCR1 is uncoupled from its phospholipid scramblase activity.
a, MDS analysis of RMSF for the β-barrel domain of PLSCR1 WT and the H262Y mutant. b, MDS analysis of the hydrogen bond network surrounding the amino acid 262 residue in WT and the H262Y mutant. c, Schema depicting the PS externalization assay. Externalized PS was detected by membrane-impermeable Annexin V conjugated with Alexa647. d, Western blot showing the protein expression level. Related to Fig. 4g. e, Western blot showing the protein expression level. Related to Fig. 4h. f, Schema depicting the preparation of GPMVs. g, Representative images showing GPMVs generated from A549-ACE2-PLSCR1-KO cells stably expressing GFP–PLSCR1 WT or 5CA protein. (WT: n = 12; 5CA: n = 7). h, GPMV bending rigidity values. Data are mean ± s.d. P values were calculated using two-sided Student’s t-test in h. Scale bar in g: 10 μm. Experiments in this figure were performed three times, except h (two times). Source Data

Similar articles

  • PLSCR1 suppresses SARS-CoV-2 infection by downregulating cell surface ACE2.
    Ma R, Zhang X, Li R, Dong X, Wang W, Jiang Q, Xiao X, Shi Y, Chen L, Zheng T, Xiang Z, Ren L, Zhou Z, Lei X, Wang J. Ma R, et al. J Virol. 2025 Mar 18;99(3):e0208524. doi: 10.1128/jvi.02085-24. Epub 2025 Feb 13. J Virol. 2025. PMID: 39945535 Free PMC article.
  • Altered TMPRSS2 usage by SARS-CoV-2 Omicron impacts infectivity and fusogenicity.
    Meng B, Abdullahi A, Ferreira IATM, Goonawardane N, Saito A, Kimura I, Yamasoba D, Gerber PP, Fatihi S, Rathore S, Zepeda SK, Papa G, Kemp SA, Ikeda T, Toyoda M, Tan TS, Kuramochi J, Mitsunaga S, Ueno T, Shirakawa K, Takaori-Kondo A, Brevini T, Mallery DL, Charles OJ; CITIID-NIHR BioResource COVID-19 Collaboration; Genotype to Phenotype Japan (G2P-Japan) Consortium; Ecuador-COVID19 Consortium; Bowen JE, Joshi A, Walls AC, Jackson L, Martin D, Smith KGC, Bradley J, Briggs JAG, Choi J, Madissoon E, Meyer KB, Mlcochova P, Ceron-Gutierrez L, Doffinger R, Teichmann SA, Fisher AJ, Pizzuto MS, de Marco A, Corti D, Hosmillo M, Lee JH, James LC, Thukral L, Veesler D, Sigal A, Sampaziotis F, Goodfellow IG, Matheson NJ, Sato K, Gupta RK. Meng B, et al. Nature. 2022 Mar;603(7902):706-714. doi: 10.1038/s41586-022-04474-x. Epub 2022 Feb 1. Nature. 2022. PMID: 35104837 Free PMC article.
  • Pan-beta-coronavirus subunit vaccine prevents SARS-CoV-2 Omicron, SARS-CoV, and MERS-CoV challenge.
    Wang G, Verma AK, Guan X, Bu F, Odle AE, Li F, Liu B, Perlman S, Du L. Wang G, et al. J Virol. 2024 Sep 17;98(9):e0037624. doi: 10.1128/jvi.00376-24. Epub 2024 Aug 27. J Virol. 2024. PMID: 39189731 Free PMC article.
  • Therapeutic nanobodies against SARS-CoV-2 and other pathogenic human coronaviruses.
    Yang Y, Li F, Du L. Yang Y, et al. J Nanobiotechnology. 2024 May 31;22(1):304. doi: 10.1186/s12951-024-02573-7. J Nanobiotechnology. 2024. PMID: 38822339 Free PMC article. Review.
  • Phospholipid scramblase 1: a frontline defense against viral infections.
    Yang AX, Norbrun C, Sorkhdini P, Zhou Y. Yang AX, et al. Front Cell Infect Microbiol. 2025 Apr 3;15:1573373. doi: 10.3389/fcimb.2025.1573373. eCollection 2025. Front Cell Infect Microbiol. 2025. PMID: 40248364 Free PMC article. Review.

Cited by

References

    1. Pairo-Castineira E, et al. Genetic mechanisms of critical illness in COVID-19. Nature. 2021;591:92–98. doi: 10.1038/s41586-020-03065-y. - DOI - PubMed
    1. COVID-19 Host Genetics Initiative. Mapping the human genetic architecture of COVID-19. Nature600, 472–477 (2021). - PMC - PubMed
    1. Kousathanas A, et al. Whole-genome sequencing reveals host factors underlying critical COVID-19. Nature. 2022;607:97–103. doi: 10.1038/s41586-022-04576-6. - DOI - PMC - PubMed
    1. Pairo-Castineira, E. et al. GWAS and meta-analysis identifies 49 genetic variants underlying critical COVID-19. Nature617, 764–768 (2023). - PMC - PubMed
    1. MacMicking JD. Interferon-inducible effector mechanisms in cell-autonomous immunity. Nat. Rev. Immunol. 2012;25:367–382. doi: 10.1038/nri3210. - DOI - PMC - PubMed

MeSH terms

Supplementary concepts