. 2023 Aug;620(7972):209-217.
doi: 10.1038/s41586-023-06340-w. Epub 2023 Jul 12.

High-throughput Oligopaint screen identifies druggable 3D genome regulators

Affiliations

High-throughput Oligopaint screen identifies druggable 3D genome regulators

Daniel S Park et al. Nature. 2023 Aug.

Abstract

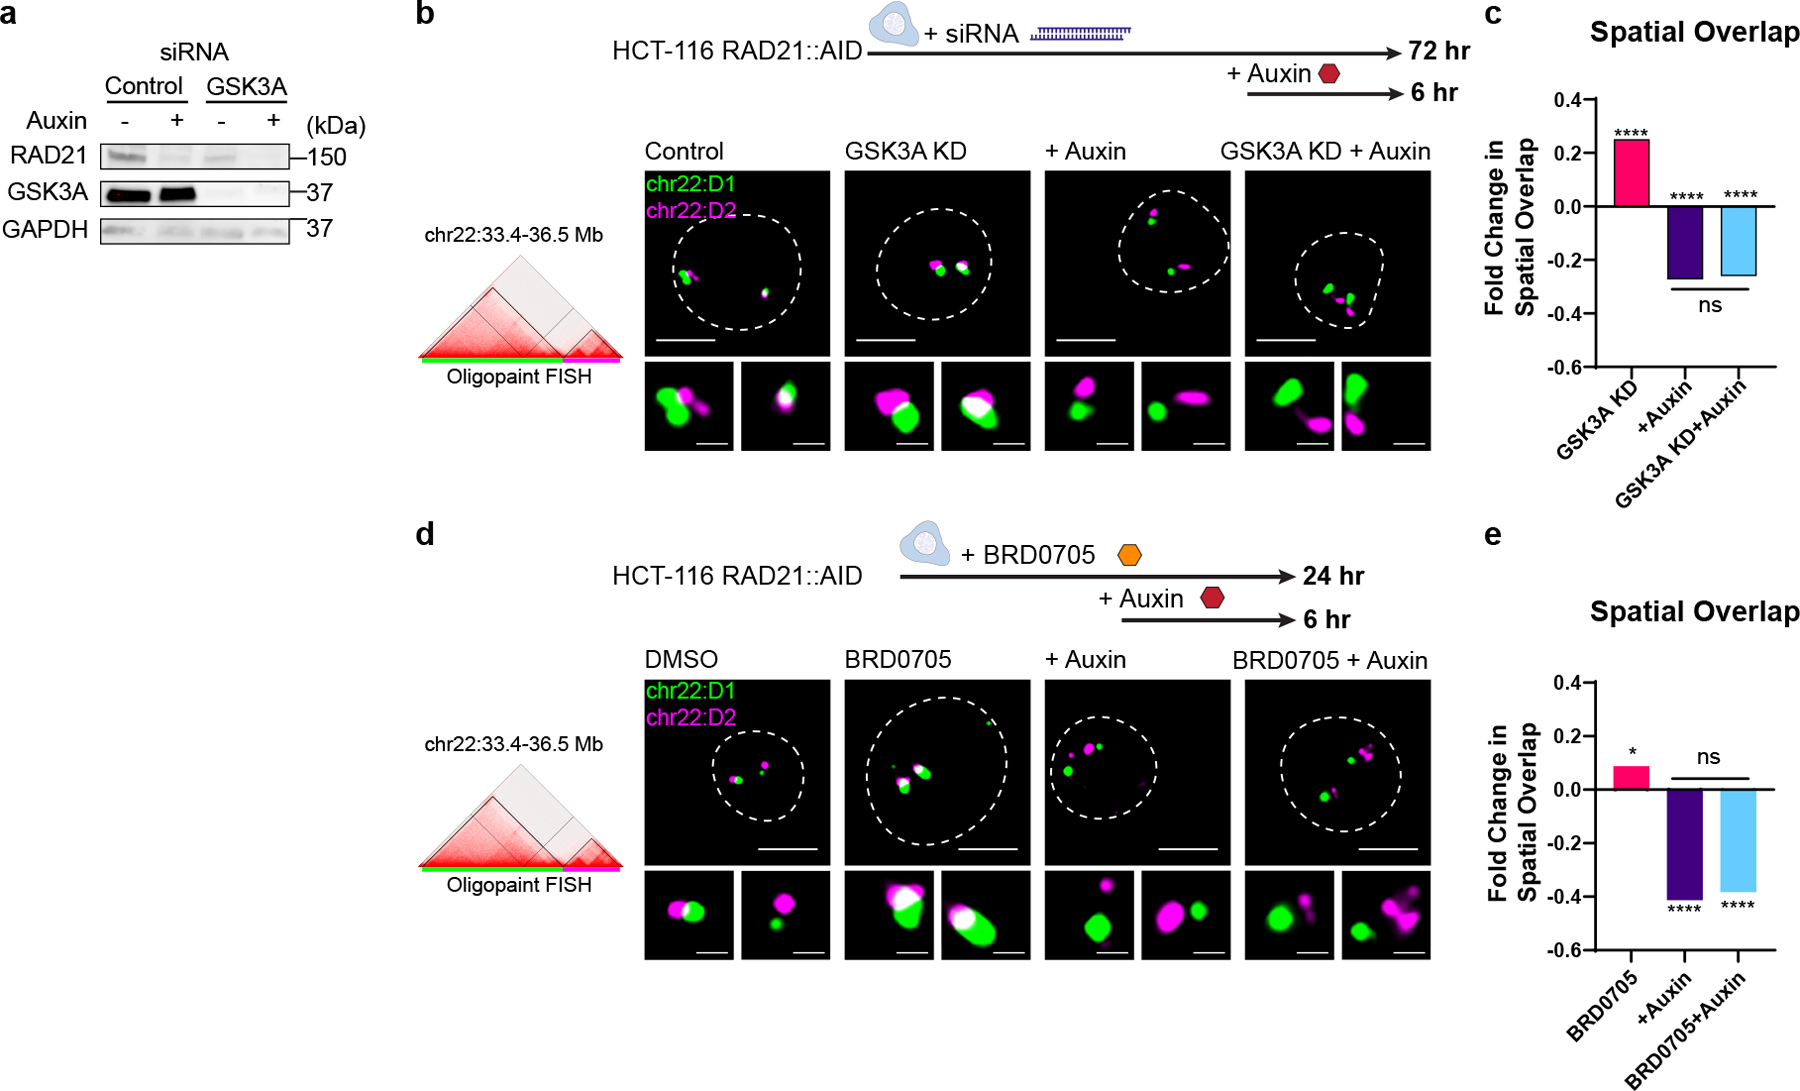
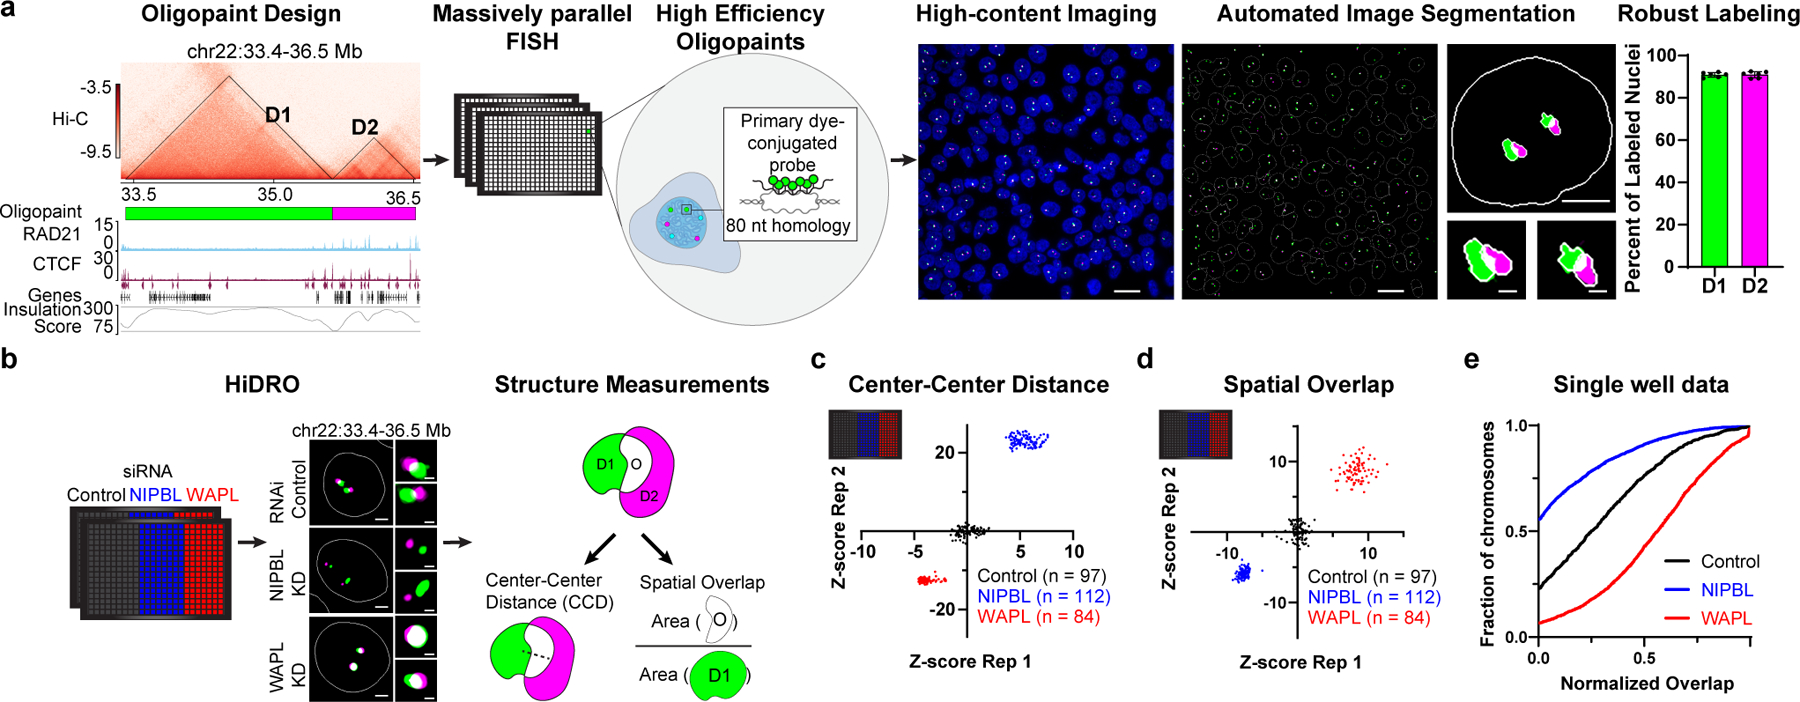
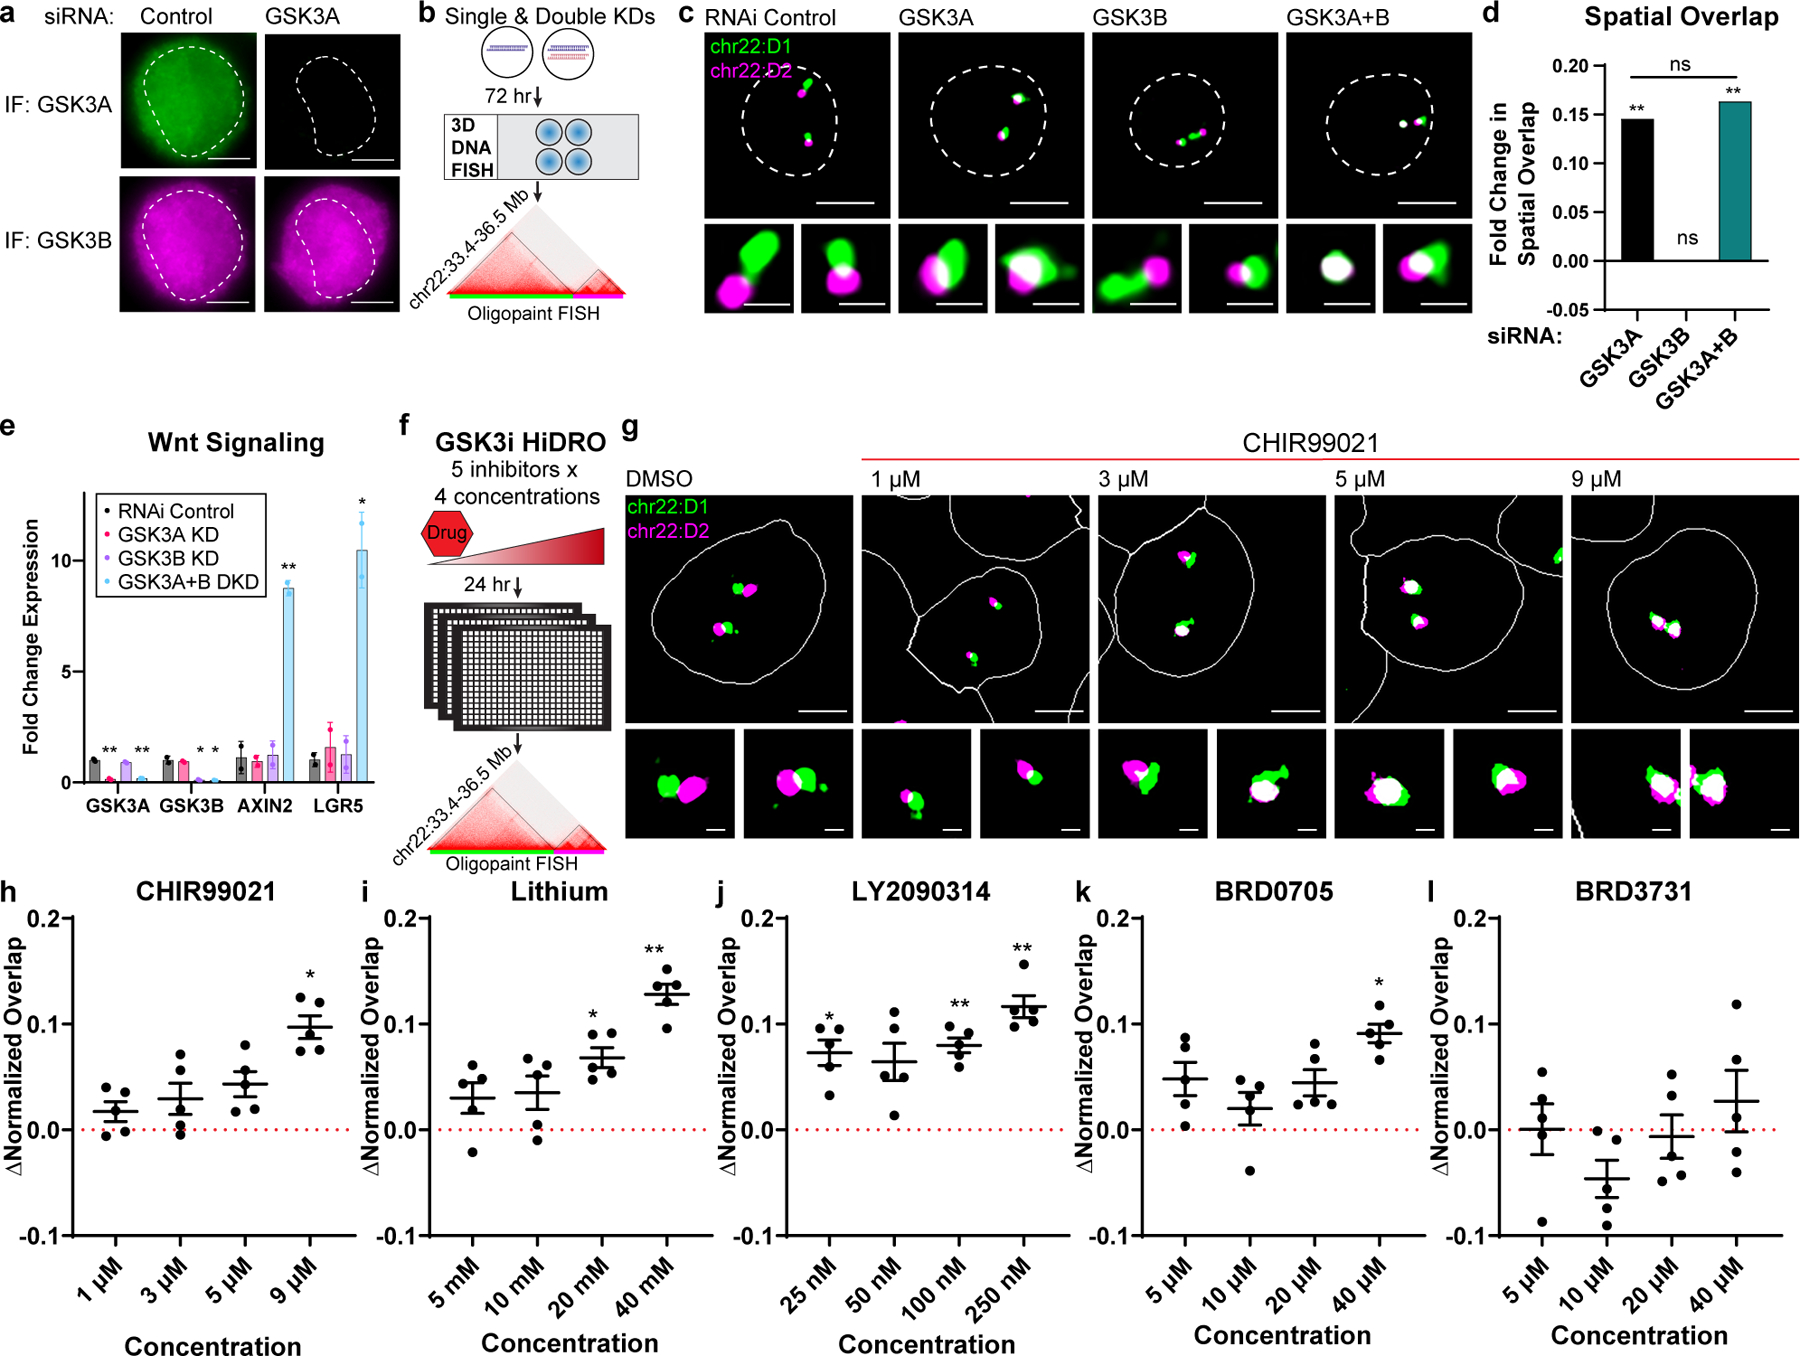
The human genome functions as a three-dimensional chromatin polymer, driven by a complex collection of chromosome interactions1-3. Although the molecular rules governing these interactions are being quickly elucidated, relatively few proteins regulating this process have been identified. Here, to address this gap, we developed high-throughput DNA or RNA labelling with optimized Oligopaints (HiDRO)-an automated imaging pipeline that enables the quantitative measurement of chromatin interactions in single cells across thousands of samples. By screening the human druggable genome, we identified more than 300 factors that influence genome folding during interphase. Among these, 43 genes were validated as either increasing or decreasing interactions between topologically associating domains. Our findings show that genetic or chemical inhibition of the ubiquitous kinase GSK3A leads to increased long-range chromatin looping interactions in a genome-wide and cohesin-dependent manner. These results demonstrate the importance of GSK3A signalling in nuclear architecture and the use of HiDRO for identifying mechanisms of spatial genome organization.


Conflict of interest statement

Declaration of interests

The authors declare no competing interests.

Figures

Extended Data Figure 1.
Extended Data Figure 1.. Additional DNA HiDRO spot efficiency and RNA HiDRO workflow, Related to Figure 1.
a) Labeling efficiency for D1 locus as measured by percent of nuclei with at least one signal for different Oligopaint probe designs including dye-conjugated 80-mers (DC 80), secondary 80-mers (SL 80) and secondary labeled 42-mers (SL 42, conventional Oligopaints used in ref). Each bar is mean +/- SD. [n = 12 biological replicate wells for all conditions except DC80 1pmol/well and 2pmol/well (n = 24) and UL80 25 pmol/well (n = 11)]. b) Labeling efficiency for D2 locus for different Oligopaint probe designs. Each bar is mean +/- SD. [n = 12 biological replicate wells for all conditions except DC80 1pmol/well and 2pmol/well (n = 24) and UL80 25 pmol/well (n = 11)]. c) Ideograms showing chromosomal locations of Oligopaint probes to 42 DNA regions tested by HiDRO. d) Labeling efficiency as measured by percent of nuclei in a well with one or more signals detected. Chr22 D1 (green) and D2 (magenta) highlighted. Each data point represents mean +/- SEM of six biological replicates. e) – (p) Hi-C contact matrices for boundaries tested by DNA HiDRO. Hi-C from ref; tracks below are Oligopaint design, RAD21 ChIP-seq peaks (ENCODE ENCFF001UEG), CTCF ChIP-seq peaks with directionality (GEO GSM1022652), Genes, Compartment designation by eigenvector, lamina associated domains (LADs) (4DN Data Portal : 4DNFI2BGIZ5F), superenhancers, and insulation scores. Percentages above each domain represent the probe efficiency for that domain as measured by the percentage of nuclei with at least one spot detected. q) Schematic for RNA HiDRO. Probes can be designed to introns and/or exons and RNA FISH is performed in 384-well plates. Wells are imaged on a high-content microscope, and nascent signals in the nucleus are segmented and measured computationally. Solid white line indicates nuclear edge. Scale bar field, 10 µm; Scale bar nucleus, 5 µm. r) Bursting frequency of three genes MCM5, LRCC20, and CHPF as measured by 3D RNA FISH on slides and RNA HiDRO shown. Each dot represents one biological replicate of bursting frequency calculated from greater than 100 nuclei. ns = P>0.05, two-tailed t-test. [Biological replicate wells for MCM5 Slides and HiDRO: n = 4; LRCC20 Slides n = 6, HiDRO n = 4; CHPF Slides n = 6, HiDRO n = 10].
Extended Data Figure 2.
Extended Data Figure 2.. HiDRO screen validated hits are region non-specific regulators of TAD boundaries, Related to Figure 2.
a) Protein classes of genes in the Druggable Genome library. Targeted genes encode proteins across diverse classes including kinases, membrane and extracellular matrix proteins, and proteases. n = 3083. b) Protein class designations of all primary hits from Druggable Genome HiDRO screen (n = 58). c) Protein class designations of primary hits that increase inter-TAD interactions (n = 33). d) Protein class designations of primary hits that decrease inter-TAD interactions (n = 25). e) Representative images of chr22:D1-D2 for hits altering inter-TAD interactions. Solid white line indicates nuclear edge. Scale bar nucleus, 5 µm; Scale bar spots, 1 µm. Each gene was tested in two biological replicates. f) Correlation heatmap of 21 image-based phenotypes with color-coded squares outlining the five measurement categories used for the phenotypic tree in Fig. 2f. The five categories are overlap metrics, domain area, domain shape, nuclear area and nuclear shape. g) Histogram of nuclear area for non-targeting control wells from replicate 1 of Fig. 1b data. Black lines denote the 20th (142 µm2) and 30th percentiles (170 µm2) of nuclear area, representing G1 nuclei. Red lines denote the 70th (283 µm2) and 80th percentiles (354 µm2) of nuclear area, representing G2 nuclei. n = 128 wells. h) Violin plot of D1 spots detected per nucleus per well in G1 and G2 nuclei. Solid line is median, dotted lines are 25th and 75th percentiles. [Data from n = 128 wells for each bar.] i) Violin plot of mean CCD per well in G1 and G2 nuclei. Solid line is median, dotted lines are 25th and 75th percentiles. [Data from n = 128 wells for each bar.] ns P-value > 0.05, two-tailed t-test. j) Violin plot of mean D1 overlap per well in G1 and G2 nuclei. Solid line is median, dotted lines are 25th and 75th percentiles. [Data from n = 128 wells for each bar.] ns P-value > 0.05, two-tailed t-test. k) Validation HiDRO screen workflow tests each primary hit with four independent siRNA duplexes in separate wells, then applies DNA FISH to chr22 domains D1 and D2. l) Hi-C contact matrix and Oligopaint design for three adjacent TADs on chr3. Hi-C data from ref. Fold change in spatial overlap between chr3 D1 and D2 for top hits. [Data from one well per condition of HiDRO experiment; Number of Alleles for Control (n = 1,075), WAPL (n = 426), GSK3A (n = 855), CALM1 (n = 1,321), FBXL14 (n = 1,184)]. *** P-value < 0.001, **** P-value < 0.0001, two-tailed Mann-Whitney U test. m) Heatmap displaying fold change in CCD at 13 boundaries across the human genome for WAPL, GSK3A, CALM1 and FBXL14 KD. Each boundary was tested with 3–4 biological replicates per gene KD. n) Fold change in CCD versus insulation score at boundary for top siRNA KD. For each graph, x-axis is insulation score of the boundary. Insulations scores from ref. Y-axis is fold change in center-center distance between domains relative to control. Each point is the mean of 4 biological replicates except WAPL KD at insulation scores 91, 119, 142, 149, 195 (n = 3 replicates) error bars are +/- SEM. o) Number of significantly altered boundaries as measured by D1 overlap and D2 overlap for different gene KD.
Extended Data Figure 3.
Extended Data Figure 3.. Validation of a non-canonical role for GSK3A in inter-TAD interactions, Related to Figure 3.
a) Representative fields of control and GSK3A KD HCT-116 cells after IF to GSK3A and GSK3B. Scale bar, 25 µm. b) Western blot of whole cell lysate after KD of GSK3A, GSK3B, or GSK3A+GSK3B. Proteins were labeled with HRP-linked antibodies. [Images in order top to bottom. Blot 1: Beta-catenin total, GAPDH; Blot 2: phospho-Beta-catenin Ser675 (activated), GSK3A, GAPDH; Blot 3: phospho-Beta-catenin Ser33/37/Thr41 (marked for degradation), GSK3B, GAPDH]. c) Representative 3D DNA FISH images of chr22 domains after KD of GSK3A using four independent siRNA constructs. Dotted white line indicates nuclear edge. Scale bar nucleus, 5 µm; Scale bar spots, 1 µm. d) Fold change in spatial overlap between chr22:D1 and D2 after KD of GSK3A using four independent siRNA constructs and a pool of all four constructs. * P-value < 0.05, *** P-value < 0.001, *** P-value < 0.0001, two-tailed Mann-Whitney U-test. [Alleles for RNAi Control (n = 961), GSK3A Pool (n = 383), GSK3A #1 (n = 807), GSK3A #2 (n = 586), GSK3A #3 (n = 314), GSK3A #4 (n = 571)]. e) Western blot of whole cell lysate after GSK3A KD using four independent siRNA constructs and pool of all four constructs leads to selective depletion of GSK3A. Proteins were labeled with HRP-linked antibodies. All lanes cropped from same blot to show only relevant lanes. f) Representative 3D DNA FISH images of chr22 domains after 24 hour DMSO- and BRD0705- (GSK3Ai, 20 µM) treated HCT-116 cells. Dotted white line indicates nuclear edge. Scale bar nucleus, 5 µm; Scale bar spots, 1 µm. g) Fold change in spatial overlap after 24 hour 20 µM BRD0705 treatment for four TAD boundaries of varying insulation scores. ** P-value < 0.01, **** P-value < 0.0001, two-tailed Mann-Whitney U-test. [Number of alleles for chr3:D1-D2: DMSO Control (n = 556), BRD0705 (n = 502); chr3:D2-D3: Control (n = 542), BRD0705 (n = 491); chr22:D1-D2: Control (n = 732), BRD0705 (n = 440); chr22:D2-D3: Control (n = 687), BRD0705 (n = 427)].
Extended Data Figure 4.
Extended Data Figure 4.. Hi-C reveals long-range looping interactions are gained in GSK3A KD, Related to Figure 4.
a) Tukey box plots for stratum-adjusted correlation coefficient per chromosome for replicates of Hi-C in control, GSK3A KD, WAPL KD and PDS5A KD. Lower whisker = 25th percentile – 1.5*IQR, lower box bound = 25th percentile, middle of box = median, upper box bound = 75th percentile, upper whisker = 75th percentile + 1.5*IQR. [n = 23 chromosomes for each condition]. b) Log2 of difference (GSK3A KD replicate 2 – control replicate 2) in contact probability as a function of genomic distance (log scale). Dotted line at 500 kb indicates divide between short-range intra-TAD and long-range inter-TAD interactions. c) Domain counts for TAD [Control (n = 2,253), GSK3A KD (n = 2,271)] and subTADs [Control (n = 18,117), GSK3A KD (n = 19,632)]. d) Violin plot of TAD length in kb. Solid line is median, dotted lines are 25th and 75th percentiles. [Control (n = 2,253), GSK3A KD (n = 2,271)]. e) Violin plot of subTAD length in kb. [Control (n = 18,117), GSK3A KD (n = 19,632)]. f) Insulation score pileup at control TAD boundaries in control replicate 1, control replicate 2, GSK3A KD replicate 1 and GSK3A KD replicate 2 Hi-C. g) 3D pileup plots of Hi-C interactions in control and GSK3A KD at control subTAD boundaries, as well as log2 fold change in interactions across those boundaries. h) 3D pileup plots of Hi-C interactions in control and WAPL KD at control TAD boundaries, as well as log2 fold change in interactions across those boundaries. i) 3D pileup plots of Hi-C interactions in control and PDS5A KD at control TAD boundaries, as well as log2 fold change in interactions across those boundaries. j) Upset plot of chromatin loop intersections between control, GSK3A KD, PDS5A KD and WAPL KD. [Control (n = 11,895), GSK3A KD (n = 7,721), PDS5A KD (n = 8,294), WAPL (n = 23,278)]. k) Aggregate peak analysis of control and GSK3A KD at union set of loops across control and GSK3A KD (n = 13,491). l) 3D pileup plots of Hi-C interactions in control, GSK3A KD, WAPL KD and PDS5A KD at stripes detected in control. m) Hi-C contact matrices for control, WAPL KD, and WAPL KD – Control subtraction at chr7:81.5–85 Mbp. Looping interactions highlighted with squares on contact map and arcs below contact map. For subtraction map, red loops are gained in WAPL KD, and blue loops are lost. n) Hi-C contact matrices for control, PDS5A KD, and PDS5A KD – Control subtraction at chr7:81.5–85 Mbp. Looping interactions highlighted with squares on contact map and arcs below contact map. For subtraction map, red loops are gained in PDS5A KD, and blue loops are lost.
Extended Data Figure 5:
Extended Data Figure 5:. GSK3A regulates genome folding in a cohesin-dependent manner.
(a) Western blot of whole cell lysate after six hour auxin treatment in HCT-116-RAD21-mClover-AID cells and depletion of GSK3A after 72 hour RNAi KD. Proteins are labeled with HRP-linked antibodies. All bands and lanes from same blot. (a) Representative 3D DNA FISH images of chr22 domains following six-hour RAD21 auxin-inducible degradation, 72 hour GSK3A KD or both. Dotted white line indicates nuclear edge. Scale bar for nucleus, 5 µm; scale bar for spots, 1 µm. (b) Fold change in spatial overlap between chr22:D1-D2 after GSK3A KD, RAD21 degradation or both. ns P-value > 0.05, **** P-value < 0.0001, two-tailed Mann-Whitney U-test. [Alleles for Control (n = 669); GSK3A KD (n = 712); +Auxin (n = 680); GSK3A KD + Auxin (n = 560)]. (b) Representative 3D DNA FISH images of chr22 domains after auxin-inducible degradation of RAD21, 24 hour treatment with BRD0705 (GSK3Ai) or both. Dotted white line indicates nuclear edge. Scale bar nucleus, 5 µm; Scale bar spots, 1 µm. (c) Fold change in mean spatial overlap at chr22:D1-D2. ns P-value > 0.05, * P-value < 0.05, **** P-value < 0.0001, two-tailed Mann-Whitney U-test. [Alleles for control (n = 350), BRD0705 (n = 302), +Auxin (n = 525), BRD0705+Auxin (n = 280)].
Extended Data Figure 6:
Extended Data Figure 6:. GSK3A regulates levels of cohesin on chromatin.
a) RT-qPCR of architectural proteins after GSK3A, GSK3B or GSK3A+B KD. Bar is mean of two biological replicates +/- SD. Each biological replicate data point is the average of three technical replicates. b) Western blots to cohesin components and CTCF in whole cell lysate after GSK3A, GSK3B or GSK3A+B KD. Proteins are labeled with fluorescent antibodies. Two biological replicates shown, run on the same gel with ladder lanes cropped out. [Images in order top to bottom. From Blot 1: NIPBL, WAPL, GSK3A, CTCF, GAPDH; Blot 2: RAD21, GSK3B, GAPDH]. c) Representative images from half-nuclear FRAP of RAD21-mClover in control and GSK3A KD HCT-116-RAD21-mClover-AID cells. Scale bar, 5 µm. d) Half-nuclear FRAP curves for RAD21-mClover in control and GSK3A KD HCT-116-RAD21-mClover-AID cells. [Control (n = 22 nuclei), GSK3A KD (n = 21 nuclei)]. Each point is median of all nuclei for that condition +/- 95% CI. e) Model of core cohesin components bound to chromatin: RAD21 (yellow) and SMC1A (blue). f) Chromatin-bound to nucleoplasmic ratio of RAD21 or SMC1A, normalized to loading control (HDAC2). Dotted line represents control. Bar is mean +/- SD of three biological replicates. Western blots in Extended Data Fig. 6g. * P-value < 0.05, ** P-value < 0.01, *** P-value < 0.001, two-tailed t-test of each condition vs negative control. P-values left to right: 0.0236, 0.0425, 0.0167, 0.0045, 0.0002, 0.0263. g) Western blots of nuclear and chromatin-bound fractions of cohesin components following GSK3A KD, PDS5A KD and WAPL KD. Proteins are labeled using fluorescent antibodies. Corresponds to Extended Data Fig. 6f. Three total biological replicates. h) Representative genome browser image of chr3:44.5–45.2Mbp with RAD21 ChIP signal for control and GSK3A KD and CTCF ChIP signal for control. * = significantly increased RAD21 sites. i) Genome browser track chr22:16.8–18.1 Mbp with RAD21 and CTCF ChIP-seq signal shown. * = significantly gained RAD21 site. j) RAD21 occupancy for control and GSK3A KD at retained (n = 50,874) and significantly gained (n = 4,069) RAD21 sites. k) CTCF occupancy for control at retained (n = 50,874) and gained (n = 4,069) RAD21 sites. l) Percentage of retained and gained RAD21 sites that overlap with at least one CTCF peak.
Extended Data Figure 7:
Extended Data Figure 7:. GSK3A genetically interacts with WAPL to regulate cohesin levels.
a) Plasmid maps for inserting WAPL-mAID2-mClover3-Hygromycin and WAPL-mAID2-mClover3-Neomycin into parental HCT-116-OsTir1(F74G) cell line to create HCT-116-WAPL-AID2 cell line. DNA electrophoresis below confirms insert of both cassettes. b) Western blot of WAPL from HCT116-WAPL-AID lysate +/- WAPL KD and +/- auxin-inducible degradation of WAPL. LE = long exposure, SE = short exposure. c) Representative images of RAD21 immunofluorescence after auxin-induced degradation of WAPL and/or siRNA treatment. Median RAD21 signal granularity noted in red. Quantification in Extended Data Fig. 5. Scale bar nucleus, 5 µm. d) Median RAD21 signal granularity for +/- siRNA treatment and +/- degradation of WAPL. Each bar is median. [Replicate wells for -Auxin, Control (n = 13), GSK3A (n = 14), WAPL (n = 9), GSK3A + WAPL (n = 14). For +Auxin, Control (n = 12), GSK3A (n = 14), WAPL (n = 12), GSK3A +WAPL (n = 14)] **** P-value < 0.0001, two-tailed t-test.
Extended Data Figure 8.
Extended Data Figure 8.. Additional data supporting role of GSK3A in regulating cohesin unloading through WAPL, Related to Figure 5.
a) Additional biological replicates of western blot of nucleoplasmic and chromatin-bound WAPL in control and GSK3A KD. Proteins labeled with HRP-linked antibodies. b) Additional biological replicates of co-immunoprecipitation of chromatin fractions in control and GSK3A KD with blotting of WAPL in SMC1A-IP. c) Quantification of WAPL normalized intensity in SMC1A-IP. *** P-value = 0.0007, two-tailed t-test. d) Additional biological replicate of GSK3A Turbo-ID. Western blots for cohesin components input lysate or lysate from with 24 hour biotin incubation with either control construct (V5-BirA) or GSK3A TurboID (GSK3A-V5-BirA). Proteins labeled with HRP-linked antibodies. e) Western blot of RAD21 in chromatin fractions of control and 72 hour NIPBL KD. Proteins are labeled with fluorescent antibodies. All bands from same blot, cropped for clarity. Two biological replicates represented. f) Quantification of western blot in Extended Data Figure 6e. Protein intensity was adjusted for background, normalized to H3 volume and then normalized to the control lane for two biological replicates shown. g) Representative 3D DNA FISH images of chr22 domains after 72 hour NIPBL KD, 24 hour 20 µM BRD0705 treatment, or both. Dotted white line indicates nuclear edge. Scale bar nucleus, 5 µm; Scale bar spots, 1 µm. h) Fold change in mean spatial overlap between chr22:D1-D2. * P-value < 0.05, **** P-value < 0.0001, two-tailed Mann-Whitney U-test. [Alleles for Control+DMSO (n = 732); Control+BRD0705 (n = 440); NIPBL+DMSO (n = 543); NIPBL+BRD0705 (n = 373)].
Figure 1:
Figure 1:. Development of HiDRO.
(a) Workflow for DNA HiDRO at two consecutive TADs (D1, D2) on chromosome 22:33.4–36.5Mb. Solid white line following segmentation indicates nuclear edge. Scale bar field, 10 µm; Scale bar nucleus, 5 µm; Scale bar spots, 1 µm. Far right graph: the efficiency of each chr22 spot is measured by the percentage of nuclei with one or more spots. Bars for spot efficiency are mean of six biological replicate wells +/- SD and each replicate well measured > 2,000 alleles. (b) HiDRO with siRNA perturbations at chr22 D1 & D2. Black wells are seeded with non-targeting control, red wells are seeded with NIPBL siRNA, and blue wells are seeded with WAPL siRNA. Structure measurements quantify inter-domain interactions including center-center distance (CCD) and spatial overlap normalized to area of either D1 or D2. Solid white line indicates nuclear edge. Scale bar nucleus, 5 µm; Scale bar spots, 1 µm. (c) Robust z-scores for D1-D2 center-center distance of control (n = 97 wells), NIPBL KD (n = 112 wells) and WAPL KD (n = 84 wells) across two biological replicates. (d) Spatial overlap (normalized to D1 area) z-scores shown for two biological replicates. (e) Cumulative frequency plot for spatial overlap from one well of DNA HiDRO data for each condition. X-axis is area of spatial overlap between D1 and D2 normalized to D1 area and Y-axis is fraction of alleles measured with that amount of overlap. [Alleles for Control (n = 1137); NIPBL (n = 3,775); WAPL (n = 2,648)]. **** P<0.0001, two-tailed Mann-Whitney U-test.
Figure 2:
Figure 2:. HiDRO identifies novel regulators of genome folding.
a) Workflow for primary HiDRO Screen of the human Druggable Genome siRNA library. b) Rank ordered robust z-scores for center-center distance (CCD) for all genes tested. Z-scores are average of two biological replicates. Dotted lines represent cutoffs of 1.5 (blue) or −1.5 (red). c) Rank ordered robust z-scores for normalized spatial overlap. Z-scores are average of two biological replicates. Cutoffs of 1.5 (blue) or −1.5 (red). d) Venn diagram of genes that alteredCCD or spatial overlap. n = 337. e) Protein classes of primary hits that altered both CCD and spatial overlap. n = 58. f) Phenotypic tree of 3,083 genes in primary screen scored across five measurement categories. Red = increase, blue = decrease, gray = no significant change. Change is z-score ≥ 1.5 or ≤ −1.5 across both replicates for any measurement in that category. g) Number of validation screen genes in that replicated overlap phenotype for individual siRNA duplexes.Blue genes decrease and red genes increase inter-TAD interactions. h) Heat map of image phenotypes for genes with ≥3 validated duplexes, rank-ordered by additive z-score (z-add = sum of CCD, D1 overlap, and D2 overlap z-scores). * = Top 10 rank ordered validated hit, seesee Fig. 2i. i) STRING network clusters of validated hits exhibiting connections with ≥2 validated genes. Green: Ubiquitin ligases and chromatin modifiers, Red: GSK3 signaling, Blue: calcium signaling. * = Top 10 rank ordered validated hit. j) Ideograms of Oligopaint probes to thirteen TAD and subTAD boundaries. k) Representative DNA HiDRO images of chr3 domains after RNAi KD of top druggable genome hits. Solid white line indicates nuclear edge. Scale bar nucleus, 5 µm; Scale bar spots, 1 µm. l) Number of boundaries with significantly altered CCD after KD of top hits. N = 13 boundaries.
Figure 3:
Figure 3:. GSK3A has noncanonical role in genome folding.
(a) Immunofluorescence (IF) of GSK3A and GSK3B after GSK3A KD. Dotted white line indicates nuclear edge determined by DAPI staining (not shown). Scale bar, 5 µm. (b) Validation of HiDRO by high-resolution 3D DNA FISH at chr22 domains. (c) Representative 3D DNA FISH images of chr22 domains after GSK3A and/or GSK3B KD. Dotted white line indicates nuclear edge. Scale bar nucleus, 5 µm; scale bar spots, 1 µm. (d) Fold change in mean spatial overlap versus control [Alleles for RNAi Control (n = 696); GSK3A (n = 461); GSK3B (n = 636); GSK3A+B (n = 596)]. ns P-value > 0.05, ** P-value < 0.01, two-tailed Mann-Whitney U-test. P-values vs Control: GSK3A = 0.0015, GSK3B = 0.7979, GSK3A+B = 0.0015; GSK3A vs GSK3A+B = 0.8901. (e) Reverse transcription quantitative real-time polymerase chain reaction (RT-qPCR) to WNT targets AXIN2 and LGR5 after GSK3A +/- GSK3B KD. Bar is mean of two biological replicates. Each biological replicate is average of three technical replicates. * P-value < 0.05, ** P-Value < 0.01, two-tailed t-test. P-values left to right: 0.0053, 0.0047, 0.0200, 0.0186, 0.0055, 0.0165. (f) DNA HiDRO testing varying concentrations of fiveGSK3i for 24 hours at chr22 domains. (g) Representative DNA HiDRO images of chr22 domains after 24 hour GSK3A inhibition by CHIR99021 (Data in Fig. 3h). Solid white line indicates nuclear edge. Scale bar nucleus, 5 µm; scale bar spots, 1 µm. (h) – (l) Difference in mean D1 overlap (Treatment – Control) +/- SEM for non-selective GSK3 inhibitors (CHIR99021, Lithium, LY2090314), GSK3A-selective inhibitor (BRD0705), and GSK3B-selective inhibitor (BRD3731). Four concentrations tested for 24 hours, five biological replicates perconcentration. * P-value < 0.05, ** P-Value < 0.01, two-tailed t-test. P-values left to right: CHIR99021 (0.0239); Lithium (0.0191, 0.0016); LY2090314 (0.0284, 0.0031, 0.0044); BRD0705 (0.0220).
Figure 4:
Figure 4:. GSK3A restricts chromatin looping to promote TAD insulation.
(a) Log2 of difference (GSK3A KD – control) in contact probability at 100 kb resolution as a function of genomic distance (log scale). Dotted line denotes 500 kb to show phenotypic switch between short-range and long-range interactions. (b) 3D pileup plots of Hi-C interactions in control and GSK3A KD at control TAD boundaries. Right-most is log2 fold change in interactions across TAD boundaries. (c) Insulation score pileup at control TAD boundaries in control, GSK3A KD, PDS5A KD and WAPL KD. (d) Hi-C contact matrices for control, GSK3A KD, and GSK3A – Control at chr7:81.5–85 Mbp. Looping interactions highlighted with black diamonds on contact map and arcs below contact map. For subtraction map, red loops are gained in GSK3A KD, and blue loops are lost. (e) Number of loops lost, retained, and gained in GSK3A KD, PDS5A KD and WAPL KD vs. Control. (f) Aggregate peak analysis for Hi-C signal in Control, GSK3A KD, PDS5A KD and WAPL KD at chromatin loops that are gained in GSK3A KD (n = 1,596) or lost in GSK3A KD (n = 6,010). (g) Violin plots of loop length in kb of different classes of loops. Solid line is median, dotted lines are 25th and 75th percentiles.** P-value < 0.01, **** P-value < 0.0001, two-tailed Mann-Whitney U-test. [Number of loops lost, gained, retained in Fig. 4e]. (h) 3D pileup plot of Control Hi-C, GSK3A KD Hi-C and log2 fold change of GSK3A/Control at architectural stripes detected in control sample.
Figure 5:
Figure 5:. GSK3A promotes WAPL recruitment to chromatin.
(a) Western blot of nucleoplasmic and chromatin-bound fractions of WAPL for control and GSK3A KD. WAPL and HDAC2 run on the same blot. Additional replicates in Extended Data Fig. 6. Quantification is chromatin-bound to nucleoplasmic ratio of WAPL, normalized to loading control (HDAC2). Bars are mean of three biological replicates for control and two biological replicates for GSK3A KD. ** P-value = 0.0058, two-tailed t-test. (b) Co-immunoprecipitation on chromatin fraction of control and GSK3A KD lysate. C = Control, G = GSK3A KD. Proteins labeled with HRP-linked antibodies. Biological replicates and quantification in Extended Data Fig. 8. (c) Western blots following Turbo-ID proximity labeling for cohesin components input lysate or lysate from biotin incubation with either a control construct (V5-BirA) or GSK3A-V5-BirA. Proteins labeled with HRP-linked antibodies. Biological replicate in Extended Data Fig. 8. (d) Model for three states of cohesin including (1) an actively extruding and NIPBL-bound complex, (2) a PDS5-bound looping complex paused at CTCF sites, and (3) a WAPL-bound complex unloading from chromatin. GSK3A facilitates the transition between the stable and unloading complexes. (e) Representative DNA HiDRO images at chr22:D1 & D2 of NIPBL KD and double KD NIPBL + GSK3A. Solid white line indicates nuclear edge. Scale bar nucleus, 5 µm; Scale bar spots, 1 µm. (f) Mean D1 overlap +/- SD at chr22 domains for Control, NIPBL and double KD of NIPBL and cohesin negative regulators. **** P-value < 0.0001, two-tailed t-test. [Biological replicate wells for control (n = 24); NIPBL (n = 12); PDS5A+NIPBL, WAPL+NIPBL, GSK3A+NIPBL (n=9)] (g) Loss of GSK3A activity leads to overactive cohesin phenotypes including accumulation of cohesin at CTCF sites, RAD21 aggregation on chromatin (vermicelli) and gain of long-range loops at the expense of short-range loops.

References

    1. Wutz G et al. Topologically associating domains and chromatin loops depend on cohesin and are regulated by CTCF, WAPL, and PDS5 proteins. EMBO J 36, 3573–3599 (2017). - PMC - PubMed
    1. Beagan JA & Phillips-Cremins JE On the existence and functionality of topologically associating domains. Nat. Genet 1–9 (2020) doi:10.1038/s41588-019-0561-1. - DOI - PMC - PubMed
    1. Davidson IF & Peters J-M Genome folding through loop extrusion by SMC complexes. Nat. Rev. Mol. Cell Biol 1–20 (2021) doi:10.1038/s41580-021-00349-7. - DOI - PubMed
    1. Rao SSP et al. Cohesin Loss Eliminates All Loop Domains. Cell 171, 305–320.e24 (2017). - PMC - PubMed
    1. Schwarzer W et al. Two independent modes of chromatin organization revealed by cohesin removal. Nature 551, 51–56 (2017). - PMC - PubMed

SUPPLEMENTARY REFERENCES

    1. Saito Y & Kanemaki MT Targeted Protein Depletion Using the Auxin-Inducible Degron 2 (AID2) System. Curr. Protoc 1, e219 (2021). - PubMed
    1. Beckwith KS et al. Visualization of loop extrusion by nanoscale 3D DNA tracing in single human cells. 2021.04.12.439407 Preprint at 10.1101/2021.04.12.439407 (2022). - DOI
    1. Shah PP et al. Pathogenic LMNA variants disrupt cardiac lamina-chromatin interactions and de-repress alternative fate genes. Cell Stem Cell 28, 938–954.e9 (2021). - PMC - PubMed
    1. Rhodes J, Mazza D, Nasmyth K & Uphoff S Scc2/Nipbl hops between chromosomal cohesin rings after loading. eLife 6, e30000 (2017). - PMC - PubMed
    1. Cho KF et al. Proximity labeling in mammalian cells with TurboID and split-TurboID. Nat. Protoc 15, 3971–3999 (2020). - PubMed

Publication types

MeSH terms