

Synthesis and preclinical evaluation of a novel fluorine-18 labeled small-molecule PET radiotracer for imaging of CXCR3 receptor in mouse models of atherosclerosis
- PMID: 37438543
- PMCID: PMC10338423
- DOI: 10.1186/s13550-023-01017-x
Synthesis and preclinical evaluation of a novel fluorine-18 labeled small-molecule PET radiotracer for imaging of CXCR3 receptor in mouse models of atherosclerosis
Abstract
Background: CXCR3 is a chemokine receptor and is expressed in innate and adaptive immune cells. It promotes the recruitment of T-lymphocytes and other immune cells to the inflammatory site in response to the binding of cognate chemokines. Upregulation of CXCR3 and its chemokines has been found during atherosclerotic lesion formation. Therefore, detection of CXCR3 by positron emission tomography (PET) radiotracer can be a useful tool for detecting the development of atherosclerosis in a noninvasive manner. Herein, we report the synthesis, radiosynthesis, and characterization of a novel fluorine-18 (F-18, 18F) labeled small-molecule radiotracer for the imaging of the CXCR3 receptor in mouse models of atherosclerosis.
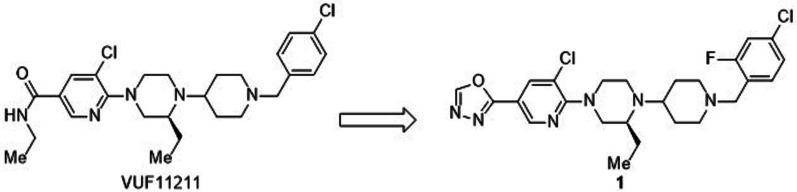
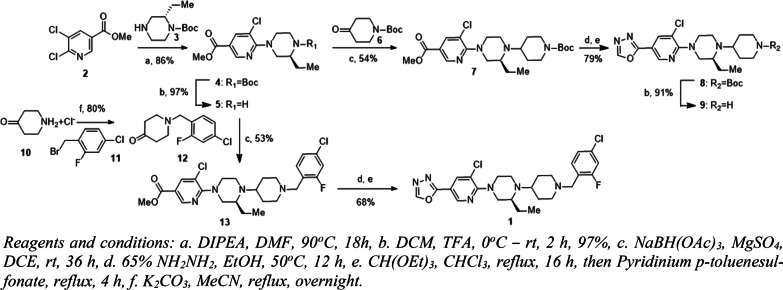
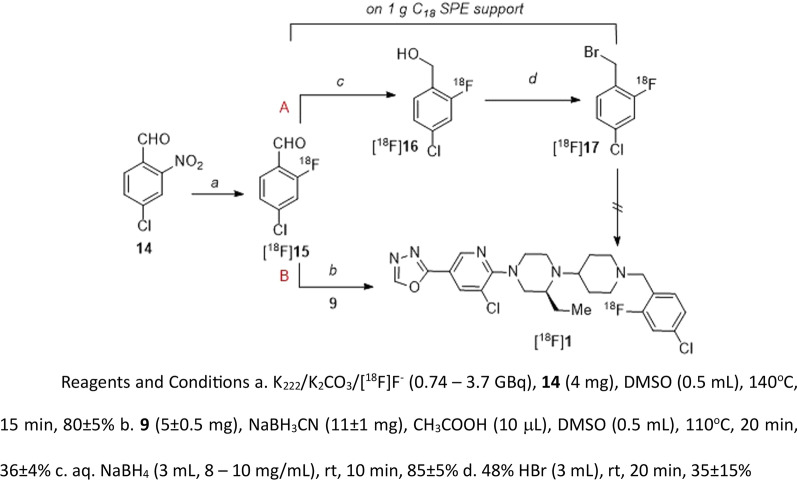
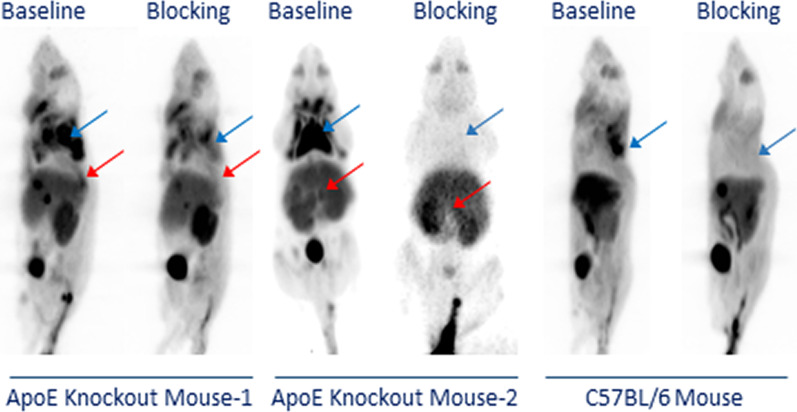
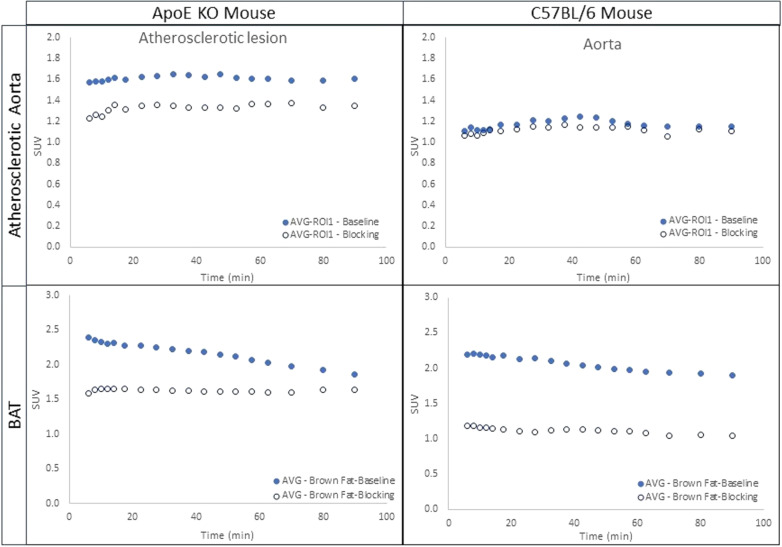
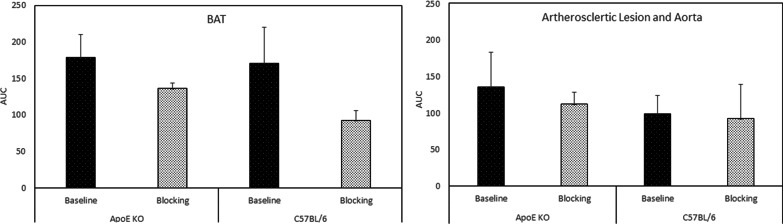
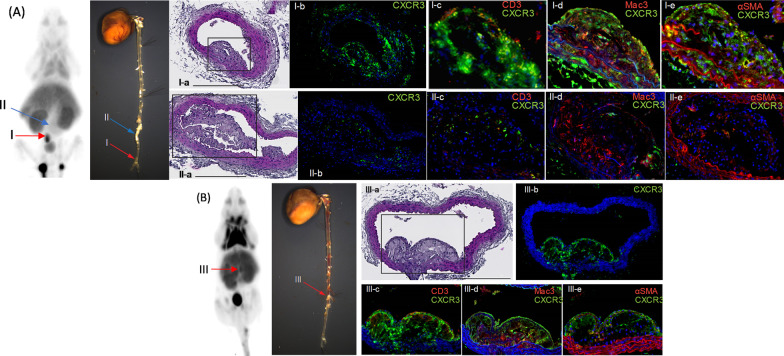
Results: The reference standard 1 and its precursor 9 were synthesized over 5 steps from starting materials in good to moderate yields. The measured Ki values of CXCR3A and CXCR3B were 0.81 ± 0.02 nM and 0.31 ± 0.02 nM, respectively. [18F]1 was prepared by a two-step radiosynthesis with a decay-corrected radiochemical yield of 13 ± 2%, radiochemical purity > 99%, and specific activity of 44.4 ± 3.7 GBq/µmol at the end of synthesis (n = 6). The baseline studies showed that [18F]1 displayed high uptake in the atherosclerotic aorta and brown adipose tissue in Apolipoprotein E (ApoE) knockout (KO) mice fed with a high-fat diet over 12 weeks. The uptake of [18F]1 in these regions was reduced significantly in self-blocking studies, demonstrating CXCR3 binding specificity. Contrary to this, no significant differences in uptake of [18F]1 in the abdominal aorta of C57BL/6 control mice fed with a normal diet were observed in both baseline and blocking studies, indicating increased CXCR3 expression in atherosclerotic lesions. Immunohistochemistry studies demonstrated that [18F]1-positive regions were correlated with CXCR3 expression, but some atherosclerotic plaques with significant size were not detected by [18F]1, and their CXCR3 expressions were minimal.
Conclusion: [18F]1 was synthesized with good radiochemical yield and high radiochemical purity. In PET imaging studies, [18F]1 displayed CXCR3-specific uptake in the atherosclerotic aorta in ApoE KO mice. [18F]1 visualized CXCR3 expression in different regions in mice aligned with the tissue histology studies. Taken together, [18F]1 is a potential PET radiotracer for imaging CXCR3 in atherosclerosis.
Keywords: Atherosclerosis; CXCR3 chemokine receptor; Inflammation; PET imaging; Small-molecule radiotracer.
© 2023. The Author(s).
Conflict of interest statement
The authors declare that they have no competing interests.
Figures
Update of
-
Synthesis and preclinical evaluation of a novel fluorine-18 labeled small-molecule PET radiotracer for imaging of CXCR3 receptor in mouse models of atherosclerosis.Res Sq [Preprint]. 2023 Feb 23:rs.3.rs-2539952. doi: 10.21203/rs.3.rs-2539952/v1. Res Sq. 2023. Update in: EJNMMI Res. 2023 Jul 13;13(1):67. doi: 10.1186/s13550-023-01017-x. PMID: 36865232 Free PMC article. Updated. Preprint.
Similar articles
-
Synthesis and preclinical evaluation of a novel fluorine-18 labeled small-molecule PET radiotracer for imaging of CXCR3 receptor in mouse models of atherosclerosis.Res Sq [Preprint]. 2023 Feb 23:rs.3.rs-2539952. doi: 10.21203/rs.3.rs-2539952/v1. Res Sq. 2023. Update in: EJNMMI Res. 2023 Jul 13;13(1):67. doi: 10.1186/s13550-023-01017-x. PMID: 36865232 Free PMC article. Updated. Preprint.
-
More advantages in detecting bone and soft tissue metastases from prostate cancer using 18F-PSMA PET/CT.Hell J Nucl Med. 2019 Jan-Apr;22(1):6-9. doi: 10.1967/s002449910952. Epub 2019 Mar 7. Hell J Nucl Med. 2019. PMID: 30843003
-
Differential influence of chemokine receptors CCR2 and CXCR3 in development of atherosclerosis in vivo.Circulation. 2005 Aug 9;112(6):870-8. doi: 10.1161/CIRCULATIONAHA.104.520718. Epub 2005 Aug 1. Circulation. 2005. PMID: 16061736
-
Targeting of vascular cell adhesion molecule-1 by 18F-labelled nanobodies for PET/CT imaging of inflamed atherosclerotic plaques.Eur Heart J Cardiovasc Imaging. 2016 Sep;17(9):1001-8. doi: 10.1093/ehjci/jev346. Epub 2016 Jan 22. Eur Heart J Cardiovasc Imaging. 2016. PMID: 26800768
-
Preclinical evaluation of an 18F-labeled Tenascin-C aptamer for PET imaging of atherosclerotic plaque in mouse models of atherosclerosis.Biochem Biophys Res Commun. 2024 Apr 9;703:149650. doi: 10.1016/j.bbrc.2024.149650. Epub 2024 Feb 7. Biochem Biophys Res Commun. 2024. PMID: 38377941
Cited by
-
Chemokine receptor PET imaging: Bridging molecular insights with clinical applications.Nucl Med Biol. 2024 Jul-Aug;134-135:108912. doi: 10.1016/j.nucmedbio.2024.108912. Epub 2024 Apr 18. Nucl Med Biol. 2024. PMID: 38691942 Free PMC article. Review.
-
Validation of the C-X-C chemokine receptor 3 (CXCR3) as a target for PET imaging of T cell activation.EJNMMI Res. 2024 Aug 28;14(1):77. doi: 10.1186/s13550-024-01142-1. EJNMMI Res. 2024. PMID: 39196448 Free PMC article.
-
Current status and future prospects of molecular imaging in targeting the tumor immune microenvironment.Front Immunol. 2025 Jan 22;16:1518555. doi: 10.3389/fimmu.2025.1518555. eCollection 2025. Front Immunol. 2025. PMID: 39911388 Free PMC article. Review.
References
Grants and funding
LinkOut - more resources
Full Text Sources
Research Materials
Miscellaneous
