. 2023 Jul 12;13(1):11.
doi: 10.1186/s13395-023-00321-3.

Age-related gene expression signatures from limb skeletal muscles and the diaphragm in mice and rats reveal common and species-specific changes

Affiliations

Age-related gene expression signatures from limb skeletal muscles and the diaphragm in mice and rats reveal common and species-specific changes

Tea Shavlakadze et al. Skelet Muscle. .

Abstract

Background: As a result of aging, skeletal muscle undergoes atrophy and a decrease in function. This age-related skeletal muscle weakness is known as "sarcopenia". Sarcopenia is part of the frailty observed in humans. In order to discover treatments for sarcopenia, it is necessary to determine appropriate preclinical models and the genes and signaling pathways that change with age in these models.

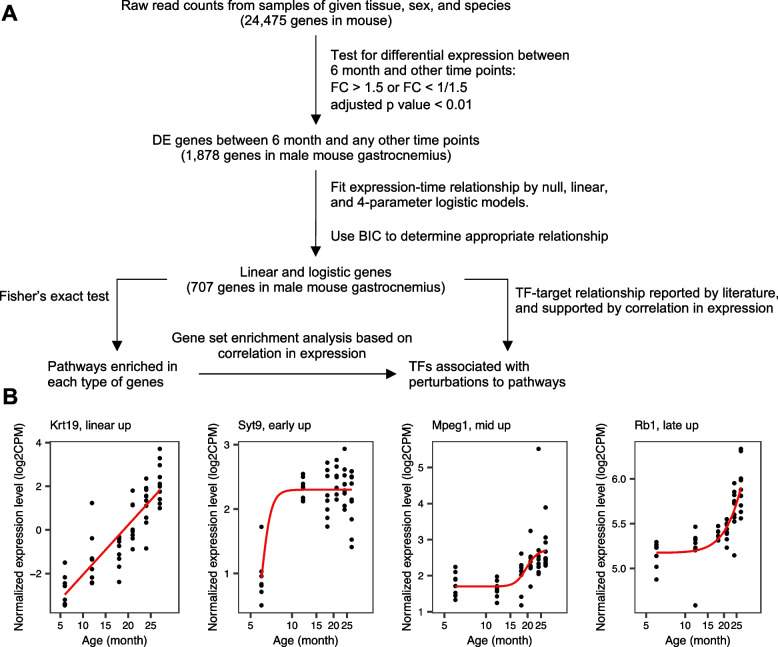
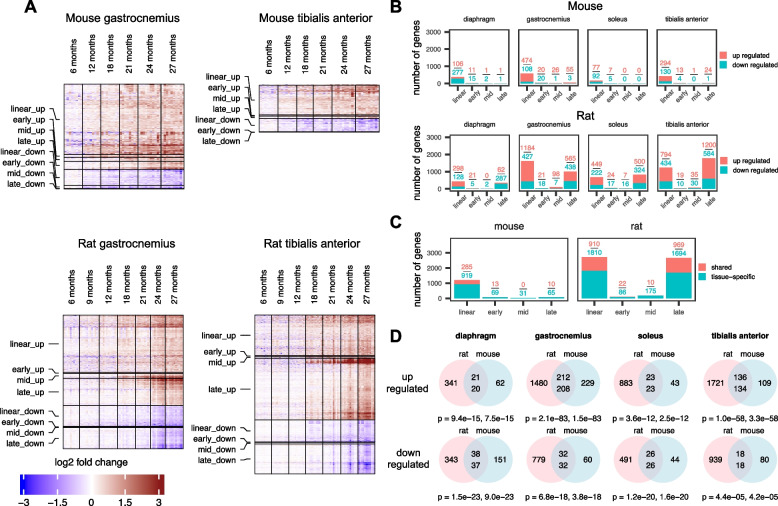
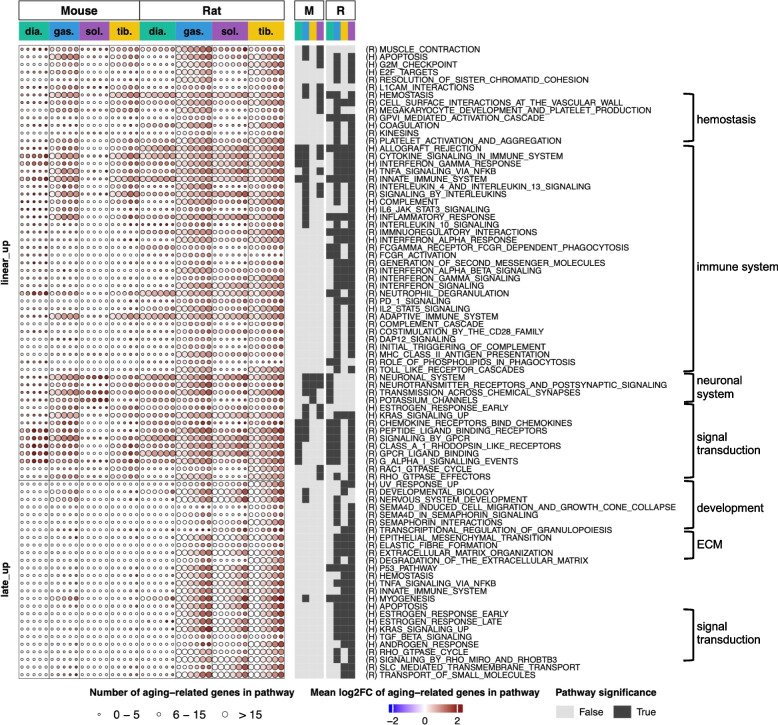
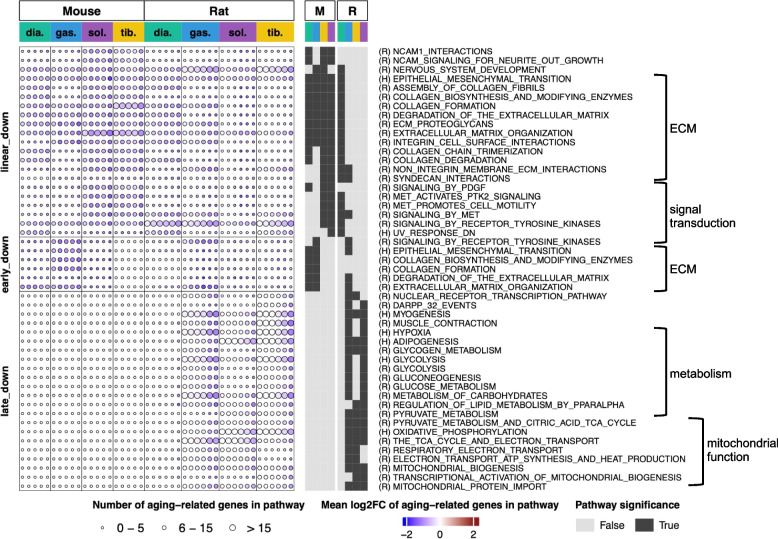
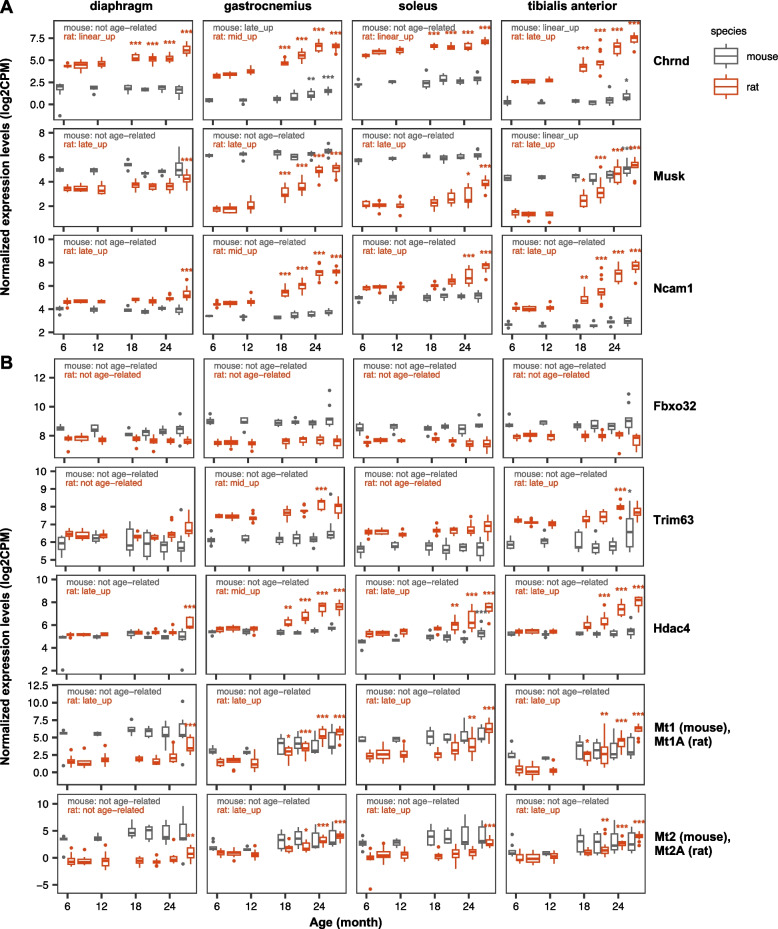
Methods and results: To understand the changes in gene expression that occur as a result of aging in skeletal muscles, we generated a multi-time-point gene expression signature throughout the lifespan of mice and rats, as these are the most commonly used species in preclinical research and intervention testing. Gastrocnemius, tibialis anterior, soleus, and diaphragm muscles from male and female C57Bl/6J mice and male Sprague Dawley rats were analyzed at ages 6, 12, 18, 21, 24, and 27 months, plus an additional 9-month group was used for rats. More age-related genes were identified in rat skeletal muscles compared with mice; this was consistent with the finding that rat muscles undergo more robust age-related decline in mass. In both species, pathways associated with innate immunity and inflammation linearly increased with age. Pathways linked with extracellular matrix remodeling were also universally downregulated. Interestingly, late downregulated pathways were exclusively found in the rat limb muscles and these were linked to metabolism and mitochondrial respiration; this was not seen in the mouse.

Conclusions: This extensive, side-by-side transcriptomic profiling shows that the skeletal muscle in rats is impacted more by aging compared with mice, and the pattern of decline in the rat may be more representative of the human. The observed changes point to potential therapeutic interventions to avoid age-related decline in skeletal muscle function.

Keywords: Aging; Aging gene signature; Frailty; Inflammation; Mitochondria; RNA-seq; Sarcopenia; Skeletal muscle atrophy.


Conflict of interest statement

All authors are employees of Regeneron. Many hold stock in Regeneron.

Figures

Fig. 1
Fig. 1
Summary of the analysis. A Flowchart for identifying age-related genes, pathway enrichment analysis, and transcription factor (TF) association analysis. RNA-seq data were processed from each species, sex, and tissue separately. The raw gene expression counts were normalized using the limma package, and the normalized data were used to first identify differentially expressed (DE) genes. Genes were considered differentially expressed if their expression was upregulated or downregulated by ≥ 1.5 fold at any age compared to 6 months, with the adjusted p value of > 0.05. To define age-related genes, we fitted the trend of a DE gene by null, linear, and a 4-parameter logistic model. Bayesian information content (BIC) was used to identify the best model among the three, and DE genes with a linear or a logistic trend were considered age-related. Next, age-related genes, with linear and logistic behaviors were used to perform pathway enrichment analyses and transcription factor (TF) motif enrichment. B Examples of age-related genes that follow a linear pattern, or early, mid-, or late-logistic patterns (shown for the mouse gastrocnemius)
Fig. 2
Fig. 2
More age-related genes were demonstrated in the skeletal muscle of rats compared with mice. A Heatmaps showing expression of age-related genes in the gastrocnemius and the tibialis anterior muscle in male mice and male rats across multiple ages (6–27 months). Gene expression fold change was calculated using the average normalized log2 CPM (counts per million) of samples at 6 months as reference. Red color represents increase in gene expression relative to 6 months, with the deepest red being an increase of ≥ eight fold. Blue color represents decrease in gene expression relative to 6 months, with the deepest blue being a decrease of ≥ eight fold. In heatmaps, each row represents a single gene, and each column represents a single animal. N = 6–8 mice and N = 9–13 rats per group respectively. B Numbers of linear and logistic age-related genes in diaphragm, gastrocnemius, soleus, and tibialis anterior muscles from male mice and rats. Red boxes represent number of upregulated genes, and green boxes represent number of downregulated genes. C Numbers of age-related genes whose expression changed in the same direction (up or down) and had the same classification (linear or logistic) in at least two muscles from the same species (mouse or rat). Red boxes represent upregulated genes and green boxes represent downregulated genes. D Venn diagrams showing age-related genes that were orthologous in the muscles of rats and mice. Pink circles are rat age-related genes that have a mouse ortholog, and blue circles are mouse age-related genes that have a rat ortholog. Top numbers in the intersections show the number of rat genes whose expression changes in the same direction as their respective mouse ortholog (significance shown by the first P value). Bottom numbers in the intersections show the number of mouse genes whose expression changes in the same direction as their respective rat ortholog (significance shown by the second P value). P values are derived by Fisher’s exact test (see the “Methods” section for details)
Fig. 3
Fig. 3
Graphic representation of pathways enriched by upregulated age-related genes in diaphragm, gastrocnemius, soleus, and tibialis anterior muscles from male mice and rats across multiple ages (from 6 to 27 months). Pathways enriched by linear-up and late-up genes in each muscle (from mice and rats, respectively) are depicted graphically as circles. Each column of circles, for each muscle, corresponds to the comparison between 6 month and the older age (12, 18, 21, 24, and 27 months for mice and 9, 12, 18, 21, 24, and 27 months for rats). The circle size represents the number of age-related genes enriched to each pathway: small circles denote enrichment of the pathway by 0–5 genes; medium circles, enrichment by 6–15 genes and large circles, enrichment by > 15 genes. The circle color indicates the average fold-change in the expression levels of these genes versus 6 months, with the deepest red being an increase of ≥ four fold. Dark squares on the right-hand side of the graphical heatmap indicate that enrichment for a specific pathway was statistically significant
Fig. 4
Fig. 4
Metabolism and mitochondrial functions are reduced in rat skeletal muscles, but not in mouse skeletal muscles. Graphic representation of pathways enriched by downregulated age-related genes in diaphragm, gastrocnemius, soleus, and tibialis anterior muscles from male mice and rats across multiple ages (from 6 to 27 months). Pathways enriched by linear-down, early-down and late-down genes in each muscle (from mice and rats respectively) are depicted graphically as circles. Each column of circles, for each muscle, corresponds to the comparison between 6 month and the older age (12, 18, 21, 24, and 27 months for mice and 9, 12, 18, 21, 24, and 27 months for rats). The circle size represents the number of age-related genes enriched to each pathway: small circles denote enrichment of the pathway by 0–5 genes; medium circles, enrichment by 6–15 genes and large circles, enrichment by > 15 genes. The circle color key indicates the average fold-change in the expression levels of these genes versus 6 months, with the deepest blue being a decrease of ≥ four fold. Dark squares on the right-hand side of the graphical heatmap indicate that enrichment for a specific pathway was statistically significant
Fig. 5
Fig. 5
Expression levels of selected genes in the muscles of male mice and rats. A Common marker genes of myofiber denervation. B Common marker gene of skeletal muscle atrophy. Boxplots show normalized expression levels of these genes from 6 to 27 months, with “outliers” marked as dots. Asterisks indicate significant difference compared to 6 months. Bonferroni adjusted p value * < 0.05, ** < 0.01, and *** < 0.001. See Table S2 for the exact fold changes and p values for these genes. Genes that are not differentially expressed at any age compared with 6 months or do not have linear or logistic trends are labeled as “not age-related”. For age-related genes, the behavior patterns are indicated: e.g., “late-up”

References

    1. Sayer AA, Dennison EM, Syddall HE, Gilbody HJ, Phillips DI, Cooper C. Type 2 diabetes, muscle strength, and impaired physical function: the tip of the iceberg? Diabetes Care. 2005;28(10):2541–2542. doi: 10.2337/diacare.28.10.2541. - DOI - PubMed
    1. Laskou F, Fuggle NR, Patel HP, Jameson K, Cooper C, Dennison E. Associations of osteoporosis and sarcopenia with frailty and multimorbidity among participants of the Hertfordshire Cohort Study. J Cachexia Sarcopenia Muscle. 2022;13(1):220–229. doi: 10.1002/jcsm.12870. - DOI - PMC - PubMed
    1. Xu J, Wan CS, Ktoris K, Reijnierse EM, Maier AB. Sarcopenia is associated with mortality in adults: a systematic review and meta-analysis. Gerontology. 2022;68(4):361–76. doi: 10.1159/000517099. - DOI - PubMed
    1. Rosmaninho I, Ribeirinho-Soares P, Nunes JPL. Walking speed and mortality: an updated systematic review. South Med J. 2021;114(11):697–702. doi: 10.14423/SMJ.0000000000001318. - DOI - PubMed
    1. Gil S, Jacob Filho W, Shinjo SK, Ferriolli E, Busse AL, Avelino-Silva TJ, et al. Muscle strength and muscle mass as predictors of hospital length of stay in patients with moderate to severe COVID-19: a prospective observational study. J Cachexia Sarcopenia Muscle. 2021;12(6):1871–1878. doi: 10.1002/jcsm.12789. - DOI - PMC - PubMed

Publication types