. 2023 Jul 12;42(1):165.
doi: 10.1186/s13046-023-02740-y.

Host obesity alters the ovarian tumor immune microenvironment and impacts response to standard of care chemotherapy

Affiliations

Host obesity alters the ovarian tumor immune microenvironment and impacts response to standard of care chemotherapy

Yueying Liu et al. J Exp Clin Cancer Res. .

Abstract

Background: The majority of women with epithelial ovarian cancer (OvCa) are diagnosed with metastatic disease, resulting in a poor 5-year survival of 31%. Obesity is a recognized non-infectious pandemic that increases OvCa incidence, enhances metastatic success and reduces survival. We have previously demonstrated a link between obesity and OvCa metastatic success in a diet-induced obesity mouse model wherein a significantly enhanced tumor burden was associated with a decreased M1/M2 tumor-associated macrophage ratio (Liu Y et al. Can, Res. 2015; 75:5046-57).

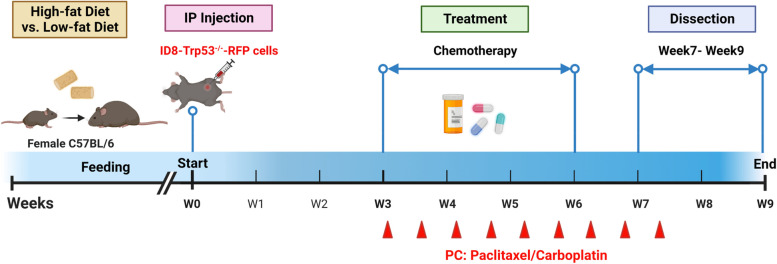
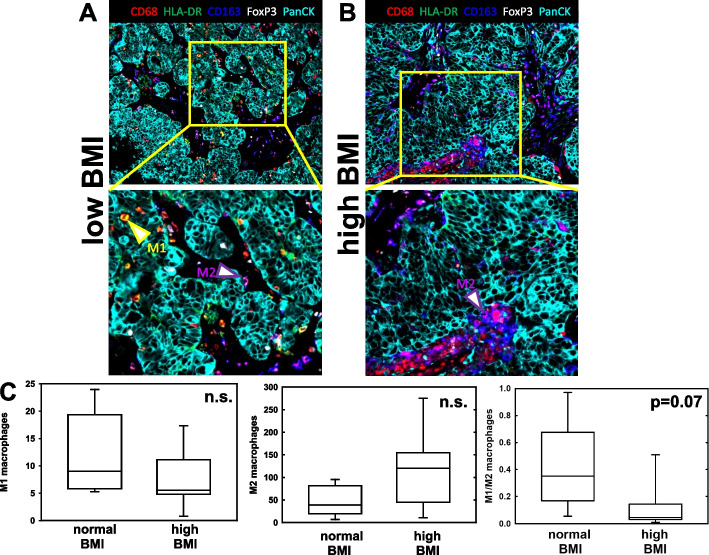
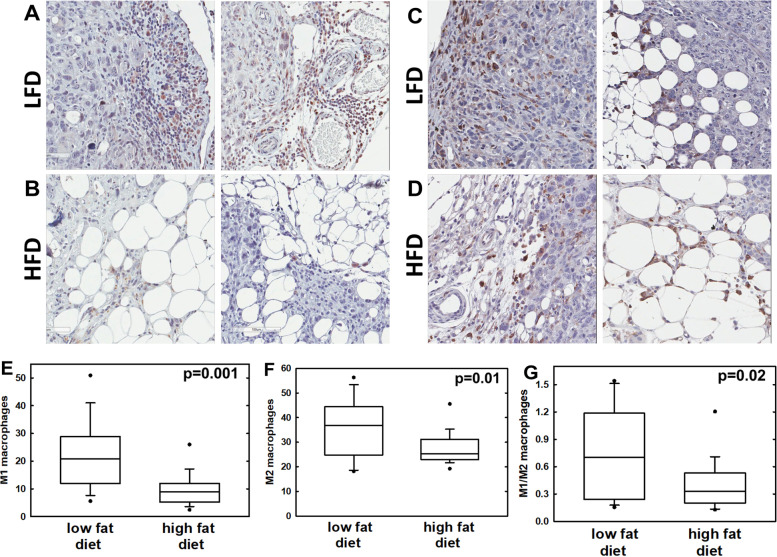
Methods: The objective of this study was to use pre-clinical murine models of diet-induced obesity to evaluate the effect of a high fat diet (HFD) on response to standard of care chemotherapy and to assess obesity-associated changes in the tumor microenvironment. Archived tumor tissues from ovarian cancer patients of defined body mass index (BMI) were also evaluated using multiplexed immunofluorescence analysis of immune markers.

Results: We observed a significantly diminished response to standard of care paclitaxel/carboplatin chemotherapy in HFD mice relative to low fat diet (LFD) controls. A corresponding decrease in the M1/M2 macrophage ratio and enhanced tumor fibrosis were observed both in murine DIO studies and in human tumors from women with BMI > 30.

Conclusions: Our data suggest that the reported negative impact of obesity on OvCa patient survival may be due in part to the effect of the altered M1/M2 tumor-associated macrophage ratio and enhanced fibrosis on chemosensitivity. These data demonstrate a contribution of host obesity to ovarian tumor progression and therapeutic response and support future combination strategies targeting macrophage polarization and/or fibrosis in the obese host.

Keywords: Fibrosis; High fat diet; Obesity; Ovarian cancer; Tumor-associated macrophage.


Conflict of interest statement

The authors declare that they have no competing interests.

Figures

Fig. 1
Fig. 1
Experimental overview. Female mice were fed a control low fat diet (LFD) or a high fat diet (HFD) until a ~ 10 g difference in weight was attained prior to injection with murine ovarian cancer cells (ID8-Trp53−/−, W0). After three weeks (W3), mice were injected with weight-adjusted standard of care chemotherapy (paclitaxel and cisplatin; PC) twice weekly for a total of 6 or 9 cycles as indicated (red arrowheads). Dissection and quantitation of tumor burden occurred one week following cessation of chemotherapy (W7 or W9). Figure created with Biorender.com
Fig. 2
Fig. 2
Analysis of residual tumor burden following chemotherapy. Mice on either control LFD (n = 11) or HFD (n = 10) were injected with 1 × 107 RFP-tagged ID8-Trp53−/− cells. After three weeks, mice were treated with 9 cycles of weight-adjusted paclitaxel (6 mg/kg) and carboplatin (15 mg/kg). One week following the last chemotherapy treatment, mice were sacrificed, the peritoneal cavity exposed with a midline incision, and RFP signal was imaged in situ using an Ivis Lumina to determine (A, B) total abdominal tumor burden. C, D Abdominal organs were then removed and imaged ex vivo to evaluate organ-specific tumor burden. Graphs show mean and standard error of the mean. Pairwise statistical analyses were conducted using Student’s t-test (Sigmaplot). n.s. = not significant (p > 0.05)
Fig. 3
Fig. 3
Evaluation of tumor-associated macrophage (TAM) staining in human ovarian tumors from patients with normal vs high body mass index (BMI). Tissues were stained using MultiOmyx technology as described. Regions of interest (12–28) were identified by a pathologist. M1 and M2 TAMS were quantified by applying the proprietary deep-learning based cell classification platform NeoLYTX to multiplexed images. A, B Representative color overlay images of tumors from patients with normal body mass index (BMI) and high BMI. Arrows indicate examples of M1 TAMs (yellow) and M2 TAMs (magenta). C Quantification of TAM staining data. Pairwise statistical analyses were conducted using Student’s t-test (Sigmaplot). n.s. = not significant (p > 0.05). Box and whisker plots show lower quartile, median, and upper quartile (box) and minimum/maximum values (whiskers)
Fig. 4
Fig. 4
Evaluation of TAM staining in murine tumors from low fat diet (LFD) and high fat diet (HFD) mice. A, B Sections were stained for M1 TAMs using anti-iNOS antibodies (1:1000 dilution) followed by peroxidase-conjugated secondary antibody and peroxidase detection. C, D Sections were stained for M2 TAMS using anti-CD206 antibodies (1:6400 dilution) followed by peroxidase-conjugated secondary antibody and peroxidase detection. EG Stained sections were quantified using an Aperio Scanscope and analyzed using ePathology ImageScope software percent positive macro algorithm to quantify the number of DAB chromogen positive (brown) cells. Two slides were scanned per tumor and a minimum of 10 regions of interest per slide were evaluated. Statistical analysis was completed using Student’s t-test (Sigmaplot). Box and whisker plots show lower quartile, median, and upper quartile (box) and minimum/maximum values (whiskers)
Fig. 5
Fig. 5
Tumor-associated fibrosis. A, B Hematoxylin and eosin (H&E) staining of human ovarian tumor tissues. Representative tissues from patients with (A) normal BMI (n = 6) or (B) high BMI (n = 7) were stained using H&E. Fibrotic tissue (pink) is more evident in the high BMI cohort. C, D Trichrome staining of tumors from LFD and HFD mice. Tumor sections from mice on (C) LFD (n = 11) or (D) HFD (n = 10) were stained using trichrome reagents according to the manufacturer’s specifications. Representative images are shown. Collagen staining (blue) is more evident in the HFD cohort. Scale bar 200 μm

References

    1. Huang J, Chang WC, Ngai CH, Lok V, Zhang L, Lucero-Prisno DE, et al. Worldwide burden, risk factors, and temporal trends of ovarian cancer: a global study. Cancers. 2022;14(9):2230. doi: 10.3390/cancers14092230. - DOI - PMC - PubMed
    1. Lengyel E. Ovarian cancer development and metastasis. Am J Path. 2010;177:1053–1064. doi: 10.2353/ajpath.2010.100105. - DOI - PMC - PubMed
    1. Lengyel E, Burdette JE, Kenny HA, Matei D, Pilrose J, Haluska P, et al. Epithelial ovarian cancer experimental models. Oncogene. 2014;33:3619–33. doi: 10.1038/onc.2013.321. - DOI - PMC - PubMed
    1. Klymenko Y, Kim O, Loughran E, Yang J, Lombard R, Alber M, Stack MS. Cadherin composition and multicellular aggregate invasion in organotypic models of epithelial ovarian cancer intraperitoneal metastasis. Oncogene. 2017;36:5840–5851. doi: 10.1038/onc.2017.171. - DOI - PMC - PubMed
    1. Davidowitz RA, Selfors LM, Iwanicki MP, Brugge J, et al. Mesenchymal gene program-expressing ovarian cancer spheroids exhibit enhanced mesothelial clearance. J Clin Invest. 2014;124(6):2611–2625. doi: 10.1172/JCI69815. - DOI - PMC - PubMed