. 2023 Jul 12;11(1):115.
doi: 10.1186/s40478-023-01614-w.

Bruton's tyrosine kinase inhibition reduces disease severity in a model of secondary progressive autoimmune demyelination

Affiliations

Bruton's tyrosine kinase inhibition reduces disease severity in a model of secondary progressive autoimmune demyelination

Kirsten Scarlett Evonuk et al. Acta Neuropathol Commun. .

Abstract

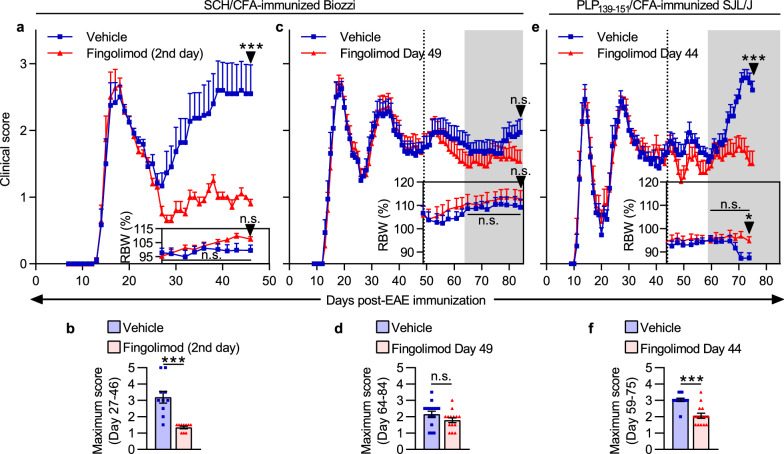
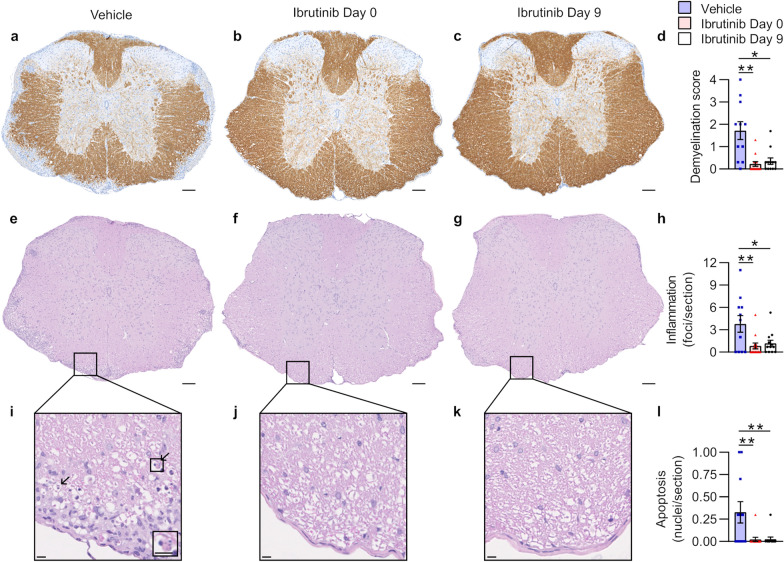
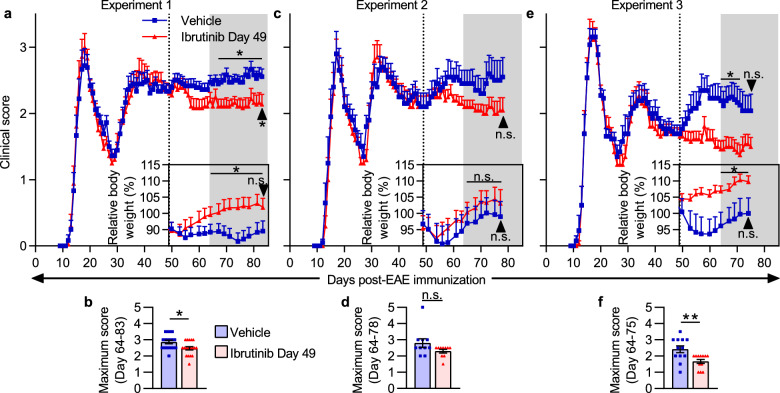
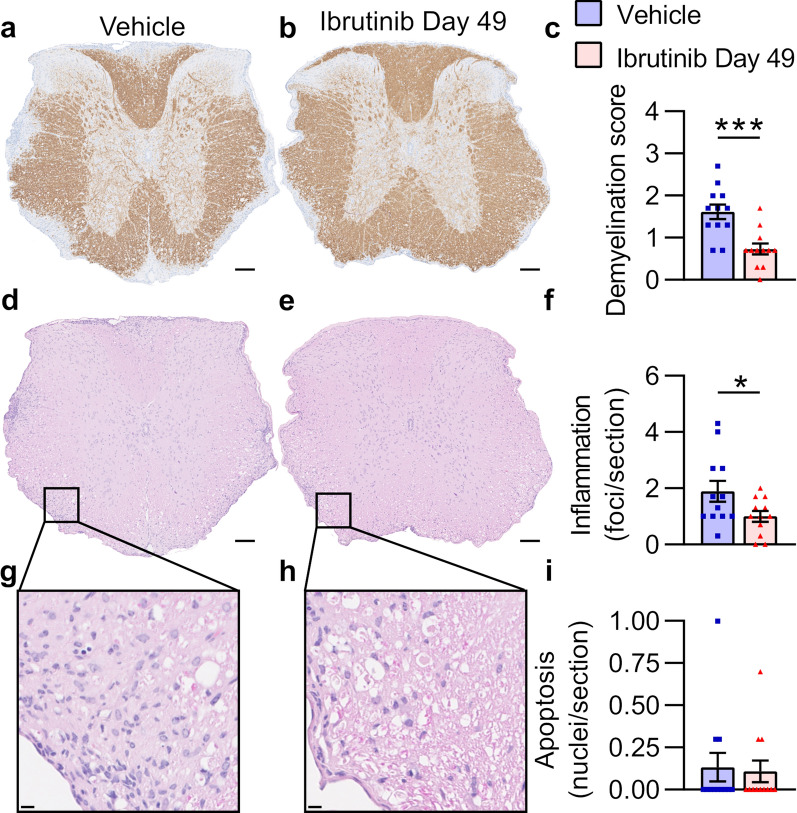
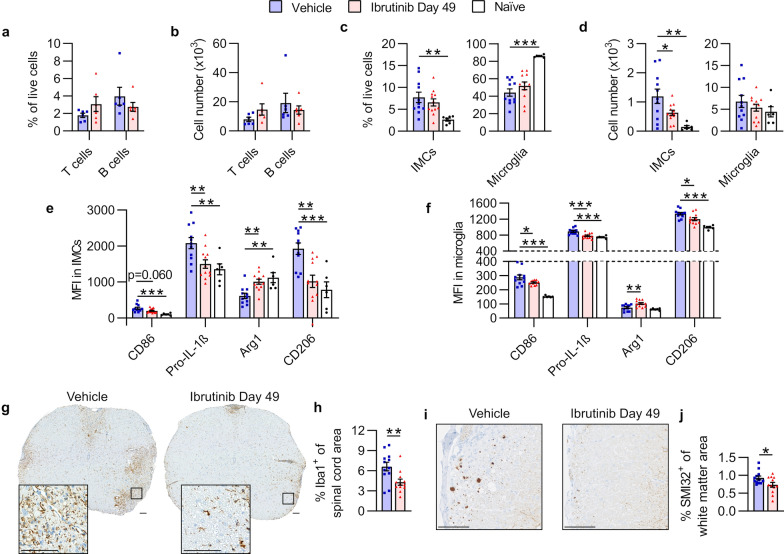
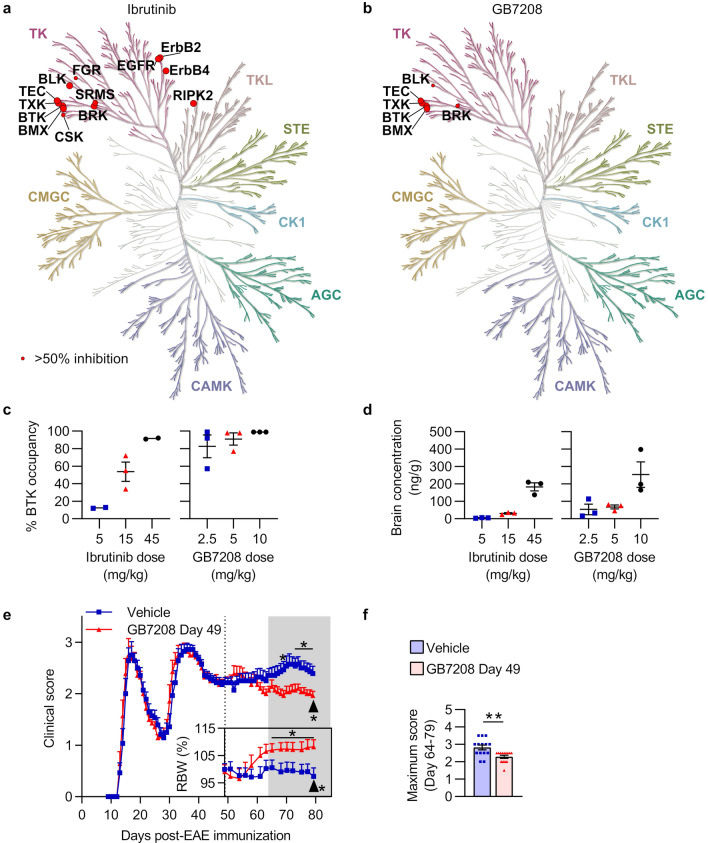
Bruton's tyrosine kinase (BTK) is an emerging target in multiple sclerosis (MS). Alongside its role in B cell receptor signaling and B cell development, BTK regulates myeloid cell activation and inflammatory responses. Here we demonstrate efficacy of BTK inhibition in a model of secondary progressive autoimmune demyelination in Biozzi mice with experimental autoimmune encephalomyelitis (EAE). We show that late in the course of disease, EAE severity could not be reduced with a potent relapse inhibitor, FTY720 (fingolimod), indicating that disease was relapse-independent. During this same phase of disease, treatment with a BTK inhibitor reduced both EAE severity and demyelination compared to vehicle treatment. Compared to vehicle treatment, late therapeutic BTK inhibition resulted in fewer spinal cord-infiltrating myeloid cells, with lower expression of CD86, pro-IL-1β, CD206, and Iba1, and higher expression of Arg1, in both tissue-resident and infiltrating myeloid cells, suggesting a less inflammatory myeloid cell milieu. These changes were accompanied by decreased spinal cord axonal damage. We show similar efficacy with two small molecule inhibitors, including a novel, highly selective, central nervous system-penetrant BTK inhibitor, GB7208. These results suggest that through lymphoid and myeloid cell regulation, BTK inhibition reduced neurodegeneration and disease progression during secondary progressive EAE.

Keywords: B cells; Demyelination; Experimental autoimmune encephalomyelitis; Microglia; Multiple sclerosis; Myeloid cells; Secondary progressive.


Conflict of interest statement

IY, WP, ZN, and LC are employees and stockholders of Gossamer Bio.

Figures

Fig. 1
Fig. 1
Fingolimod treatment ameliorates RREAE but not SPEAE. a Clinical scores, and percent body weights relative to Day -1 (relative body weight, RBW), of Biozzi mice during RREAE. Mice were treated beginning on the 2nd day of disease for each mouse (n = 11–12 mice/group) through Day 45. The study was terminated on Day 46 (arrows). RBW areas under the curves were compared during the relapse period (Day 27 through 46). c Clinical scores, and percent body weights relative to Day 0 of Biozzi mice during SPEAE. Mice were treated beginning on Day 49 (dotted line) through Day 83 (n = 15–16 mice/group). The study was terminated on Day 84 (arrows). The gray area represents the efficacy period of treatment (period starting 15 days after treatment onset, i.e., Day 64, through study termination), during which clinical scores and RBW areas under the curves were compared. e Clinical scores, and percent body weights relative to Day 0 of SJL/J mice during late RREAE. Mice were treated beginning on Day 44 (dotted line) through Day 74 (n = 15 mice/group). The study was terminated on Day 75 (arrows). The gray area represents the efficacy period of treatment (Day 59 through study termination), during which clinical scores and RBW areas under the curves were compared. b, d, f Maximum EAE scores during the relapse period (b) or efficacy period of treatment (d, f). Data in a, c, and e are shown as mean + SEM and data in b, d, and f are shown as mean ± SEM. Significance was tested using an unpaired two-tailed t test (RBW area under the curve and relative end body weight) or two-tailed Mann–Whitney test (end score and maximum score). Results in c and d are representative of two independent experiments. ***p < 0.001, *p < 0.05, n.s. = not significant
Fig. 2
Fig. 2
Prophylactic and semi-therapeutic ibrutinib treatment in Biozzi EAE ameliorate clinical symptoms, suppress relapses, and disrupt B cell maturation. Mice were treated daily through Day 35 with vehicle or ibrutinib beginning on Day 0, or ibrutinib beginning on Day 9. Mice treated with ibrutinib from Day 9 received vehicle from Day 0 through Day 8 to control for stress. Clinical EAE analyses (ac) were performed on n = 13 mice/group, and flow cytometric analyses (d–l) were performed on n = 7–8 representative mice/group from the same experiment. The figure legend in a applies to all graphs. a EAE clinical scores over time. Arrows indicate the final day of the study (Day 36). b Maximum EAE scores for the duration of the study. c Kaplan–Meier survival curves for day of relapse onset. d–l Spleens were collected and splenocyte suspensions generated on Day 36. d Representative dot plots of immature and mature B cells. e Proportions of B cells that were immature or mature. f Numbers of immature and mature B cells. g Representative dot plots with T1, T2, and T3 B cells. h Proportions of immature B cells that were T1, T2, or T3 B cells. i Numbers of T1, T2, and T3 B cells. j Representative dot plots with marginal zone (MZ) and follicular (FO) B cells. k Proportions of mature B cells that were MZ or FO B cells. l Numbers of MZ and FO B cells. Except in a showing mean + SEM and c showing total percentage per group over time, data are shown as mean ± SEM. Significance was tested using a Kruskal–Wallis test followed by Dunn’s multiple comparisons test (end score and maximum score), Gehan–Breslow–Wilcoxon tests with pvalues adjusted for multiplicity using the Holm-Sidak approach (time to relapse onset), or one-way ANOVA followed by Dunnett’s multiple comparisons test (flow cytometric analyses). Asterisks denote results of multiple comparisons tests. *p < 0.050, **p < 0.010, ***p < 0.001
Fig. 3
Fig. 3
Prophylactic and semi-therapeutic ibrutinib treatment in Biozzi EAE reduce spinal cord demyelination, inflammation, and white matter cell apoptosis. Analyses were performed on all surviving mice (n = 11–13 mice/group) from the experiment shown in Fig. 2a. The figure legend in d applies to all graphs. a-c Illustrative thoracic spinal cord sections stained with anti-MBP antibody (brown) and hematoxylin (nuclei; blue). Adjustments to gamma were made evenly across these images to better visualize staining. Scale bars, 100 µm. d Mean demyelination scores per section, per mouse. e–g Illustrative thoracic spinal cord sections stained with hematoxylin (nuclei; blue) and eosin (cytoplasm; pink). Scale bars, 100 µm. h Mean inflammation quantified as number of 20+ cell foci per section, per mouse. i–k Magnified white matter regions from e–g demonstrating inflammatory infiltrates. Arrows in i identify apoptotic nuclei, with magnified inset demonstrating an apoptotic nucleus with karyorrhexis. Scale bars, 10 µm. l Mean numbers of apoptotic nuclei quantified per section, per mouse. Data in d, h, and l were obtained by taking the mean value of 3 spinal cord regions (cervical, thoracic, and lumbar) from 1 slide per stain, per mouse. Graphed data are shown as mean ± SEM. Significance was tested using a Kruskal–Wallis test followed by Dunn’s multiple comparisons test (d) or one-way ANOVA followed by Dunnett’s multiple comparisons test (h, l). Asterisks denote results of multiple comparisons tests. *p < 0.050, **p < 0.010
Fig. 4
Fig. 4
Late therapeutic ibrutinib treatment ameliorates clinical severity of EAE in Biozzi mice. a–f SCH/CFA-immunized Biozzi mice were treated with vehicle or ibrutinib daily from Day 49 (dotted lines in a, c, and e) through the day before study termination. Arrows indicate the final day of each experiment (Day 83, Day 78, or Day 75, respectively). Experiment 1 had n = 18 mice/group, Experiment 2 had n = 10 mice/group, and Experiment 3 had n = 13 mice/group. a, c, e Clinical scores, and percent body weights relative to Day-1 (a) or Day 0 (c, e). Gray areas represent the efficacy period of treatment (period starting 15 days after treatment onset, i.e., Day 64, through study termination), during which clinical scores and relative body weight areas under the curves were compared. b, d, f Maximum EAE scores during the efficacy period of treatment. Data in a, c, and e are shown as mean + SEM and data in b, d, and f are shown as mean ± SEM. Significance was tested using an unpaired two-tailed t test (relative body weight area under the curve and relative end body weight), two-tailed Mann–Whitney test (end score and maximum score), or two-tailed Mann–Whitney test followed by the Benjamini and Hochberg procedure (clinical scores on individual days, false discovery rate (FDR) = 5%, bars and asterisks above clinical score graphs indicate FDR-adjusted significance level of individual days). *p < 0.050, **p < 0.010, ***p < 0.001, n.s. = not significant
Fig. 5
Fig. 5
Late therapeutic ibrutinib treatment in Biozzi EAE reduces spinal cord demyelination and inflammation. Analyses were performed on n = 12 representative mice/group from the experiment shown in Fig. 4a. The figure legend in c applies to all graphs. a, b Illustrative thoracic spinal cord sections stained with anti-MBP antibody (brown) and hematoxylin (nuclei; blue). Scale bars, 100 µm. c Mean demyelination scores per section, per mouse. d, e Illustrative thoracic spinal cord sections stained with hematoxylin (nuclei; blue) and eosin (cytoplasm; pink). Scale bars, 100 µm. f Mean inflammation quantified as number of 20+ cell foci per section, per mouse. g, h Magnified white matter regions from d and e demonstrating inflammatory infiltrates. No apoptotic nuclei with karyorrhexis were identified (for an example of an apoptotic nucleus, see Fig. 3i). Scale bars, 10 µm. i Mean numbers of apoptotic nuclei quantified per section, per mouse. Data in c, f, and i were obtained by taking the mean value of 3 spinal cord regions (cervical, thoracic, and lumbar) from 1 slide per stain, per mouse. Graphed data are shown as mean ± SEM. Significance was tested using a two-tailed Mann–Whitney test (c) or unpaired two-tailed t test (f, i). *p < 0.050, ***p < 0.001
Fig. 6
Fig. 6
Ibrutinib treatment in Biozzi mice reduces CNS-infiltrating myeloid cell numbers and alters myeloid cell expression of activation markers. a, b Analyses were performed on n = 6 representative mice/group from the experiment shown in Fig. 4a. a Proportions of CNS-infiltrating lymphocytes that were CD4 T or B cells. b Numbers of CNS-infiltrating CD4 T or B cells. c-f Analyses were performed simultaneously on n = 6 age-matched naïve mice and n = 11–12 (all surviving) mice/group from the experiment shown in Fig. 4e. c Proportions of live cells in spinal cords that were IMCs or microglia. d Numbers of spinal cord IMCs or microglia. e, f Median fluorescence intensity (MFI) of activation markers in spinal cord IMCs or microglia. g-j Analyses were performed on n = 12 representative mice/group from the experiment shown in Fig. 4a. g Illustrative cervical spinal cord sections stained with anti-Iba1 antibody (brown) and hematoxylin (nuclei; blue). Magnified insets demonstrate Iba1+ areas in white matter. Scale bars, 100 µm. h Mean proportions of Iba1+ areas in whole spinal cord sections per mouse. i Illustrative cervical spinal cord white matter stained with anti-SMI32 antibody (brown) and hematoxylin (nuclei; blue). Both images are from the same white matter area (ventrolateral). Scale bars, 100 µm. j Mean proportions of SMI32+ areas in spinal cord white matter per mouse. Adjustments to input levels were made evenly across images in g, and evenly across images in i, to better visualize staining. Data in h and j were obtained by taking the mean value of 3 spinal cord Sects. (1 each of cervical, thoracic, and lumbar regions) per stain, per mouse. Graphed data are shown as mean ± SEM. Significance was tested using an unpaired two-tailed t test (a, b, h, and j) or one-way ANOVA followed by Dunnett's multiple comparisons test (c–f). *p < 0.050, **p < 0.010, ***p < 0.001
Fig. 7
Fig. 7
Novel BTK inhibitor GB7208 demonstrates greater selectivity and CNS target occupancy than ibrutinib and ameliorates SPEAE in Biozzi mice. a, b Kinases in a 357-kinase assay inhibited greater than 50% at 1 µM concentrations of ibrutinib (a) or GB7208 (b) with 1 mM ATP. Larger red circles indicate greater inhibition. Kinome trees were generated using KinMap [11], and tree illustrations were reproduced courtesy of Cell Signaling Technology, Inc. (www.cellsignal.com). c-d Target occupancy (c) and BTK inhibitor concentration (d) in brains from n = 2–3 naïve C57BL/6J mice/group dosed orally, daily, for a total of 3 days with either ibrutinib or GB7208. Tissue was collected 1 h after the final dose. Error bars are not shown for groups with n = 2 (5 and 45 mg/kg ibrutinib groups for % BTK occupancy). Data for ibrutinib and GB7208 are from separate experiments. e, f SCH/CFA-immunized Biozzi mice were treated with vehicle or 5 mg/kg GB7208 (n = 14 mice/group) daily from Day 49 (dotted line in e) through Day 79. Arrows indicate the final day of the study (Day 79). e Clinical scores, and percent body weights relative to Day 0 (relative body weight, RBW). Gray area represents the efficacy period of treatment (period starting 15 days after treatment onset, i.e., Day 64, through study termination), during which clinical scores and RBW areas under the curves were compared. f Maximum EAE scores during the efficacy period of treatment. Data in e are shown as mean + SEM, and data in c, d, and f are shown as mean ± SEM. Significance was tested using an unpaired two-tailed t test (RBW area under the curve and relative end body weight), two-tailed Mann–Whitney test (end score and maximum score), or two-tailed Mann–Whitney test followed by the Benjamini and Hochberg procedure (clinical scores on individual days, false discovery rate (FDR) = 5%, bars and asterisks above clinical score graph indicate FDR-adjusted significance level of individual days). *p < 0.050, **p < 0.010

References

    1. Al-Izki S, Pryce G, Jackson SJ, Giovannoni G, Baker D. Immunosuppression with FTY720 is insufficient to prevent secondary progressive neurodegeneration in experimental autoimmune encephalomyelitis. Mult Scler. 2011;17:939–948. doi: 10.1177/1352458511400476. - DOI - PubMed
    1. Baker D, O’Neill JK, Gschmeissner SE, Wilcox CE, Butter C, Turk JL. Induction of chronic relapsing experimental allergic encephalomyelitis in Biozzi mice. J Neuroimmunol. 1990;28:261–270. doi: 10.1016/0165-5728(90)90019-j. - DOI - PubMed
    1. Bhargava P, Kim S, Reyes AA, Grenningloh R, Boschert U, Absinta M, et al. Imaging meningeal inflammation in CNS autoimmunity identifies a therapeutic role for BTK inhibition. Brain. 2021;144:1396–1408. doi: 10.1093/brain/awab045. - DOI - PMC - PubMed
    1. Bjartmar C, Kidd G, Mörk S, Rudick R, Trapp BD. Neurological disability correlates with spinal cord axonal loss and reduced N-acetyl aspartate in chronic multiple sclerosis patients. Ann Neurol. 2000;48:893–901. doi: 10.1002/1531-8249(200012)48:6<893::AID-ANA10>3.0.CO;2-B. - DOI - PubMed
    1. Centonze D, Muzio L, Rossi S, Cavasinni F, De Chiara V, Bergami A, et al. Inflammation triggers synaptic alteration and degeneration in experimental autoimmune encephalomyelitis. J Neurosci. 2009;29:3442–3452. doi: 10.1523/JNEUROSCI.5804-08.2009. - DOI - PMC - PubMed

Publication types

MeSH terms

Substances