. 2023 Jul 12;24(1):165.
doi: 10.1186/s13059-023-03003-x.

SEESAW: detecting isoform-level allelic imbalance accounting for inferential uncertainty

Affiliations

SEESAW: detecting isoform-level allelic imbalance accounting for inferential uncertainty

Euphy Y Wu et al. Genome Biol. .

Abstract

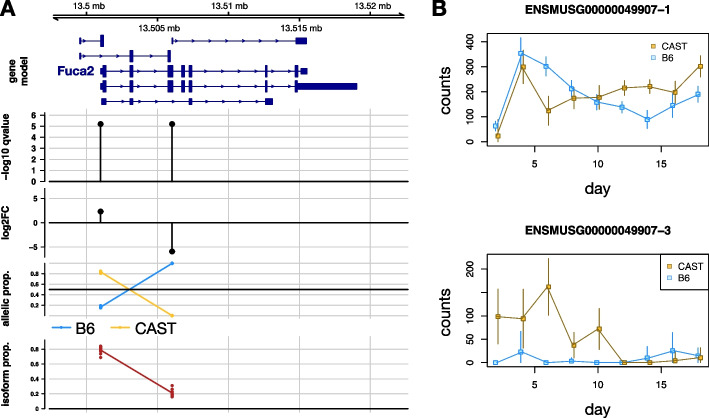
Detecting allelic imbalance at the isoform level requires accounting for inferential uncertainty, caused by multi-mapping of RNA-seq reads. Our proposed method, SEESAW, uses Salmon and Swish to offer analysis at various levels of resolution, including gene, isoform, and aggregating isoforms to groups by transcription start site. The aggregation strategies strengthen the signal for transcripts with high uncertainty. The SEESAW suite of methods is shown to have higher power than other allelic imbalance methods when there is isoform-level allelic imbalance. We also introduce a new test for detecting imbalance that varies across a covariate, such as time.


Conflict of interest statement

R.P. is a co-founder of Ocean Genomics Inc.

Figures

Fig. 1
Fig. 1
SEESAW is a suite of tools for analysis of allelic imbalance across samples, first performing quantification and then statistical inference. A Salmon is used to quantify single-end (SE) or paired-end (PE) reads over a diploid transcriptome, and then estimates may be aggregated to various levels of resolution: isoform, TSS, or gene level. Different types of reads provide different types of information: PE1 contains both allelic and isoform-level information, PE2 contains only isoform-level information, and PE3 contains only allelic information. Information from all of these types of read data is included in quantification with Salmon. B Swish is then used to perform statistical testing of allelic imbalance across samples, taking into account multiple inferential replicates per sample (shown as boxes). Swish can test for global allelic imbalance, or differential or dynamic imbalance with respect to categorical or continuous covariates, respectively
Fig. 2
Fig. 2
Comparing results of SEESAW on polyester simulation with different levels of aggregation to mmdiff and WASP. SEESAW was applied at different levels of resolution including transcript (txp), aggregated-to-TSS (TSS), aggregated-to-gene (gene), and “oracle”, where oracle involved aggregating transcripts by the true AI signal direction, known only in simulation. mmdiff was applied at transcript (mmdiff) and gene level (mmdiff_gene), while WASP provided gene level analysis. A iCOBRA plot of sensitivity (true positive rate, or TPR) over achieved false discovery rate (FDR) with three circles indicating 1%, 5%, and 10% nominal FDR cutoffs, respectively. Filled circles indicate observed FDR less than nominal FDR. B Overall sensitivity for all cases of AI and sensitivity stratified by type of AI: “discordant” AI across isoforms within a gene (AI in different directions) or “concordant” AI within gene (AI in the same direction)
Fig. 3
Fig. 3
SEESAW results for the mouse osteoblast differentiation dataset (TSS-level analysis). A Global AI results for the gene Fuca2 where TSS groups showed discordant direction of imbalance. The computed statistics are plotted directly below the TSS group. B6 refers to the strain of C57BL/6J and CAST refers to the strain of CAST/EiJ, each parents in the F1 cross. Isoform proportion per TSS group was calculated by summing the estimated TPM (transcript per million) of the isoforms in the group and dividing by the gene-level TPM. Allelic proportion was calculated by dividing estimated allelic counts for each strain by the total counts from both alleles. B Dynamic AI revealed for two TSS groups of Rasl11b. Estimation uncertainty shown with error bars (95% intervals based on bootstrap variance)
Fig. 4
Fig. 4
Sparc gene results for osteoblast differentiation dataset (TSS-level global AI analysis). A Four transcript groups remained after TSS aggregation and count filtering. One group had positive allelic log fold change (LFC), with CAST expression higher than B6, and the other three groups had negative allelic LFC. B) The 5′ end of the Sparc transcripts in group 5 with positive allelic LFC, ENSMUST00000213866 and ENSMUST00000216313. C Allelic counts for two discordant transcript groups of Sparc. Estimation uncertainty shown with error bars (95% intervals based on bootstrap variance)

References

    1. Loos RJF. 15 years of genome-wide association studies and no signs of slowing down. Nat Commun. 2020;11(1):5900. doi: 10.1038/s41467-020-19653-5. - DOI - PMC - PubMed
    1. Wittkopp PJ, Haerum BK, Clark AG. Evolutionary changes in cis and trans gene regulation. Nature. 2004;430(6995):85–88. doi: 10.1038/nature02698. - DOI - PubMed
    1. Fogarty MP, Xiao R, Prokunina-Olsson L, Scott LJ, Mohlke KL. Allelic expression imbalance at high-density lipoprotein cholesterol locus MMAB-MVK. Hum Mol Genet. 2010;19(10):1921–1929. doi: 10.1093/hmg/ddq067. - DOI - PMC - PubMed
    1. Xiao R, Scott LJ. Detection of cis-acting regulatory SNPs using allelic expression data. Genet Epidemiol. 2011;35(6):515–525. doi: 10.1002/gepi.20601. - DOI - PMC - PubMed
    1. Sun W. A statistical framework for eQTL mapping using RNA-seq data. Biometrics. 2012;68(1):1–11. doi: 10.1111/j.1541-0420.2011.01654.x. - DOI - PMC - PubMed

Publication types

Substances

LinkOut - more resources