. 2023 Aug 31;46(8):486-495.
doi: 10.14348/molcells.2023.0019. Epub 2023 Jul 13.

Lipofuscin Granule Accumulation Requires Autophagy Activation

Affiliations

Lipofuscin Granule Accumulation Requires Autophagy Activation

Seon Beom Song et al. Mol Cells. .

Abstract

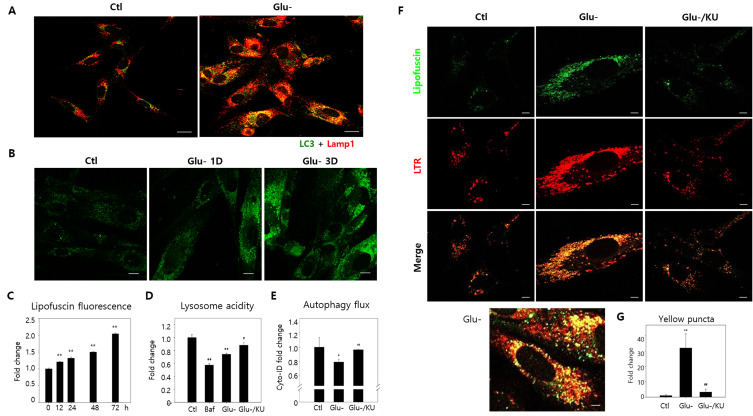
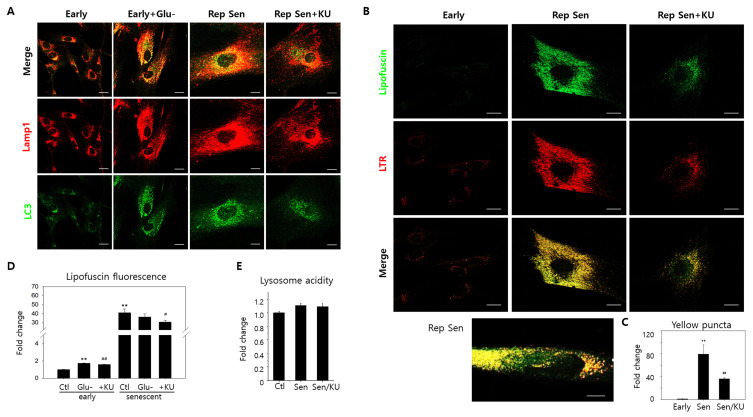
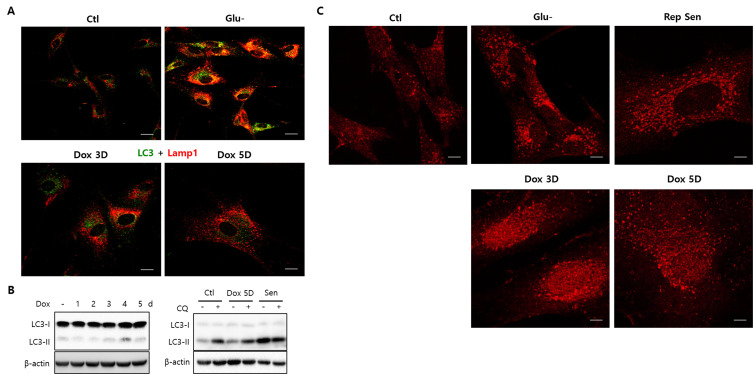
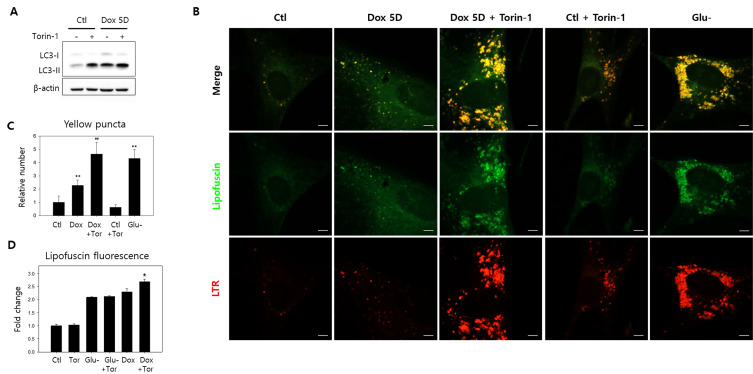
Lipofuscins are oxidized lipid and protein complexes that accumulate during cellular senescence and tissue aging, regarded as markers for cellular oxidative damage, tissue aging, and certain aging-associated diseases. Therefore, understanding their cellular biological properties is crucial for effective treatment development. Through traditional microscopy, lipofuscins are readily observed as fluorescent granules thought to accumulate in lysosomes. However, lipofuscin granule formation and accumulation in senescent cells are poorly understood. Thus, this study examined lipofuscin accumulation in human fibroblasts exposed to various stressors. Our results substantiate that in glucose-starved or replicative senescence cells, where elevated oxidative stress levels activate autophagy, lipofuscins predominately appear as granules that co-localize with autolysosomes due to lysosomal acidity or impairment. Meanwhile, autophagosome formation is attenuated in cells experiencing oxidative stress induced by a doxorubicin pulse and chase, and lipofuscin fluorescence granules seldom manifest in the cytoplasm. As Torin-1 treatment activates autophagy, granular lipofuscins intensify and dominate, indicating that autophagy activation triggers their accumulation. Our results suggest that high oxidative stress activates autophagy but fails in lipofuscin removal, leaving an abundance of lipofuscin-filled impaired autolysosomes, referred to as residual bodies. Therefore, future endeavors in treating lipofuscin pathology-associated diseases and dysfunctions through autophagy activation demand meticulous consideration.

Keywords: autolysosome; autophagy; cellular senescence; lipofuscin; lipofuscin granule.


Conflict of interest statement

CONFLICT OF INTEREST

The authors have no potential conflicts of interest to disclose.

Figures

Fig. 1
Fig. 1. Lipofuscin granule accumulation co-localized with autolysosomes in glucose-starved cells.
(A) After a three-day incubation in normal (Ctl) or glucose-free (Glu-) mediums, human fibroblast immunofluorescence was measured with LC3 and Lamp1 antibodies to visualize autophagosomes (green) and lysosomes (red). Yellow puncta, representing autolysosomes, increased substantially in glucose-starved cells. (B) Confocal microscopy examined the autofluorescence of cells incubated in normal or glucose-free mediums for one (Glu-1D) or three days (Glu-3D). Granular fluorescence quantities and intensities during glucose starvation increased on Day 1, escalating further by Day 3. (C) Flow cytometry comprised 10,000 cells collected from specified times at 530 nm to determine cellular autofluorescence. Normalized data obtained through three biological repeats with the control (0 h) were plotted in the bar graph, illustrating cellular lipofuscin fluorescence differences. (D) Lysosensor yellow/blue DND-160 dye stained glucose-starved cells with or without KU60019 (Glu-/KU) for three days. After washing in phosphate-buffered saline, cells were examined through fluorometry, and relative yellow/blue fluorescence ratios determined lysosome acidity. Cells treated with 200 nM bafilomycin A1 (baf) for 1 h served as the negative control. (E) Cells were treated with 10 μM chloroquine (CQ) 24 h before collection for relative autophagy flow comparisons between glucose-starved cells with or without 0.5 μM KU60019 over three days. Cyto-ID dye stained 10,000 cells, and flow cytometry quantitated cellular fluorescence. Relative fluorescence ratios were plotted from CQ-treated and untreated cells (two biological repeats). (F and G) Lipofuscin (green) and LysoTrackRed (LTR)-stained (red) lysosome autofluorescence were visualized through confocal microscopy. Green puncta primarily overlapped with red in three-day glucose-starved cells (Glu-). The bottom panel conveys a glucose-starved cell with prominently visible yellow puncta. Meanwhile, lipofuscin and LTR puncta concentrations decreased substantially in KU60019 (Glu-/KU)-treated cells. (G) Yellow puncta (over 0.5 μm2) were counted in ten cells from confocal photographs, and normalized control cell values were plotted. ANOVA determined *P < 0.05, **P < 0.01, #P < 0.05, and ##P < 0.01 as significantly different. Scale bars = 20 μm.
Fig. 2
Fig. 2. Lipofuscin granule accumulation co-localized with autolysosomes in replicative senescence cells.
(A) Replicative senescence human fibroblasts (passage 31 or 32) (Rep Sen) were immune-stained with LC3 autophagosomes or Lamp1 lysosomes antibodies. Compared to early-passage cells (passage 20 or earlier) (Early), Lamp1 and LC3 positive puncta were far more abundant and co-localized (yellow puncta) with a pattern similar to glucose-starved cells (Early + Glu-). KU60019 treatment for three days lowered red and green puncta levels and co-localization. (B) As visualized through confocal microscopy, autofluorescent puncta levels substantially increased and were predominantly co-localized with lysosomes in senescent cells (Rep Sen). The bottom panel illustrates senescent cells presenting granular yellow puncta and cytosolic green fluorescence. KU60019 treatment attenuated lipofuscin granule and lysosome accumulation (Rep Sen + KU). LTR, LysoTrackRed. (C) Yellow puncta (over 0.5 μm2) were counted in ten sample cells visualized by confocal photographs, and normalized control cell values were plotted. (D) Early passage and replicative senescence cells were glucose-starved (Glu-) or treated with KU60019 (+KU). Flow cytometry examined 10,000 cells at 530 nm to determine cellular autofluorescence. Means normalized by the control were plotted (three biological repeats). (E) Early passage (Ctl) and senescent cells were either mock- (Sen) or KU60019 (Sen/KU)-treated. Lysosensor yellow/blue DND-160 dye stained 10,000 cells for lysosome acidity determination. ANOVA determined **P < 0.01, #P < 0.05, and ##P < 0.01 as significantly different. Scale bars = 20 μm.
Fig. 3
Fig. 3. Lipofuscin fluorescence primarily increased in the cytoplasm of doxorubicin-induced senescence cells.
Human fibroblast senescence was induced by a doxorubicin pulse and chased for five or six days, during which flow cytometry quantified 10,000 cells for lipofuscin fluorescence (A and B) or confocal imaging assessed autofluorescence and lysosomes (stained with LysoTrackRed [LTR]) (C). (B) Lipofuscin fluorescence levels gradually increased and surpassed glucose-starved levels (pale-grey bar, Glu-) in cells chased for three or six days (black bar). Glucose starvation during the chase substantially elevated lipofuscin fluorescence (dark grey, Dox + Glu-). The three biological repeats’ means were determined, and relative changes were plotted. (C) Yellow puncta were rarely visible in the cells chased for five days (Dox 5D), contrasting cells that underwent glucose starvation for three days (Glu-). ANOVA determined **P < 0.01 as significantly different. Scale bars = 20 μm.
Fig. 4
Fig. 4. Autophagy was suppressed in doxorubicin-induced senescence cells.
(A) Fibroblasts chased for three or five days after doxorubicin pulse (Dox 3D and Dox 5D) were immunostained for LC3 or Lamp1. LC3-positive puncta (green) levels were low and rarely overlapped with Lamp1-positive puncta (red), indicating low autolysosome accumulation levels. This observation contrasts the high autolysosome levels in glucose-starved cells (Glu-). (B) LC3-II molecule levels did not increase during the five-day chase (upper), contrasting LC3-II levels in replicative senescence cells (Sen), where levels reached those of cells where chloroquine (CQ) treatment blocked autophagy flux (lower). (C) In cells undergoing glucose starvation for three days (Glu-) or replicative senescence (Rep Sen), LC3 molecules were exclusively localized as puncta in the cytoplasm. Alternatively, LC3 signals were abundantly localized within the nucleus and perinuclear regions in doxorubicin-chased cells (Dox 3D and Dox 5D), demonstrating an unsuccessful nuclear exit regarding the substantial LC3 molecule population. These results also indicate low autophagosome and autolysosome levels in doxorubicin-induced senescence cells are attributed to low autophagy initiation levels. Scale bars = 20 μm.
Fig. 5
Fig. 5. Autophagy activation drives lipofuscin granule accumulation.
(A and B) Fibroblasts mock-treated or chased for five days after doxorubicin pulse were treated with Torin-1 4 h before collection for LC3 molecular western blotting or confocal microscopic autofluorescence and lysosome (LysoTrackRed [LTR]) examination. (A) Torin-1 treatment increased LC3-I to LC3-II conversion, as predicted by its autophagy activation effect. (B) Treatment also increased lipofuscin granule and lysosome quantities in doxorubicin-induced senescence (Dox 5D + Torin) and control cells (Ctl + Torin). The increased lipofuscin granules primarily overlap with lysosomes, indicating autolysosomal lipofuscin accumulation. (C) Yellow puncta (over 0.5 μm2) in the confocal microphotographs were counted in ten cells, and the average number per cell was plotted. Amounts significantly increased in cells chased for five days (Dox) and were further elevated by Torin-1 treatment (Dox + Tor) to levels comparable to glucose-starved cells (Glu-). Torin-1 treatment for control cells (Tor) did not significantly affect granule levels. (D) Lipofuscin fluorescence levels in variously treated cells were determined through flow cytometry. Torin-1 treatment alone did not affect lipofuscin fluorescence in control (Tor) or glucose-starved cells (Glu- + Tor) but significantly increased in cells chased after doxorubicin pulse (Dox + Tor), suggesting Torin-1-induced autophagy activation upregulates lipofuscin generation and granule formation. The means of the three biological repeats were plotted. ANOVA determined *P < 0.05, **P < 0.01, and ##P < 0.01 as statistically different. Scale bars = 10 μm.

References

    1. Allaire J., Maltais F., LeBlanc P., Simard P.M., Whittom F., Doyon J.F., Simard C., Jobin J. Lipofuscin accumulation in the vastus lateralis muscle in patients with chronic obstructive pulmonary disease. Muscle Nerve. 2002;25:383–389. doi: 10.1002/mus.10039. - DOI - PubMed
    1. Blommaart E.F., Krause U., Schellens J.P., Vreeling-Sindelárová H., Meijer A.J. The phosphatidylinositol 3‐kinase inhibitors wortmannin and LY294002 inhibit autophagy in isolated rat hepatocytes. Eur. J. Biochem. 1997;243:240–246. doi: 10.1111/j.1432-1033.1997.0240a.x. - DOI - PubMed
    1. Boulton M., Davies S., Ellis S. Lipofuscin turnover. Invest. Ophthalmol. Vis. Sci. 1999;40:1887–1888. - PubMed
    1. Brunk U.T., Terman A. The mitochondrial‐lysosomal axis theory of aging: accumulation of damaged mitochondria as a result of imperfect autophagocytosis. Eur. J. Biochem. 2002;269:1996–2002. doi: 10.1046/j.1432-1033.2002.02869.x. - DOI - PubMed
    1. Brunk U.T., Jones C.B., Sohal R.S. A novel hypothesis of lipofuscinogenesis and cellular aging based on interactions between oxidative stress and autophagocytosis. Mutat. Res. 1992;275:395–403. doi: 10.1016/0921-8734(92)90042-N. - DOI - PubMed