. 2023 Jul-Sep;106(3):368504231184320.
doi: 10.1177/00368504231184320.

Potential effects of brain lipid binding protein in the pathogenesis of amyotrophic lateral sclerosis

Affiliations

Potential effects of brain lipid binding protein in the pathogenesis of amyotrophic lateral sclerosis

Qi Zhou et al. Sci Prog. 2023 Jul-Sep.

Abstract

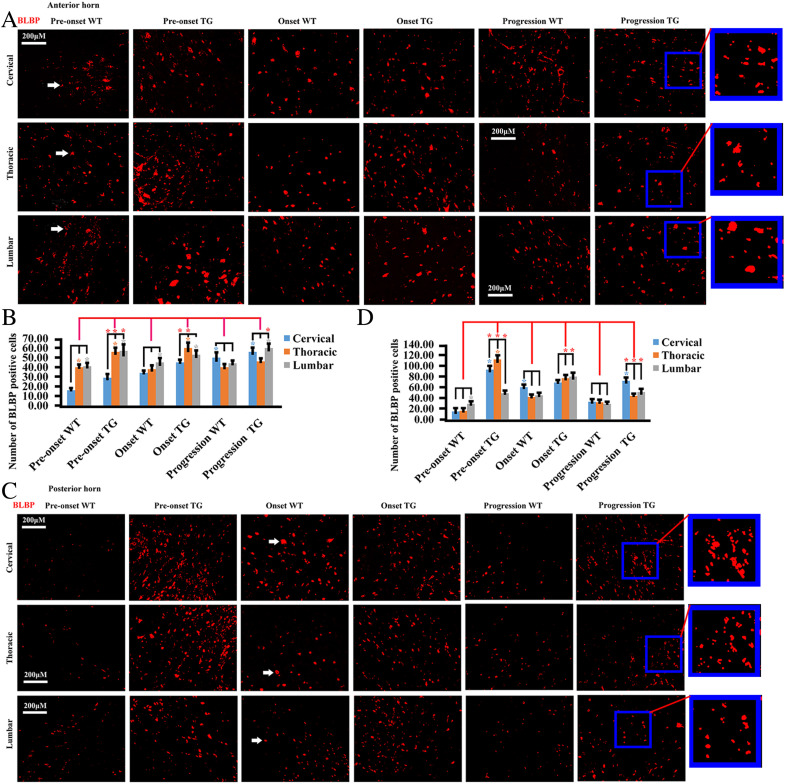
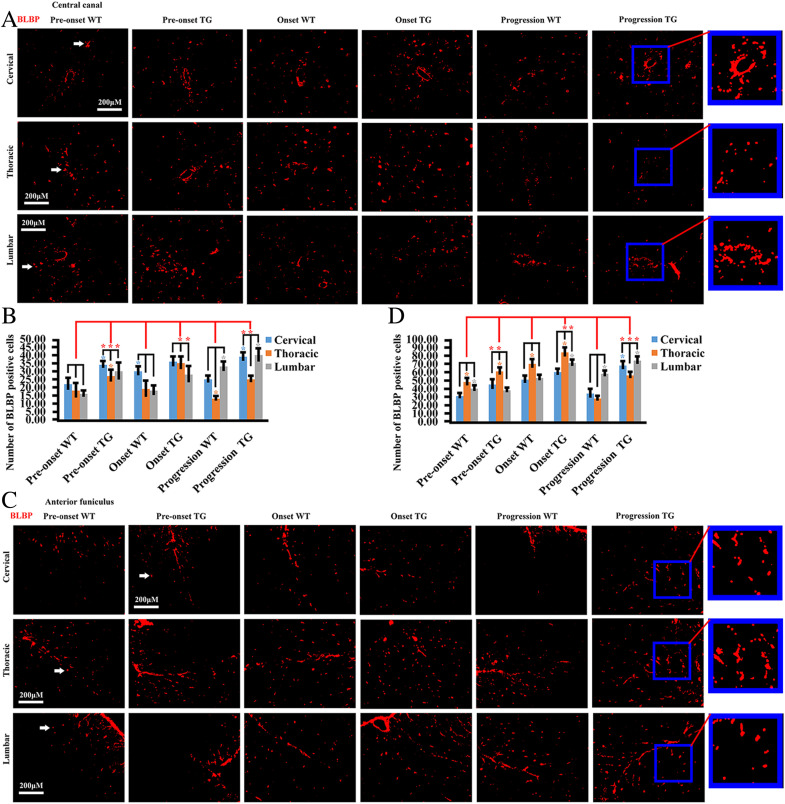
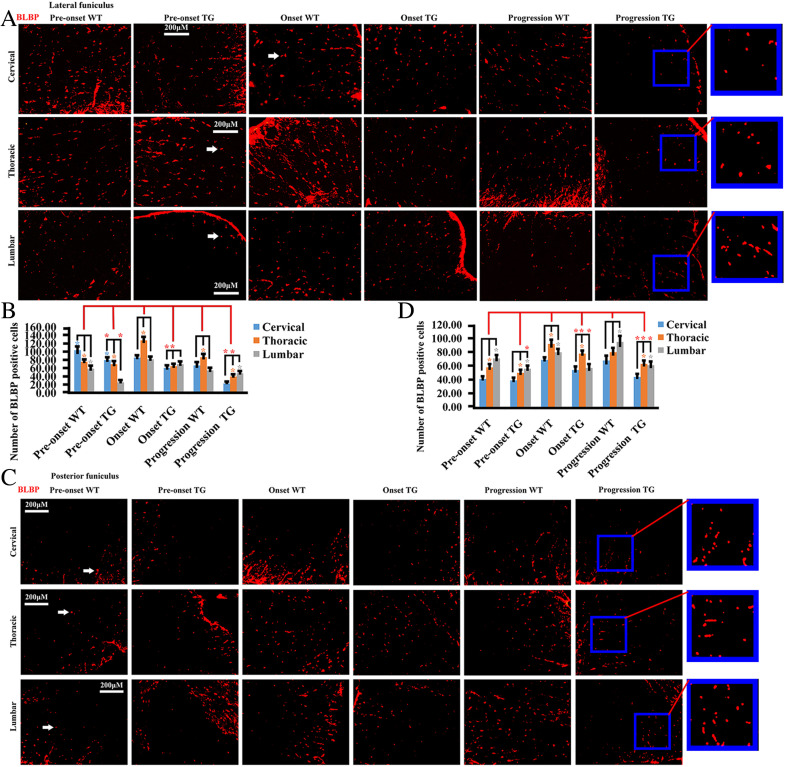
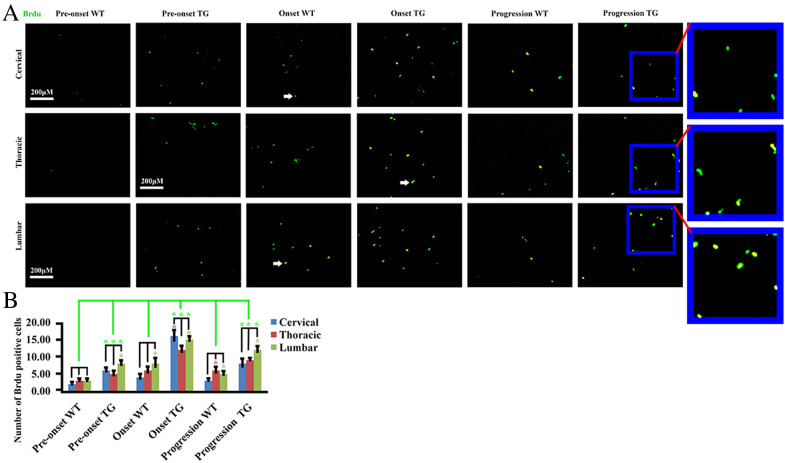
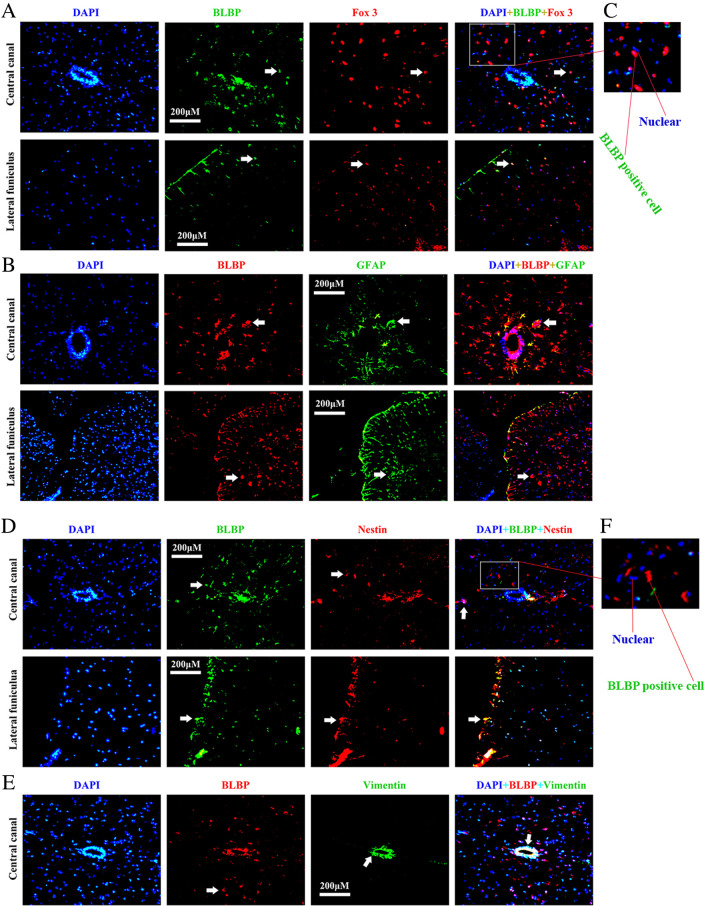
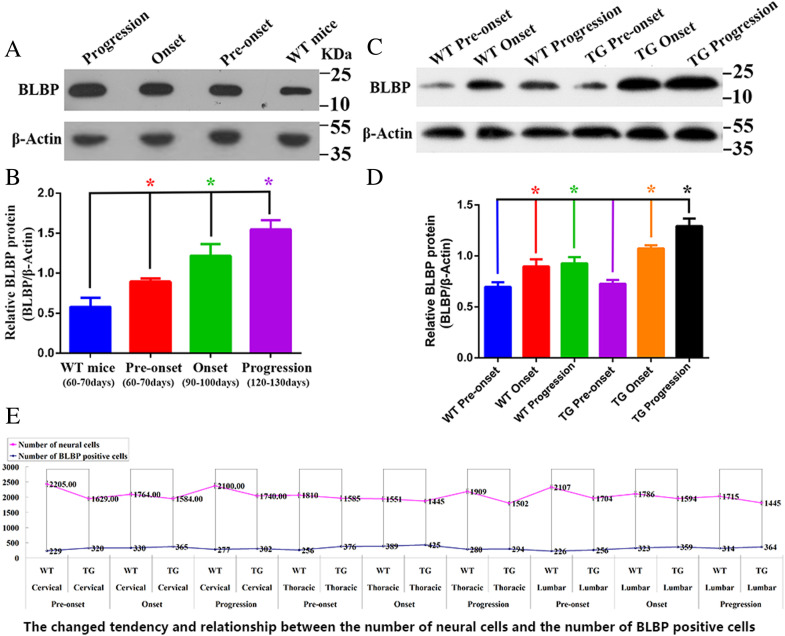
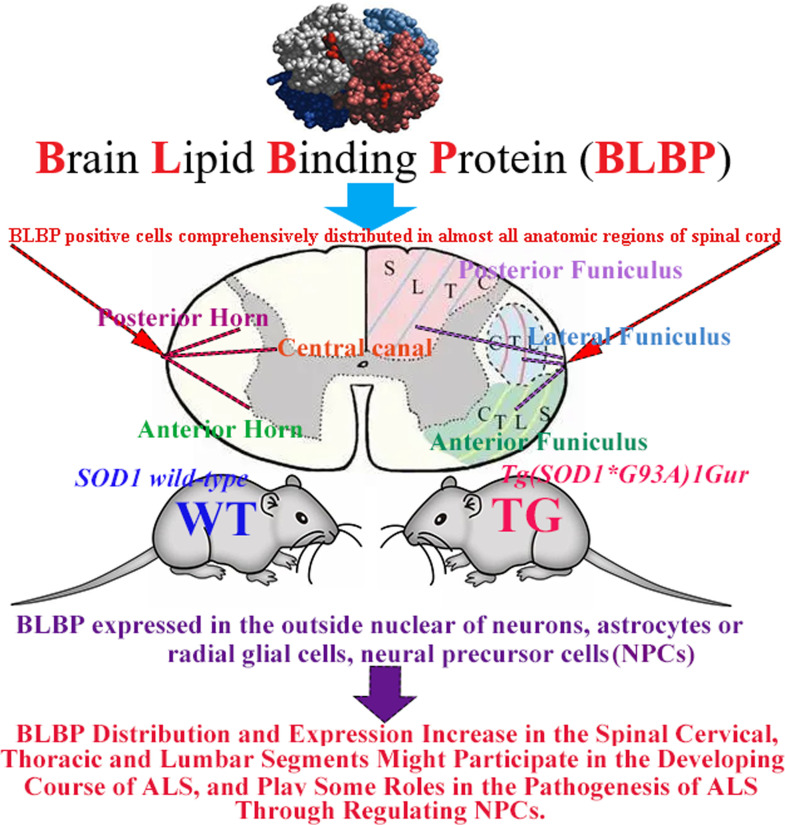
Current studies suggest that the abnormal alteration of brain lipid binding protein (BLBP) might participate in the pathogenesis of amyotrophic lateral sclerosis (ALS). However, the detailed understanding of ALS pathogenesis been yet to be elucidated. Therefore, this research intended to explore the potential effects of BLBP in ALS. The observation and analysis of BLBP-altered features in various anatomical areas and different spinal segments was conducted at the pre-onset, onset, and progression stages of Tg(SOD1*G93A)1Gur (TG) mice and the same periods of age-matched SOD1 wild-type (WT) mice by fluorescence immunohistochemistry and western blotting. BLBP-positive cells were comprehensively distributed in various spinal anatomical areas, especially in both the anterior and posterior horn, around the central canal and in anterior, lateral, and posterior funiculi. Overall, BLBP expression tended to increase from the pre-onset to the onset to the progression stages of the same periods of age-matched WT mice. Furthermore, in TG mice, BLBP expression in the entire spinal cord significantly increased from onset to the progression stage. BLBP was expressed in neurons, astrocytes, and radial glial cells, and at the early and late stages of neural precursor cells (NPCs) and was predominantly distributed outside the cell nucleus. The increase of BLBP-positive cells was closely related to neural cell reduction in TG mice. The distribution and increased expression of BLBP among the cervical, thoracic, and lumbar segments of the spinal cord might participate in the development of ALS and exert potential effects in the pathogenesis of ALS by regulating NPCs.

Keywords: Amyotrophic lateral sclerosis; Tg(SOD1*G93A)1Gur mice; brain lipid binding protein; pathogenesis; spinal cord.


Conflict of interest statement

The author(s) declare that the research was conducted in the absence of any commercial or financial relationships that could be construed as a potential conflict of interest.

Figures

Figure 1.
Figure 1.
The analysis of the distribution of BLBP-positive cells in the AH and PH of cervical, thoracic, and lumbar segments of spinal cord at different stages of TG mice and the same periods of age-matched WT mice. (A) The representative fluorescent immunohistochemical images of BLBP-positive cells in AH. Bar (amplified 20 times, 20×), 200 µM. White arrow indicates BLBP-positive cells. (B) The quantitative analysis of BLBP-positive cells in AH. (C) The representative fluorescent immunohistochemical images of BLBP-positive cells in PH. White arrow indicates BLBP-positive cells. (D) The quantitative analysis of BLBP-positive cells in PH. Asterisk indicates statistically significant differences at P<0.05. Different color asterisks represent the column graph color of correspondence group, indicate that this group is significantly different compared with corresponding group. Red asterisk represents a comparative statistical significance between WT and TG groups. AH: anterior horn; BLBP: brain lipid binding protein; PH: posterior horn; TG: Tg(SOD1*G93A)1Gur; WT: wild-type.
Figure 2.
Figure 2.
The quantitative analysis of the distribution of BLBP-positive cells in CC and AF of cervical, thoracic, and lumbar segments of spinal cord at different stages of TG mice and the same periods of age-matched WT mice. (A) The representative fluorescent immunohistochemical images of BLBP-positive cells in CC. (B) The quantitative analysis of BLBP-positive cells in CC. (C) The representative fluorescent immunohistochemical images of BLBP-positive cells in AF. (D) The quantitative analysis of BLBP-positive cells in AF. White arrow points to BLBP-positive cells. Asterisk indicates statistically significant differences at P<0.05. Different colored asterisks represent the column graph color of correspondence group, indicate that this group is significantly different compared with corresponding group. Red asterisk represents a comparative statistical significance between WT and TG groups. AF: anterior funiculus; BLBP: brain lipid binding protein; CC: central canal; TG: Tg(SOD1*G93A)1Gur; WT: wild-type.
Figure 3.
Figure 3.
The quantitative analysis of the distribution of BLBP-positive cells in LF and PF of cervical, thoracic, and lumbar segments of spinal cord at different stages of TG mice and the same periods of age-matched WT mice. (A) The representative fluorescent immunohistochemical images of BLBP-positive cells in LF. (B) The quantitative analysis of BLBP-positive cells in LF. (C) The representative fluorescent immunohistochemical images of BLBP-positive cells in PF. (D) The quantitative analysis of BLBP-positive cells in PF. White arrow indicates BLBP-positive cells. Asterisk indicates statistically significant differences at P<0.05. Different colored asterisks represent the column graph color of correspondence group, indicate that this group is significantly different compared with corresponding group. Red asterisk represents a comparative statistical significance between WT and TG groups. BLBP: brain lipid binding protein; LF: lateral funiculi; PF: posterior funiculi; TG: Tg(SOD1*G93A)1Gur; WT: wild-type.
Figure 4.
Figure 4.
The quantitative analysis of the distribution of BPCs in the cervical, thoracic, and lumbar segments of spinal cord at the different stages of TG mice and the same periods of age-matched WT mice. (A) The representative fluorescent immunohistochemical images of BPCs. Bar (20×), 200 µM. White arrow indicates BPCs. (B) The quantitative analysis of BPCs. All asterisks on graphs indicate a comparative statistical significance at P<0.05, different colored asterisks represent the column graph color of correspondence group, indicate that this group is significantly different compared with corresponding group. Green asterisk represents a comparative statistical significance between WT and TG groups. BPC: BrdU-positive cells; TG: Tg(SOD1*G93A)1Gur; WT: wild-type.
Figure 5.
Figure 5.
The overlapped staining of BLBP, DAPI, Fox3 and GFAP, and BLBP, DAPI, Nestin and Vimentin in the spinal cord of WT and TG mice. (A) The representative image of BLBP and Fox3 staining in central canal (CC) and lateral funiculus (LF). BLBP-positive cells show partial double staining with Fox3, indicating that BLBP is partially expressed in neurons. White arrow points to BLBP-positive, DAPI-positive, and Fox3-positive cells and triple-positive cells for BLBP, DAPI, and Fox3. (B) The representative image of BLBP and GFAP staining in CC and LF. BLBP-positive cells show partial double staining with GFAP, indicating that BLBP is partially expressed in astrocytes or RGCs. White arrow indicates BLBP-positive, DAPI-positive, and Fox3-positive cells and triple-positive cells for BLBP, DAPI, and GFAP. (C) The representative image of BLBP and DAPI staining in CC. Most BLBP-positive cells did not exhibit overlapping staining with DAPI, indicating that BLBP is predominantly distributed outside of neural cell nucleus. (D) The representative image of BLBP and Nestin staining in CC and LF. BLBP-positive cells showed partial double staining with Nestin, indicating that BLBP is partially expressed at the early stage of NPCs. White arrow points to BLBP-positive, DAPI-positive, and Nestin-positive cells and the cells triple stained with BLBP, DAPI, and Nestin. (E) The representative image of BLBP and Vimentin staining in CC. BLBP-positive cells showed partial double staining with Vimentin, indicating that BLBP is partially expressed at the later stage of NPCs. White arrow points to BLBP-positive, DAPI-positive, and Vimentin-positive cells and the cells triple stained with BLBP, DAPI, and Vimentin. (F) The representative image of BLBP and DAPI in CC. Almost all BLBP-positive cells did not exhibit double staining with DAPI, indicating that BLBP is predominantly distributed outside of neural cell nucleus. BLBP: brain lipid binding protein; CC: central canal; DAPI: 4′,6-diamidino-2-phenylindole; LF: lateral funiculi; NPC: neural precursor cell; RGC: radial glial cell; TG: Tg(SOD1*G93A)1Gur; WT: wild-type.
Figure 6.
Figure 6.
The comparison of BLBP expression in entire spinal cord at the different stages of TG mice and the same periods of age-matched WT mice. (A) The WB analysis of BLBP expression in entire spinal cord at the pre-onset, onset, and progression same periods of age-matched WT mice. (B) The quantitative analysis of BLBP WB showed that BLBP expression significantly increased with increasing age. (C) The WB analysis of BLBP expression in entire spinal cord at the pre-onset, onset, and progression stages of TG mice and the same periods of age-matched WT mice. (D) The quantitative analysis of BLBP WB showed that BLBP expression in entire spinal cord significantly increased from pre-onset stage to progression stage, and BLBP expression in entire spinal cord significantly increased at both onset and progression stages of TG mice compared with the same periods of age-matched WT mice. All asterisks on graphs indicate a comparative statistical significance at P<0.05, different color asterisks represent the column graph color of correspondence group, indicate that this group is significantly different compared with corresponding group. (E) Relationship between BLBP-positive cells and neural cell reduction in the cervical, thoracic and lumbar segments of spinal cord at the different stages of TG mice and the same periods of age-matched WT mice. The increase of BLBP-positive cells was accompanied by an increase of neural cell reduction in the cervical, thoracic and lumbar segments at the pre-onset, onset, and progression stages of TG mice compared with the same periods of age-matched WT mice. BLBP: brain lipid binding protein; TG: Tg(SOD1*G93A)1Gur; WB: western blotting; WT: wild-type.
Figure 7.
Figure 7.
Schematics illustrating how both distribution and increased expression of BLBP among the cervical, thoracic, and lumbar segments of spinal cord participates in the developing course of ALS and exerts potential effects in the pathogenesis of ALS by regulating NPCs. ALS: amyotrophic lateral sclerosis; BLBP: brain lipid binding protein; NPC: neural precursor cell.

Similar articles

Cited by

References

    1. Cozzolino M, Carrì MT. Mitochondrial dysfunction in ALS. Prog Neurobiol 2012; 97: 54–66. - PubMed
    1. Kiernan MC, Vucic S, Cheah BC, et al.Amyotrophic lateral sclerosis. Lancet 2011; 377: 942–955. - PubMed
    1. Kaur SJ, McKeown SR, Rashid S. Mutant SOD1 mediated pathogenesis of amyotrophic lateral sclerosis. Gene 2016; 577: 109–118. - PubMed
    1. Suzuki N, Nishiyama A, Warita H, et al.Genetics of amyotrophic lateral sclerosis: seeking therapeutic targets in the era of gene therapy. J Hum Genet 2023; 68: 131–152. - PMC - PubMed
    1. Philips T, Rothstein JD. Rodent models of amyotrophic lateral sclerosis. Curr Protoc Pharmacol 2015; 69: 5.67.1–21. - PMC - PubMed

Substances