. 2023 Jul;71(7):357-375.
doi: 10.1369/00221554231185809. Epub 2023 Jul 13.

Absence of E-Cadherin and β-Catenin in the Basal Plasma Membrane of Collecting Duct Cells During NDI Development and Recovery

Affiliations

Absence of E-Cadherin and β-Catenin in the Basal Plasma Membrane of Collecting Duct Cells During NDI Development and Recovery

Xabier Sørtvedt et al. J Histochem Cytochem. 2023 Jul.

Abstract

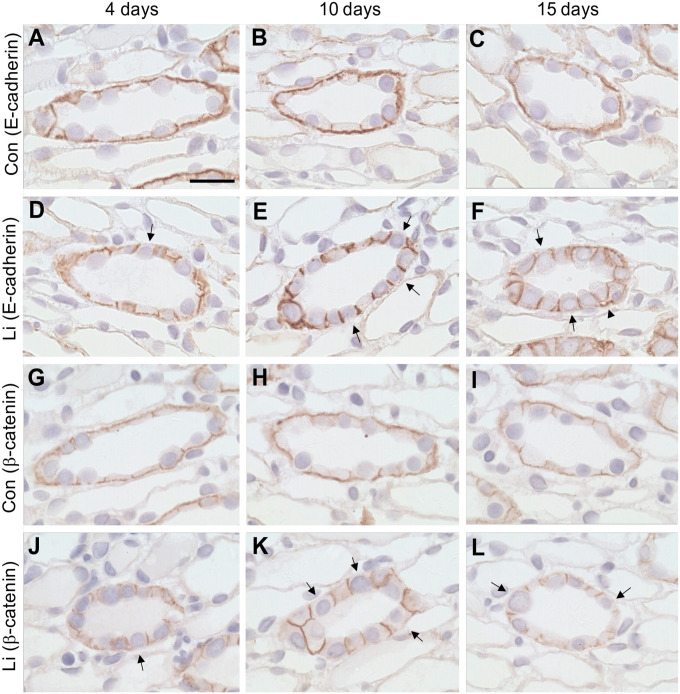
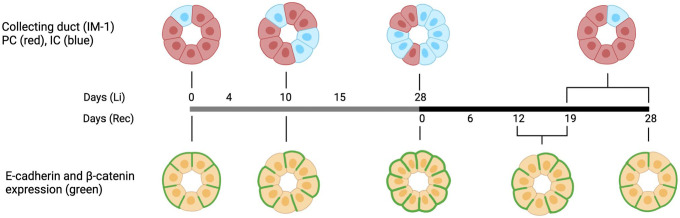
Lithium (Li) induces severe polyuria and polydipsia in up to 40% of patients undergoing Li treatment. In rats, Li treatment induces a reversible cellular remodeling of the collecting duct (CD), decreasing the fraction of principal-to-intercalated cells. To investigate the potential role of adherens junction proteins, we performed immunohistochemistry on kidney cross-sections from rats treated with Li as well as rats undergoing recovery on a normal diet following 4 weeks of Li-treatment. We performed immunoelectron microscopy on cryosections to determine the ultrastructural localizations. Immunohistochemistry showed that E-cadherin and β-catenin were present in both the lateral and basal plasma membrane domains of CD cells. Immunoelectron microscopy confirmed that β-catenin was localized both to the lateral and the basal plasma membrane. The basal localization of both proteins was absent from a fraction of mainly principal cells after 10 and 15 days of Li-treatment. After 4 weeks of Li-treatment few to no cells were absent of E-cadherin and β-catenin at the basal plasma membrane. After 12 and 19 days of recovery some cells exhibited an absence of basal localization of both proteins. Thus, the observed localizational changes of E-cadherin and β-catenin appear before the cellular remodeling during both development and recovery from Li-NDI.

Keywords: adherens junction; cellular remodeling; collecting duct; diabetes insipidus; lithium.


Conflict of interest statement

The author(s) declared no potential conflicts of interest with respect to the research, authorship, and/or publication of this article.

Figures

Figure 1.
Figure 1.
Experimental setup. Paraffin-embedded sections from previously published Li and recovery studies were used., Short-term Li protocols; control rats and rats treated with Li for 4, 10, and 15 days. Recovery protocols; control rats and rats treated with Li for 28 days followed by recovery on a Li-free diet for 0, 6, 12, 19, and 28 days.
Figure 2.
Figure 2.
E-cadherin and β-catenin are present in both the lateral and basal plasma membrane of inner medullary CD cells. Immunohistochemistry of paraffin-embedded kidney sections from control rats labeled for E-cadherin or β-catenin in the proximal part of inner medulla (IM-1, A and B). Both proteins are predominantly localized to the basolateral plasma membrane domain of the IM-1 CD cells (A and B). Scale bar: 50 µm. Kidney cryosections for transmission electron microscopy were incubated with anti-β-catenin, and 10-nm gold-conjugated secondary antibody. β-catenin are localized to the basal (C, arrows, scale bar: 200 nm) and lateral plasma membranes (C, inset, arrows, scale bar: 100 nm). Abbreviations: AJ, adherens junction; BM, basement membrane; CD, collecting duct; TJ, tight junction.
Figure 3.
Figure 3.
Cells without basal E-cadherin and β-catenin labeling appears at 10 days Li. Immunohistochemistry of paraffin-embedded kidney sections from control rats and rats treated with Li for 4, 10, and 15 days. Sections were incubated with anti-E-cadherin (A-F) or anti-β-catenin (G-I). In the proximal part of IM, no apparent difference in the amount of cells absent of basal E-cadherin or β-catenin labeling was observed after 4 days of Li treatment (A, D, G, J). In contrast, after 10 and 15 days of Li treatment, a noticeable increase in cells absent of the two proteins in the basal plasma membrane domains were observed, when compared with controls (B-C, E-F, H-I, K-L, arrows). In addition, dilated extracellular spaces at the basal plasma membrane domains were observed after 15 days of Li treatment (F, arrowheads). Scale bar: 20 µm.
Figure 4.
Figure 4.
Cells without basal E-cadherin labeling are not observed after 0 days recovery, but are observable to some extent after 12 days of recovery. Immunohistochemistry of kidney sections from control rats and rats treated with Li for 28 days followed by recovery for 0, 6, 12, 19, and 28 days. Sections were incubated with anti-E-cadherin. After 0 days of recovery, no change in the amount of cells absent of basal E-cadherin was observed in the proximal part of IM (A and B). After 12 and 19 days of recovery, absence of E-cadherin at the basal plasma membrane domains was seen in some cells (E-F, G-H, arrows). After 28 days of recovery, cells absent of basal E-cadherin were occasionally observed (I-J, arrows). Dilated extracellular spaces were observed after 0 days of recovery (B, arrowheads). Scale bar: 20 µm. Abbreviation: IM-1, inner medulla-1.
Figure 5.
Figure 5.
Cells without basal β-catenin labeling are not observed after 0 days recovery, but are observable to some extent after 12 days of recovery. Immunohistochemistry of kidney sections from control rats and rats treated with Li for 28 days followed by recovery for 0, 6, 12, 19, and 28 days. Sections were incubated with anti-β-catenin. After 0 days recovery, no change in amount of cells absent of basal β-catenin was observed in IM-1 (A and B). After 12 and 19 days of recovery, absence of β-catenin at the basal plasma membrane was seen in some cells (E-H, arrows). After 28 days of recovery, cells absent of basal β-catenin were occasionally observed (I-J, arrows). Scale bar: 20 µm. Abbreviation: IM-1, inner medulla-1.
Figure 6.
Figure 6.
E-cadherin is absent primarily in AQP4-positive cells. Triple immunofluorescent labeling of E-cadherin (green), AQP4 (red) and H+-ATPase (blue) on kidney sections from control rats and rats after 10 days Li and after 12 days recovery. 10 days Li induced many cells absent of basal E-cadherin labeling compared with controls (B, E, arrows). Almost all of these cells were AQP4-positive (C, F, arrowheads). Only very few H+-ATPase-positive cells were absent of basal E-cadherin (F, asterisk). After 12 days of recovery, an increase in cells absent of basal E-cadherin was observed when compared with controls (H, K, arrows). These cells were also AQP4-positive (I, L, arrowheads). Scale bar: 30 µm.
Figure 7.
Figure 7.
Mainly AQP4-positive cells are absent for β-catenin. Triple immunofluorescent labeling of or β-catenin (green), AQP4 (red) and H+-ATPase (blue) on kidney sections from control rats and rats treated with Li for 10 days and rats under recovery for 12 days. Li treatment for 10 days resulted in more cells absent of β-catenin when compared with controls (B, E, arrows). Almost all of these cells were AQP4-positive (C, F, arrowheads). After 12 days of recovery, cells without basal β-catenin was increased compared with controls (H, K, arrows). These cells also exhibited labeling of AQP4 (I, L, arrowheads). Scale bar: 30 µm.
Figure 8.
Figure 8.
E-cadherin and β-catenin are absent from the basal plasma membrane of the same cells. Double immunofluorescent labeling of β-catenin (green) and E-cadherin (red) on sections from control rats and rats treated with Li for 10 days. β-catenin and E-cadherin labeling colocalizes at basal and lateral plasma membrane domain of CD cells in the proximal part of IM (yellow). CD cells absent of E-cadherin are simultaneously absent of β-catenin and vice versa in both controls (A, arrows) and in rats treated with Li for 10 days (B, arrows). Scale bar: 30 µm. Abbreviations: CD, collecting duct; IM, inner medulla.
Figure 9.
Figure 9.
A decrease in Notch-1 was observed after 10 days of Li-treatment. Immunohistochemistry of paraffin-embedded kidney sections from control rats and rats treated with Li for 4, 10, and 15 days. Sections were incubated with anti-Notch-1. Labeling was observed in the collecting duct cells of the IM, predominantly localized in the cytoplasm, but was also observed at the apical membrane domains. No changes were observed in the localization, nor the amount of labeling after 4 days of Li treatment (A and B). After 10 days of Li treatment, a decrease in labeling intensity was observed in many CDs of the IM-1 when compared with controls (C and D). At 15 days of Li treatment, no apparent changes in labeling intensity of the CDs were observed (E and F). However, in some CD cells the labeling was mainly observed in the apical plasma membrane domains (Fig. 9F). Scale bar: 20 µm. Abbreviations: CD, collecting duct; IM-1, inner medulla-1.
Figure 10.
Figure 10.
Basal expression of E-cadherin and β-catenin is absent from CD cells before the cellular remodeling. Illustrative timepoint representation of the cellular remodeling and absence of basal expression of E-cadherin and β-catenin. The cellular remodeling with an increase in intercalated cell density is observed to occur gradually from 10 days of Li treatment until 28 days of Li treatment (left upper panel,). In addition, the cellular remodeling is reversed toward control levels after 19–28 days of recovery (right upper panel). Our observations in this study suggest that a fraction of CD cells (primarily principal cells) exhibit absence of the adherens junction proteins, E-cadherin and β-catenin at the basal plasma membrane at 10 days, which is just before the major changes in Li induced cellular remodeling (lower panel, green labeling). In contrast, at 28 days of Li, basal labeling was present in the majority of cells. Furthermore, a small fraction of cells exhibiting absence of basal E-cadherin and β-catenin are observed after 12–19 days of recovery just before reversal of the cellular composition to control levels. Illustration was created with BioRender.com. Abbreviations: CD, collecting duct; IC, intercalated cell; PC, principal cell.
Figure A1.
Figure A1.
Isotype specific IgG controls. Immunohistochemistry using anti-E-cadherin (610181, IgG2, A) antibodies and corresponding IgG2 control, (B). In the lower panels show labeling with anti-β-catenin (sc-7963, IgG1, C) and corresponding IgG1 controls. Both control sections (B and D) are negative supporting the specificity of the antibodies. Scale bar: 50 µm.
Figure A2.
Figure A2.
Double immunofluorescent labeling of β-catenin (sc-7199, green) and E-cadherin (610181, red) on kidney cortex sections from control rats. The two proteins colocalize in the cortical collecting duct (CCD), but not in the proximal tubule (PT). β-catenin is observed (arrowheads) in the proximal tubule, whereas E-cadherin is not. This in accordance with previous studies (Prozialeck et al, Tsuchiya et al). This supports the specificity of the antibodies. Scale bar: 20 µm.
Figure A3.
Figure A3.
Immunohistochemistry using three different antibodies for E-cadherin. The antibodies (610181, panel A; PA5-85088, panel B; and LS-B12414, panel C) were tested on control kidney sections. All three antibodies show labeling in the basolateral plasma membrane. This supports the specificity of the E-cadherin antibody. Scale bar: 20 µm.
Figure A4.
Figure A4.
Immunoblotting showing the specificity of (A) E-cadherin (610181), (B) β-catenin (c-7199), and (C) Notch-1 (sc376403) using a mouse cortical collecting duct cell line (mCCDcl1). The E-cadherin antibody recognizes a full-length band at 120 kDa and a cleaved band at 35 kDa (Marambaud et al). The β-catenin antibody recognizes a band at ~85–90 kDa as expected (Uniprot.org). The Notch-1 antibody recognizes a band at ~110–120 kDa corresponding to a cleaved transmembrane intracellular fragment and a full length ~250–300 kDa (Logeat et al).
Figure A5.
Figure A5.
Manual cell counting procedure. The fraction of cells with and without basal E-cadherin labeling were calculated in the upper part of inner medulla (IM-1). Four images were taken per animal using a 25× objective. Each image covered an area of 481 µm × 361 µm. For blinding purposes a third-party unaware of the research imported all images to Microsoft Office PowerPoint in a random sequence. A 6 × 6 grid table was placed on top of each image and cell counting proceeded from the uppermost left grid-frame to the uppermost right frame. Scale bar: 250 µm. Abbreviation: ISOM, Inner Stripe of Outer Medulla.

Similar articles

References

    1. Christensen BM, Zuber AM, Loffing J, Stehle JC, Deen PM, Rossier BC, Hummler E.AlphaENaC-mediated lithium absorption promotes nephrogenic diabetes insipidus. J Am Soc Nephrol. 2011;22(2):253–61. doi:10.1681/ASN.2010070734 - DOI - PMC - PubMed
    1. Kellenberger S, Hoffmann-Pochon N, Gautschi I, Schneeberger E, Schild L.On the molecular basis of ion permeation in the epithelial Na+ channel. J Gen Physiol. 1999;114(1):13–30. doi:10.1085/jgp.114.1.13 - DOI - PMC - PubMed
    1. Palmer LG, Frindt G.Conductance and gating of epithelial Na channels from rat cortical collecting tubule. Effects of luminal Na and Li. J Gen Physiol. 1988;92(1):121–38. doi:10.1085/jgp.92.1.121 - DOI - PMC - PubMed
    1. Dunham PB, Senyk O.Lithium efflux through the Na/K pump in human erythrocytes. Proc Natl Acad Sci U S A. 1977;74(7):3099–103. doi:10.1073/pnas.74.7.3099 - DOI - PMC - PubMed
    1. Kortenoeven ML, Li Y, Shaw S, Gaeggeler HP, Rossier BC, Wetzels JF, Deen PM.Amiloride blocks lithium entry through the sodium channel thereby attenuating the resultant nephrogenic diabetes insipidus. Kidney Int. 2009;76(1):44–53. doi:10.1038/ki.2009.91 - DOI - PubMed

Publication types