. 2023 Jul 13:12:e79165.
doi: 10.7554/eLife.79165.

Inhibitory IL-10-producing CD4+ T cells are T-bet-dependent and facilitate cytomegalovirus persistence via coexpression of arginase-1

Affiliations

Inhibitory IL-10-producing CD4+ T cells are T-bet-dependent and facilitate cytomegalovirus persistence via coexpression of arginase-1

Mathew Clement et al. Elife. .

Abstract

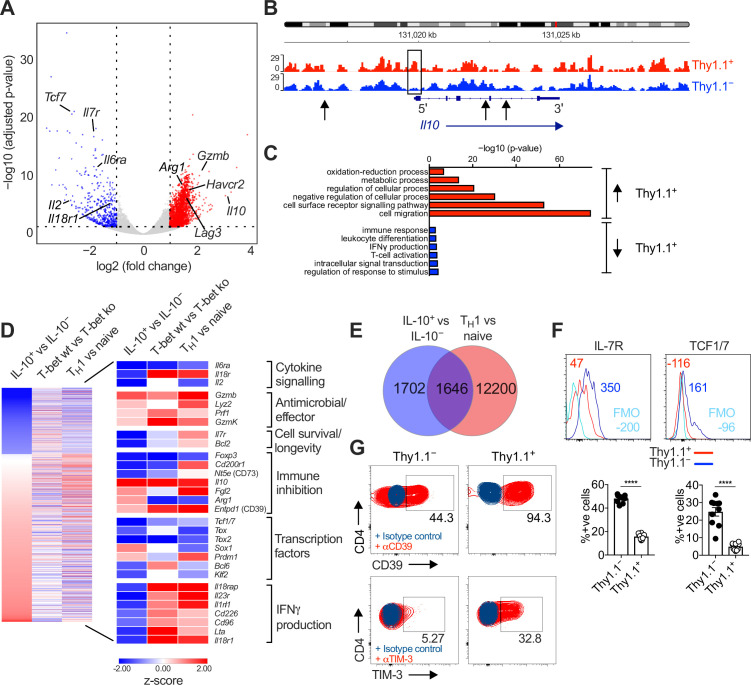
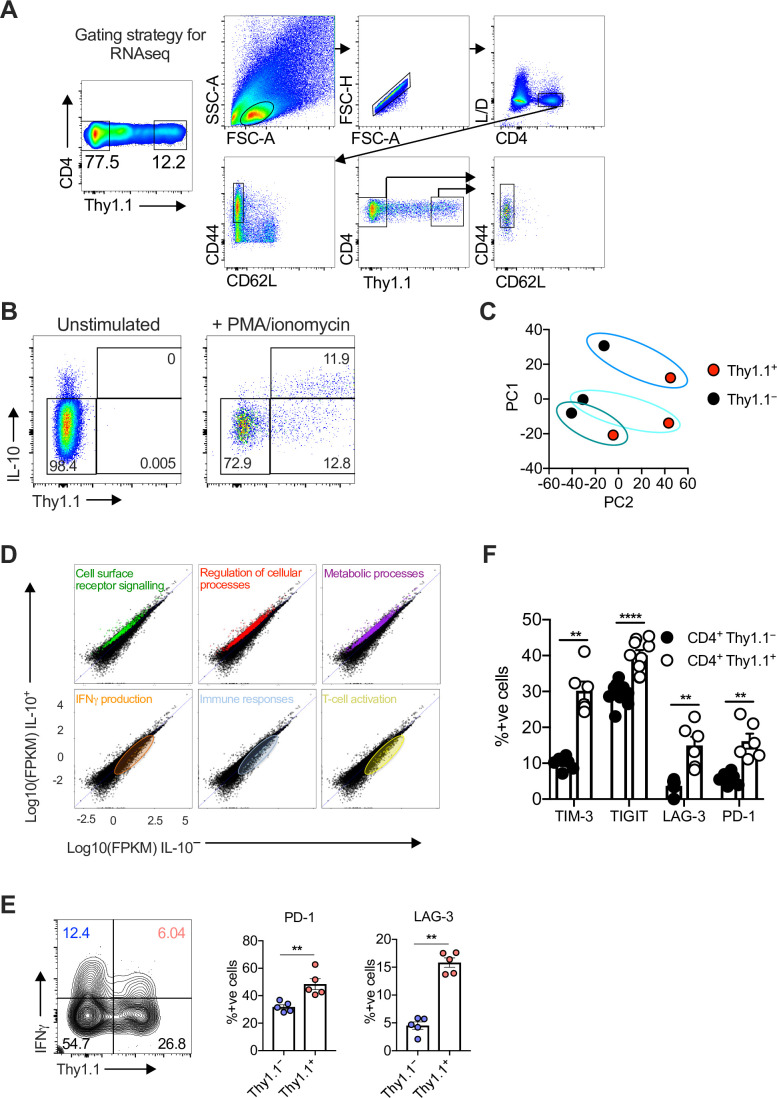
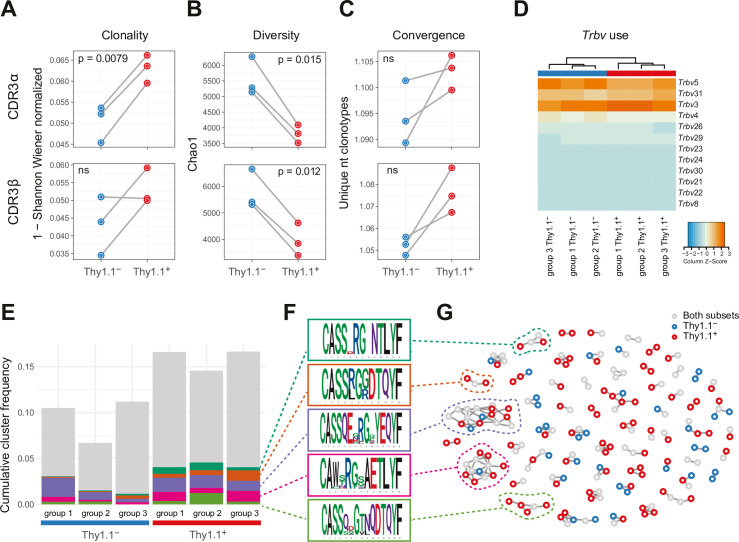
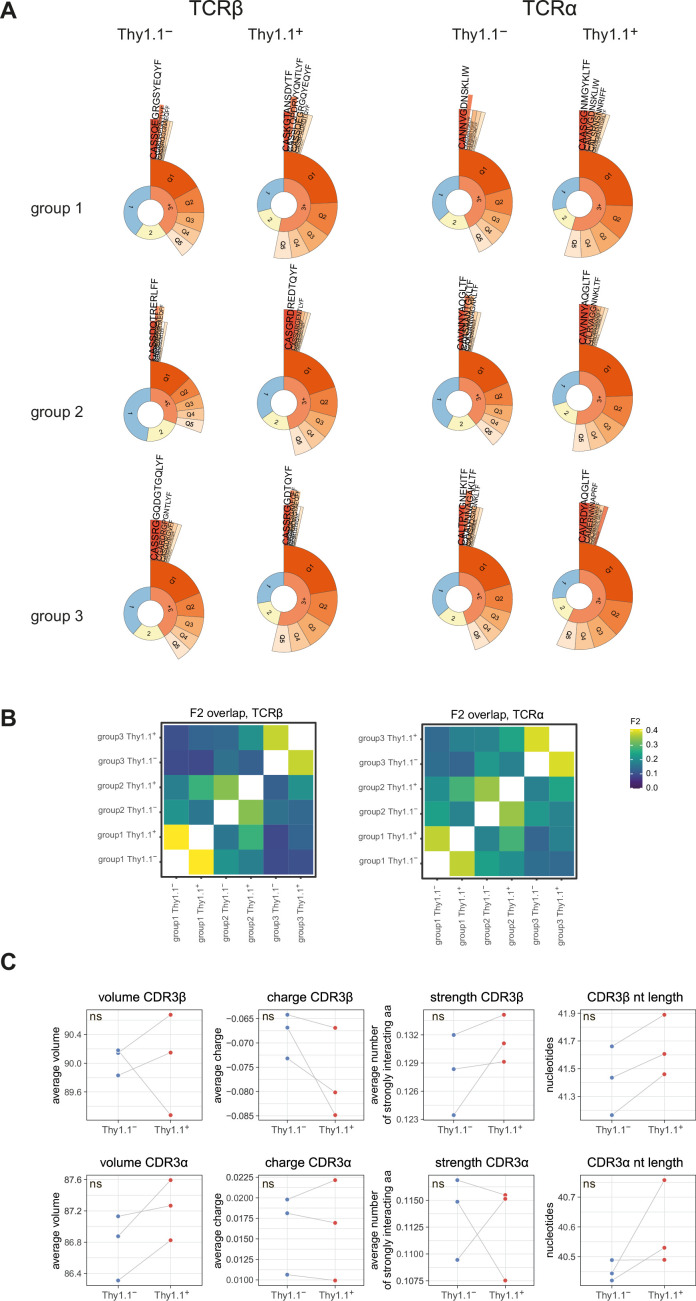
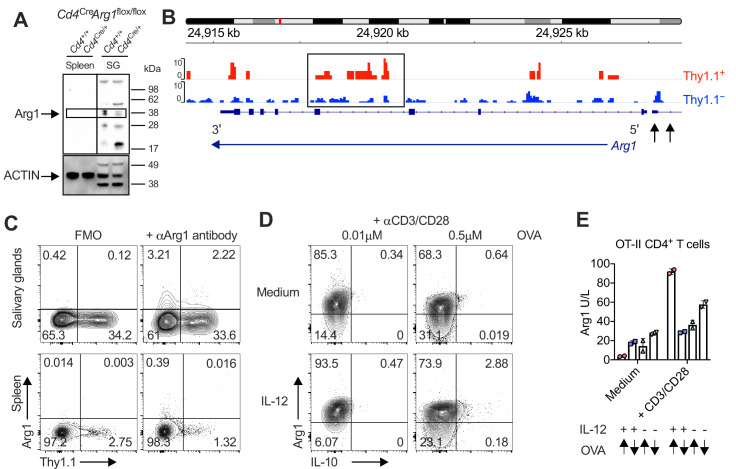
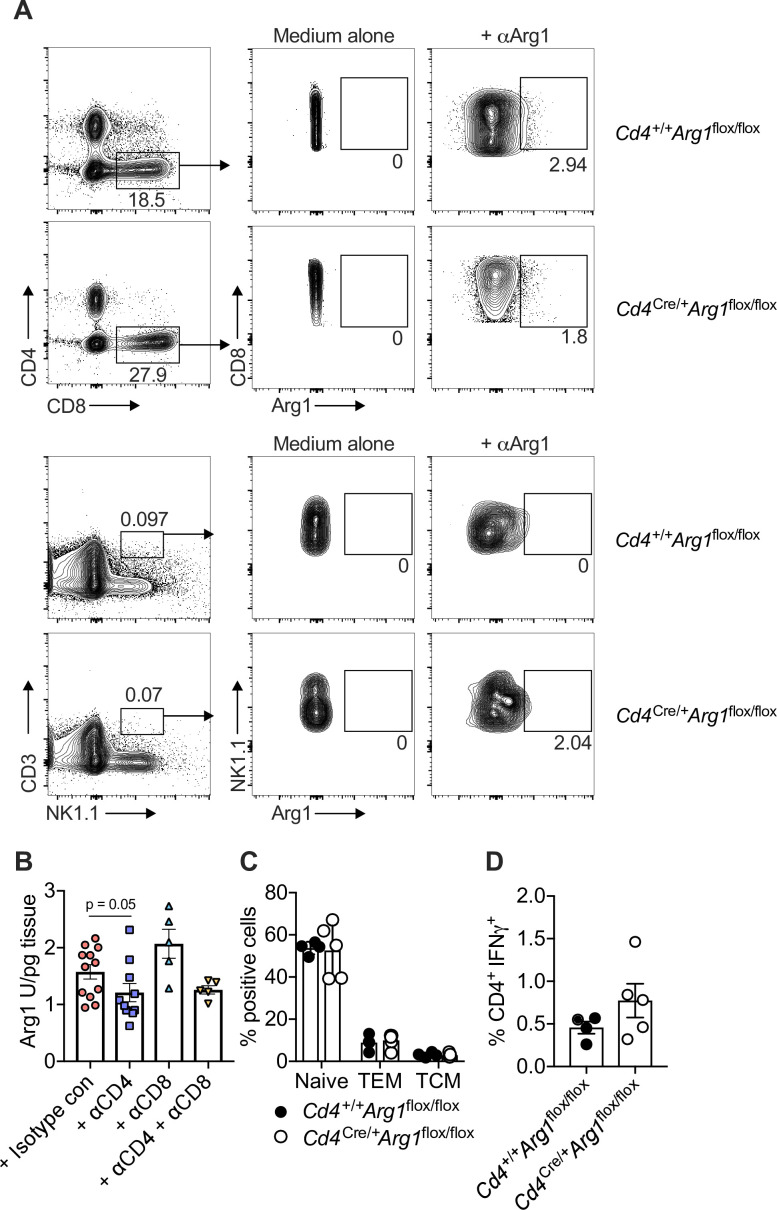
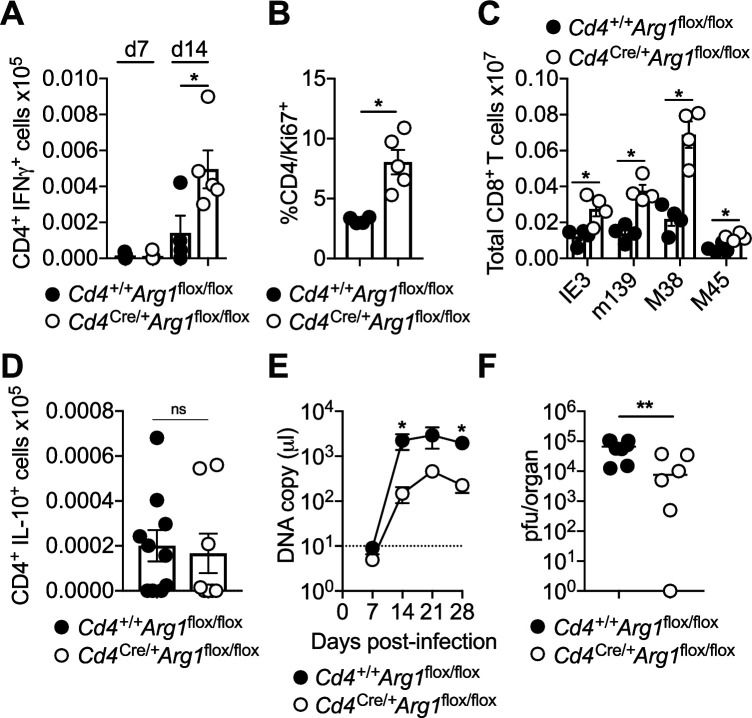
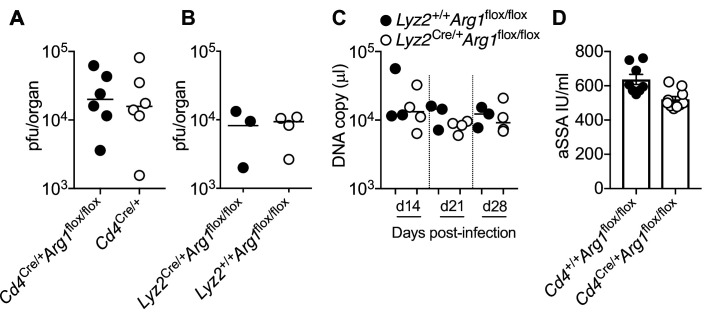
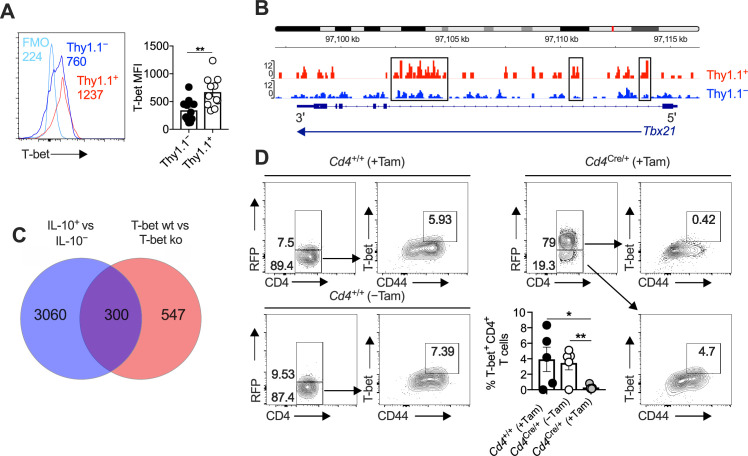
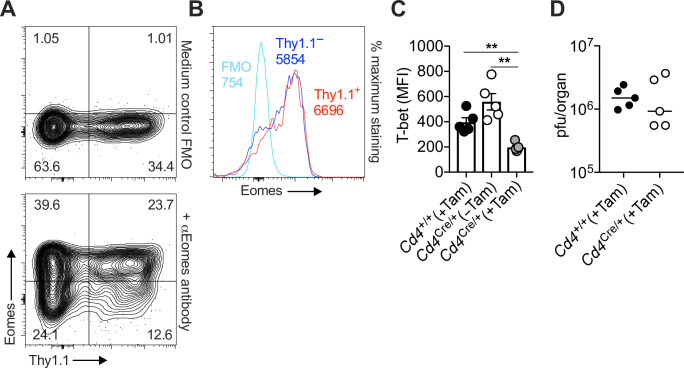
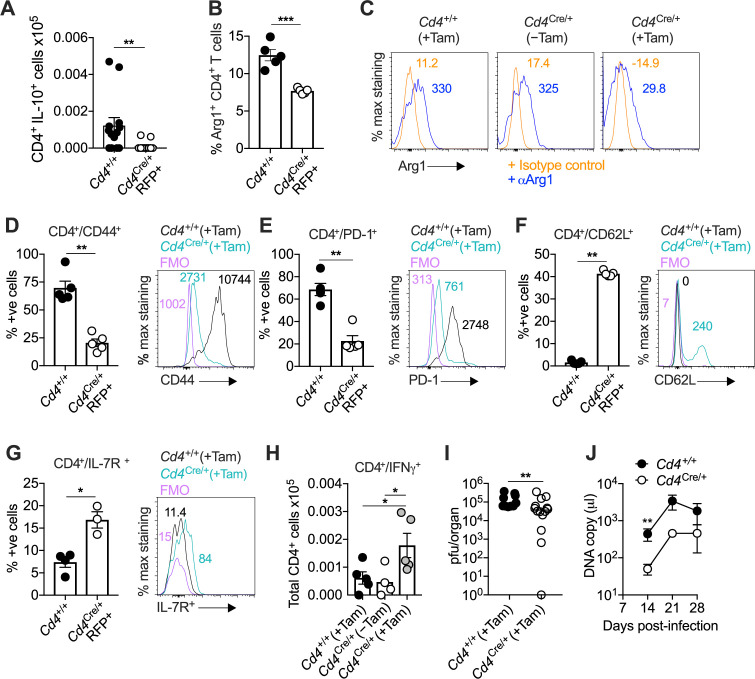
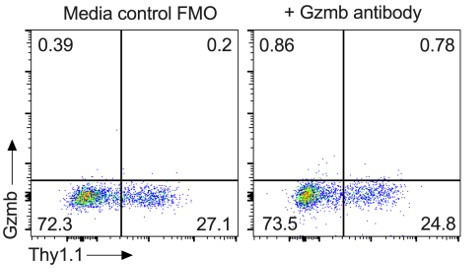
Inhibitory CD4+ T cells have been linked with suboptimal immune responses against cancer and pathogen chronicity. However, the mechanisms that underpin the development of these regulatory cells, especially in the context of ongoing antigen exposure, have remained obscure. To address this knowledge gap, we undertook a comprehensive functional, phenotypic, and transcriptomic analysis of interleukin (IL)-10-producing CD4+ T cells induced by chronic infection with murine cytomegalovirus (MCMV). We identified these cells as clonally expanded and highly differentiated TH1-like cells that developed in a T-bet-dependent manner and coexpressed arginase-1 (Arg1), which promotes the catalytic breakdown of L-arginine. Mice lacking Arg1-expressing CD4+ T cells exhibited more robust antiviral immunity and were better able to control MCMV. Conditional deletion of T-bet in the CD4+ lineage suppressed the development of these inhibitory cells and also enhanced immune control of MCMV. Collectively, these data elucidated the ontogeny of IL-10-producing CD4+ T cells and revealed a previously unappreciated mechanism of immune regulation, whereby viral persistence was facilitated by the site-specific delivery of Arg1.

Keywords: CD4+ T cells; IL-10; T-bet; arginase-1; cytomegalovirus; immunology; infectious disease; inflammation; mice; microbiology; viruses.


Conflict of interest statement

MC, KL, KM, MM, LC, AC, JS, RA, SC, VK, KL, OB, DW, SJ, DC, DP, IH No competing interests declared

Figures

Figure 1.
Figure 1.. Interleukin (IL)-10-producing CD4+ T cells display a TH1-like profile.
10BiT mice were infected with 3 × 10⁴ pfu of murine cytomegalovirus (MCMV). Leukocytes were isolated from the salivary glands (SGs) on day 14 p.i. and sorted as CD4+ CD44+ CD62L CD90/90.1+ (Thy1.1+) or CD90/90.1 (Thy1.1) populations via fluorescence-activated cell sorting (FACS). (A) Volcano plot highlighting differentially upregulated genes in Thy1.1+ CD4+ T cells (red) versus Thy1.1 CD4+ T cells (blue). (B) ATAC-seq profiles showing accessible chromatin regions in the Il10 gene for Thy1.1+ CD4+ T cells (red) and Thy1.1 CD4+ T cells (blue). Data are shown as normalized values accounting for the total number of reads per lane. The black box indicates a major difference in chromatin accessibility. Black arrows indicate binding motifs for Tbx21. (C) Gene ontology analysis of data from (A) indicating the top six modules that were upregulated (red) or downregulated (blue) in Thy1.1+ CD4+ T cells. (D) Heatmap comparing data from (A) (left column) with published data from T-bet+ versus T-bet-knockout CD4+ T cells (middle column, GSE38808) and TH1 versus naive CD4+ T cells (right column, E-MTAB-2582). Displayed genes were selected according to relevant pathways identified via gene ontology analysis and tabulated against respective functions (all p < 0.05). (E) Venn diagram showing the overlap between genes enriched in Thy1.1+ CD4+ T cells (A, D) and genes enriched in TH1-like CD4+ T cells (E-MTAB-2582). Data in (A–E) are shown as pooled analyses from a minimum of n = 5 mice per group representing three independent experiments. (F) Representative histograms (top) and summary bar graphs (bottom) showing the expression of IL-7R and TCF1/7 among Thy1.1+ CD4+ T cells (red) and Thy1.1 CD4+ T cells (blue). The fluorescence-minus-one control is shown in sky blue (top). Bottom: data are shown as mean ± standard error of the mean (SEM; n = 10 mice per group representing two independent experiments). ****p < 0.0001 (Mann–Whitney U test). (G) Representative flow cytometry plots showing the expression of CD39 and TIM-3 among Thy1.1+ CD4+ T cells (red) and Thy1.1 CD4+ T cells (blue). Data are shown as pooled analyses from a minimum of n = 10 mice per group representing two independent experiments.
Figure 1—figure supplement 1.
Figure 1—figure supplement 1.. Characterization of CD4+ T cells isolated from the salivary glands (SGs) after infection with murine cytomegalovirus (MCMV).
10BiT mice were infected with 3 × 10⁴ pfu of MCMV. Leukocytes were isolated from the SGs on day 14 p.i. (A) Flow cytometric gating strategy. Leukocytes were identified as CD4+ CD44+ CD62L CD90/90.1+ (Thy1.1+) or CD90/90.1 (Thy1.1) populations for downstream molecular analyses (ATAC-seq, RNA-seq, and TCR-seq). (B) Representative flow cytometry plots showing the expression of interleukin (IL)-10 versus Thy1.1 among CD4+ T cells cultured briefly ex vivo in the absence (left) or presence of phorbol myristate acetate (PMA) and ionomycin (right). (C) Principal component analysis (PCA) plots from (A) after RNA-seq analysis. (D) Gene expression levels identifying the location of gene clusters from the gene ontology analysis (Figure 1C). (E) Representative flow cytometry plot (left) and summary bar graphs (right) showing the expression of PD-1 and LAG-3 among CD4+ T cells expressing interferon (IFN)γ after stimulation with PMA and ionomycin. Data are shown as mean ± standard error of the mean (SEM; n = 5 mice per group representing two independent experiments). **p < 0.01 (Mann–Whitney U test). (F) Summary bar graph showing the expression of TIM-3, TIGIT, LAG-3, and PD-1 among Thy1.1+ CD4+ T cells (red) and Thy1.1 CD4+ T cells (blue) measured via flow cytometry. Data are shown as mean ± SEM (n = 6–9 mice per group representing two independent experiments). **p < 0.01, ****p < 0.0001 (Mann–Whitney U test).
Figure 2.
Figure 2.. Interleukin (IL)-10-producing CD4+ T cells exhibit prominent clonal structures.
10BiT mice were infected with 3 × 10⁴ pfu of murine cytomegalovirus (MCMV). Leukocytes were isolated from the salivary glands (SGs) on day 14 p.i. and sorted as CD4+ CD44+ CD62L CD90/90.1+ (Thy1.1+) or CD90/90.1 (Thy1.1) populations via fluorescence-activated cell sorting (FACS). (A) Clonality and (B) diversity metrics calculated for the T cell receptor (TCR)α (top) and TCRβ repertoires (bottom) derived from Thy1.1+ CD4+ T cells and Thy1.1 CD4+ T cells. (C) TCR convergence measured as the average number of nucleotide sequences encoding amino acid-identical complementarity-determining region (CDR)3α (top) and CDR3β loops (bottom) across the 2000 most prevalent clonotypes. (A–C) p values were calculated using a paired t-test with Benjamini–Hochberg correction. ns, not significant. (D) Hierarchical clustering of Trbv gene use weighted by clonotype frequency. (E–G) Cluster analysis of the 500 most prevalent TCRβ clonotypes using the tcrgrapher pipeline. (E) The cumulative frequency of tcrgrapher hits per sample is shown in gray. The frequency of each cluster comprising at least two tcrgrapher hits was calculated for each sample and averaged across all six repertoires. The five most prevalent clusters are shown in color. (F) Amino acid logos for each of the five most prevalent clusters. (G) Visual representation of clusters comprising at least two tcrgrapher hits. Nodes represent unique amino acid sequences. Edges connect sequences with a single amino acid mismatch. Amino acid sequences present only in Thy1.1+ CD4+ T cells are shown in red, amino acid sequences present only in Thy1.1 CD4+ T cells are shown in blue, and amino acid sequences present in both Thy1.1+ CD4+ T cells and Thy1.1 CD4+ T cells are shown in gray. Data are shown as pooled analyses from n = 4 mice per group representing three independent experiments (groups 1–3).
Figure 2—figure supplement 1.
Figure 2—figure supplement 1.. Analysis of repertoire diversity and overlap and the physicochemical properties of T cell receptors (TCRs).
(A) Visual representation of repertoire diversity. The inner rings indicate the frequencies of clonotypes sampled once, twice, or more often. The middle rings indicate the 20th, 40th, 60th, 80th, and 100th percentiles (Q1–Q5, respectively). The outer rings indicate the frequencies of the top five most abundant clonotypes with corresponding sequence information. Left: TCRβ. Right: TCRα. (B) F2 overlap metrics for the 2000 most prevalent clonotypes showing pairwise calculations to estimate the sharing of amino acid sequences with identical V genes. Left: TCRβ. Right: TCRα. (C) Mean physicochemical properties of the central five amino acids in the complementarity-determining region (CDR)3β (top) and CDR3α loops (bottom) weighted by clonotype frequency. Right: averaged and weighted nucleotide lengths for CDR3β (top) and CDR3α (bottom). Significance was evaluated using a paired t-test with Benjamini–Hochberg correction. ns, not significant.
Figure 3.
Figure 3.. Interleukin (IL)-10-producing CD4+ T cells are enriched for expression of arginase-1 (Arg1).
(A) Expression of Arg1 among leukocytes isolated via magnetic separation from the salivary glands (SGs) and spleens of Cd4+/+Arg1flox/flox or Cd4Cre/+Arg1flox/flox mice on day 14 p.i. detected by Western blot. (B, C) 10BiT mice were infected with 3 × 10⁴ pfu of murine cytomegalovirus (MCMV). (B) Leukocytes were isolated from the SGs on day 14 p.i. and sorted as CD4+ CD44+ CD62L CD90/90.1+ (Thy1.1+) or CD90/90.1 (Thy1.1) populations via fluorescence-activated cell sorting (FACS). ATAC-seq profiles show accessible chromatin regions in the Arg1 gene for Thy1.1+ CD4+ T cells (red) and Thy1.1 CD4+ T cells (blue). Data are shown as normalized values accounting for the total number of reads per lane. The black box indicates a major difference in chromatin accessibility. Black arrows indicate binding motifs for Tbx21. Data are shown as pooled analyses from a minimum of n = 5 mice per group representing three independent experiments. (C) Representative flow cytometry plots showing the expression of Arg1 versus Thy1.1 among CD4+ T cells isolated from the SGs and spleens on day 14 p.i. (A, C) Data are shown as pooled analyses from a minimum of n = 7 mice per group representing three independent experiments. (D) Representative flow cytometry plots showing the expression of Arg1 versus IL-10 among OT-II-specific CD4+ T cells generated in vitro in the absence or presence of IL-12 (3 ng/ml) ± OVA323–339 for 7 days and then stimulated with anti-CD3/CD28 for 4 hr. (E) Summary bar graph showing Arg1 protein concentrations in culture supernatants from (D) after stimulation with anti-CD3/CD28 for 48 hr. Up arrows indicate the higher concentration of OVA323–339 (0.5 μM), and down arrows indicate the lower concentration of OVA323–339 (0.01 μM). Data are shown as mean ± standard error of the mean (SEM).
Figure 3—figure supplement 1.
Figure 3—figure supplement 1.. T cell-specific deletion of arginase-1 (Arg1) does not impact the function or phenotype of T cells in naive mice.
(A) Cd4+/+Arg1flox/flox and Cd4Cre/+Arg1flox/flox mice were infected with 3 × 10⁴ pfu of murine cytomegalovirus (MCMV). Leukocytes were isolated from the salivary glands (SGs) on day 14 p.i. Representative flow cytometry plots show the expression of CD8 versus Arg1 (top) and NKT1.1 versus Arg1 (bottom). (B) C57BL/6 mice were infected with 3 × 10⁴ pfu of MCMV. Isotype control, anti-CD4, anti-CD8, or anti-CD4 and anti-CD8 antibodies were administered on days 6 and 8 p.i. SG homogenates were prepared on day 14 p.i. Arg1 protein concentrations were measured via ELISA. Data are shown as mean ± standard error of the mean (SEM; n = 5–12 mice per group representing one independent experiment). Significance was evaluated using the Mann–Whitney U test. (C, D) Splenocytes were harvested from naive Cd4+/+Arg1flox/flox and Cd4Cre/+Arg1flox/flox mice. (C) Summary bar graph showing the overall frequencies of naive, central memory (CM), and effector memory (EM) CD4+ T cells. Data are shown as mean ± SEM (n = 3–4 mice per group representing two independent experiments). (D) Summary bar graph showing the expression of interferon (IFN)γ among CD4+ T cells after ex vivo stimulation with PMA and ionomycin. Data are shown as mean ± SEM (n = 5 mice per group representing two independent experiments).
Figure 4.
Figure 4.. CD4+ T cells promote viral persistence via expression of arginase-1 (Arg1).
Cd4+/+Arg1flox/flox and Cd4Cre/+Arg1flox/flox mice were infected with 3 × 10⁴ pfu of murine cytomegalovirus (MCMV). (A) MCMV-specific CD4+ T cell responses in the salivary glands (SGs) on days 7 and 14 p.i. measured using flow cytometry to detect interferon (IFN)γ. Immunodominant peptides were pooled for stimulation. Data are shown as mean ± standard error of the mean (SEM; n = 4–6 mice per group representing three independent experiments). (B) Expression of Ki-67 among CD4+ T cells isolated from the SGs on day 14 p.i. measured via flow cytometry. Data are shown as mean ± SEM (n = 4–5 mice per group representing two independent experiments). (C) MCMV tetramer+ CD8+ T cells quantified in spleens on day 30 p.i. via flow cytometry. Data are shown as mean ± SEM (n = 4 mice per group representing two independent experiments). (D) MCMV-specific CD4+ T cell responses in the SGs on days 7 and 14 p.i. measured using flow cytometry to detect interleukin (IL)-10. Immunodominant peptides were pooled for stimulation. Data are shown as mean ± SEM (n = 8–10 mice per group representing two independent experiments). (A–D) *p < 0.05 (Mann–Whitney U test). (E) Viral genomes in saliva on days 7, 14, 21, and 28 p.i. measured via qPCR. Data are shown as mean ± SEM (n = 8 mice per group representing two independent experiments). *p < 0.05 (Mann–Whitney U test). (F) MCMV replication in SG homogenates on day 30 p.i. measured via plaque assay. Data are shown as individual points with median values (n = 6–7 mice per group representing two or three independent experiments). **p < 0.01 (Mann–Whitney U test).
Figure 4—figure supplement 1.
Figure 4—figure supplement 1.. Arginase-1 (Arg1) expression in myeloid cells does not impact the replication of murine cytomegalovirus (MCMV).
(A) Cd4Cre/+Arg1flox/flox and Cd4Cre/+ mice were infected with 3 × 10⁴ pfu of MCMV. (B, C) Lyz2+/+Arg1flox/flox and Lyz2Cre/+Arg1flox/flox mice were infected with 3 × 10⁴ pfu of MCMV. (D) Cd4+/+Arg1flox/flox and Cd4Cre/+Arg1flox/flox mice were infected with 3 × 10⁴ pfu of MCMV. (A) MCMV replication in salivary gland (SG) homogenates on day 14 p.i. measured via plaque assay. Data are shown as individual points with median values (n = 6 mice per group representing one independent experiment). (B) MCMV replication in SG homogenates on day 28 p.i. measured via plaque assay. Data are shown as individual points with median values (n = 3–4 mice per group representing two independent experiments). (C) Viral genomes in saliva on days 14, 21, and 28 p.i. measured via qPCR. Data are shown as individual points with median values (n = 3–4 mice per group representing two independent experiments). (D) Cardiac punctures were performed on day 30 p.i. Anti-SSA IgG titers were measured in plasma samples via ELISA. Data are shown as mean ± standard error of the mean (SEM; n=10 mice per group representing two independent experiments).
Figure 5.
Figure 5.. Interleukin (IL)-10-producing CD4+ T cells express T-bet and T-bet-inducible genes.
(A, B) 10BiT mice were infected with 3 × 10⁴ pfu of murine cytomegalovirus (MCMV). (A) Leukocytes were isolated from the salivary glands (SGs) on day 14 p.i. Representative histograms (left) and summary bar graph (right) show the expression of T-bet among Thy1.1+ CD4+ T cells (red) and Thy1.1 CD4+ T cells (blue). Data are shown as mean ± standard error of the mean (SEM; n = 5–6 mice per group pooled from two independent experiments). MFI, median fluorescence intensity. **p < 0.01 (Mann–Whitney U test). (B) Leukocytes were isolated from the SGs on day 14 p.i. and sorted as CD4+ CD44+ CD62L CD90/90.1+ (Thy1.1+) or CD90/90.1 (Thy1.1) populations via fluorescence-activated cell sorting (FACS). ATAC-seq profiles show accessible chromatin regions in the Tbx21 gene for Thy1.1+ CD4+ T cells (red) and Thy1.1 CD4+ T cells (blue). Data are shown as normalized values accounting for the total number of reads per lane. The black boxes indicate major differences in chromatin accessibility. Data are shown as pooled analyses from a minimum of n = 5 mice per group representing three independent experiments. (C) Venn diagram showing the overlap between genes enriched in Thy1.1+ CD4+ T cells (A, D) and genes enriched in T-bet+ CD4+ T cells (GSE38808). (D) Cd4+/+Tbx21flox/flox (Cd4+/+) and Cd4CreERT2/+Tbx21flox/flox (Cd4Cre/+) mice were infected with 3 × 10⁴ pfu of MCMV. Tamoxifen was administered (+Tam) or withheld (−Tam) from days 7 to 12 p.i. Leukocytes were isolated from the SGs on day 14 p.i. Representative flow cytometry plots show the expression of CD4 versus RFP (left) and CD44 versus T-bet for the gated populations (right). Data in the bar graph are shown as mean ± SEM (n = 4–5 mice per group representing four or five independent experiments). *p < 0.05, **p < 0.01 (Mann–Whitney U test).
Figure 5—figure supplement 1.
Figure 5—figure supplement 1.. Interleukin (IL)-10-producing CD4+ T cells are not selectively regulated by Eomes.
Representative flow cytometry plots (A) and histograms (B) showing the expression of Eomes versus Thy1.1. (C, D) Cd4+/+Tbx21flox/flox and Cd4CreERT2/+Tbx21flox/flox mice were infected with 3 × 10⁴ pfu of murine cytomegalovirus (MCMV). Tamoxifen was administered (+Tam) or withheld (−Tam) from days 7 to 12 p.i. (C) Leukocytes were isolated from the salivary glands (SGs) on day 14 p.i. The expression of T-bet was measured via flow cytometry. Data are shown as mean ± standard error of the mean (SEM; n = 4–5 mice per group representing four or five independent experiments). MFI, median fluorescence intensity. **p < 0.01 (Mann–Whitney U test). (D) MCMV replication in SG homogenates on day 28 p.i. measured via plaque assay. Data are shown as individual points with median values (n = 5 mice per group representing three independent experiments).
Figure 6.
Figure 6.. Interleukin (IL)-10-producing CD4+ T cells develop in a T-bet-dependent manner.
(A–J) Cd4+/+Tbx21flox/flox (Cd4+/+) and Cd4CreERT2/+Tbx21flox/flox (Cd4Cre/+) mice were infected with 3 × 10⁴ pfu of murine cytomegalovirus (MCMV). Tamoxifen was administered (+Tam) or withheld (−Tam) from days 7 to 12 p.i. Leukocytes were isolated from the salivary glands (SGs) on day 14 p.i. (A) MCMV-specific CD4+ T cell responses in the SGs measured using flow cytometry to detect IL-10. Immunodominant peptides were pooled for stimulation. Data are shown as mean ± standard error of the mean (SEM; n = 4–5 mice per group representing two independent experiments). **p < 0.01 (Mann–Whitney U test). Summary bar graph (B) and representative histograms (C) showing the expression of arginase-1 (Arg1) among CD4+ T cells measured via flow cytometry. Data are shown as mean ± SEM (n = 5 mice per group representing two independent experiments). ***p < 0.001 (Mann–Whitney U test). Summary bar graphs (left) and representative histograms (right) showing the expression of CD44 (D), PD-1 (E), CD62L (F), and IL-7R (G) among CD4+ T cells measured via flow cytometry. Data in (D–F) are shown as mean ± SEM (n = 5 mice per group representing two independent experiments). Data in (G) are shown as mean ± SEM (n = 3–4 mice per group representing two independent experiments). *p < 0.05, **p < 0.01 (Mann–Whitney U test). (H) MCMV-specific CD4+ T cell responses in the SGs measured using flow cytometry to detect interferon (IFN)γ. Immunodominant peptides were pooled for stimulation. Data are shown as mean ± SEM (n = 4–5 mice per group representing two independent experiments). *p < 0.05 (Mann–Whitney U test). (I) MCMV replication in SG homogenates on day 14 p.i. measured via plaque assay. Data are shown as individual points with median values (n = 10–14 mice per group pooled from three independent experiments). **p < 0.01 (Mann–Whitney U test). (J) Viral genomes in saliva on days 7, 14, 21, and 28 p.i. measured via qPCR. Data are shown as mean ± SEM (n = 5 mice per group representing two independent experiments). **p < 0.01 (Mann–Whitney U test). Data in (A–I) show all groups after the administration of tamoxifen.
Author response image 1.
Author response image 1.. Granzyme B protein expression by salivary gland CD44 is not detectable by flow cytometry.
Granzyme B and Thy1.1 expression by salivary gland CD4 T cells was assessed by flow cytometry 14 days after MCMV infection of 10-Bit mice.
Author response image 2.
Author response image 3.
Author response image 3.. Eomes expression by Thy1.
1+ and Thy1.1- CD4+ T cells 14 days post-MCMV infection.

Update of

References

    1. Anderson CF, Oukka M, Kuchroo VJ, Sacks D. CD4+CD25−Foxp3− Th1 cells are the source of IL-10-mediated immune suppression in chronic cutaneous leishmaniasis. Journal of Experimental Medicine. 2007;204:285–297. doi: 10.1084/jem.20061886. - DOI - PMC - PubMed
    1. Apetoh L, Quintana FJ, Pot C, Joller N, Xiao S, Kumar D, Burns EJ, Sherr DH, Weiner HL, Kuchroo VK. The aryl hydrocarbon receptor interacts with c-Maf to promote the differentiation of type 1 regulatory T cells induced by IL-27. Nature Immunology. 2010;11:854–861. doi: 10.1038/ni.1912. - DOI - PMC - PubMed
    1. Awasthi A, Carrier Y, Peron JPS, Bettelli E, Kamanaka M, Flavell RA, Kuchroo VK, Oukka M, Weiner HL. A dominant function for interleukin 27 in generating interleukin 10-producing anti-inflammatory T cells. Nature Immunology. 2007;8:1380–1389. doi: 10.1038/ni1541. - DOI - PubMed
    1. Bailey TL, Johnson J, Grant CE, Noble WS. The MEME suite. Nucleic Acids Research. 2015;43:W39–W49. doi: 10.1093/nar/gkv416. - DOI - PMC - PubMed
    1. Barnett DW, Garrison EK, Quinlan AR, Strömberg MP, Marth GT. Bamtools: a C++ API and toolkit for analyzing and managing BAM files. Bioinformatics. 2011;27:1691–1692. doi: 10.1093/bioinformatics/btr174. - DOI - PMC - PubMed

Publication types