. 2023 Jul 25;42(7):112780.
doi: 10.1016/j.celrep.2023.112780. Epub 2023 Jul 12.

Tracking B cell responses to the SARS-CoV-2 mRNA-1273 vaccine

Affiliations

Tracking B cell responses to the SARS-CoV-2 mRNA-1273 vaccine

Felipe Lopes de Assis et al. Cell Rep. .

Abstract

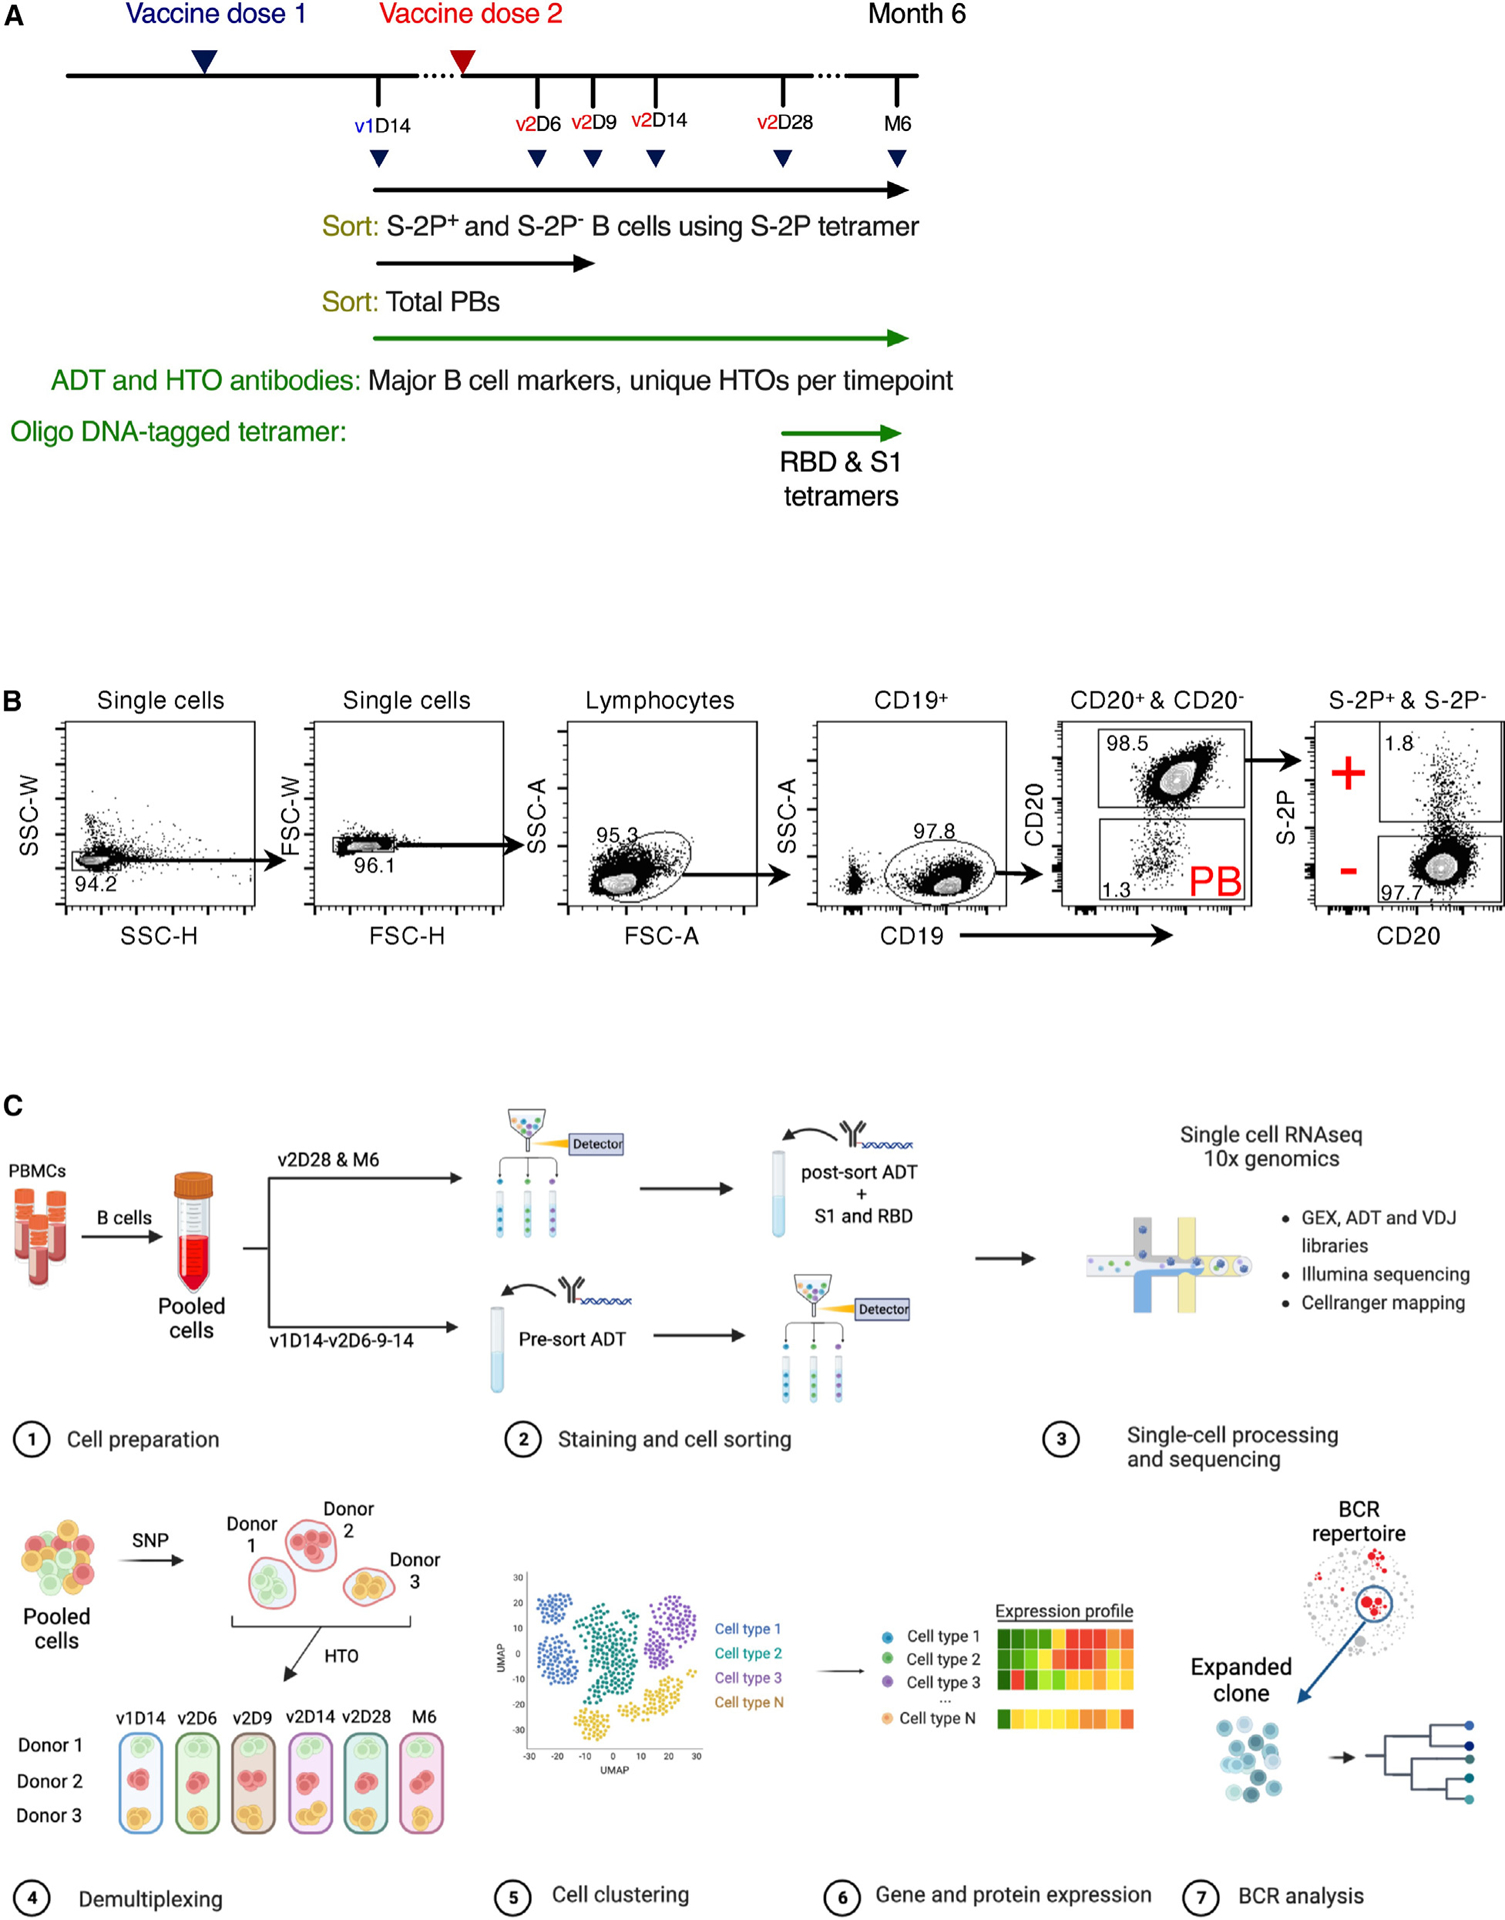
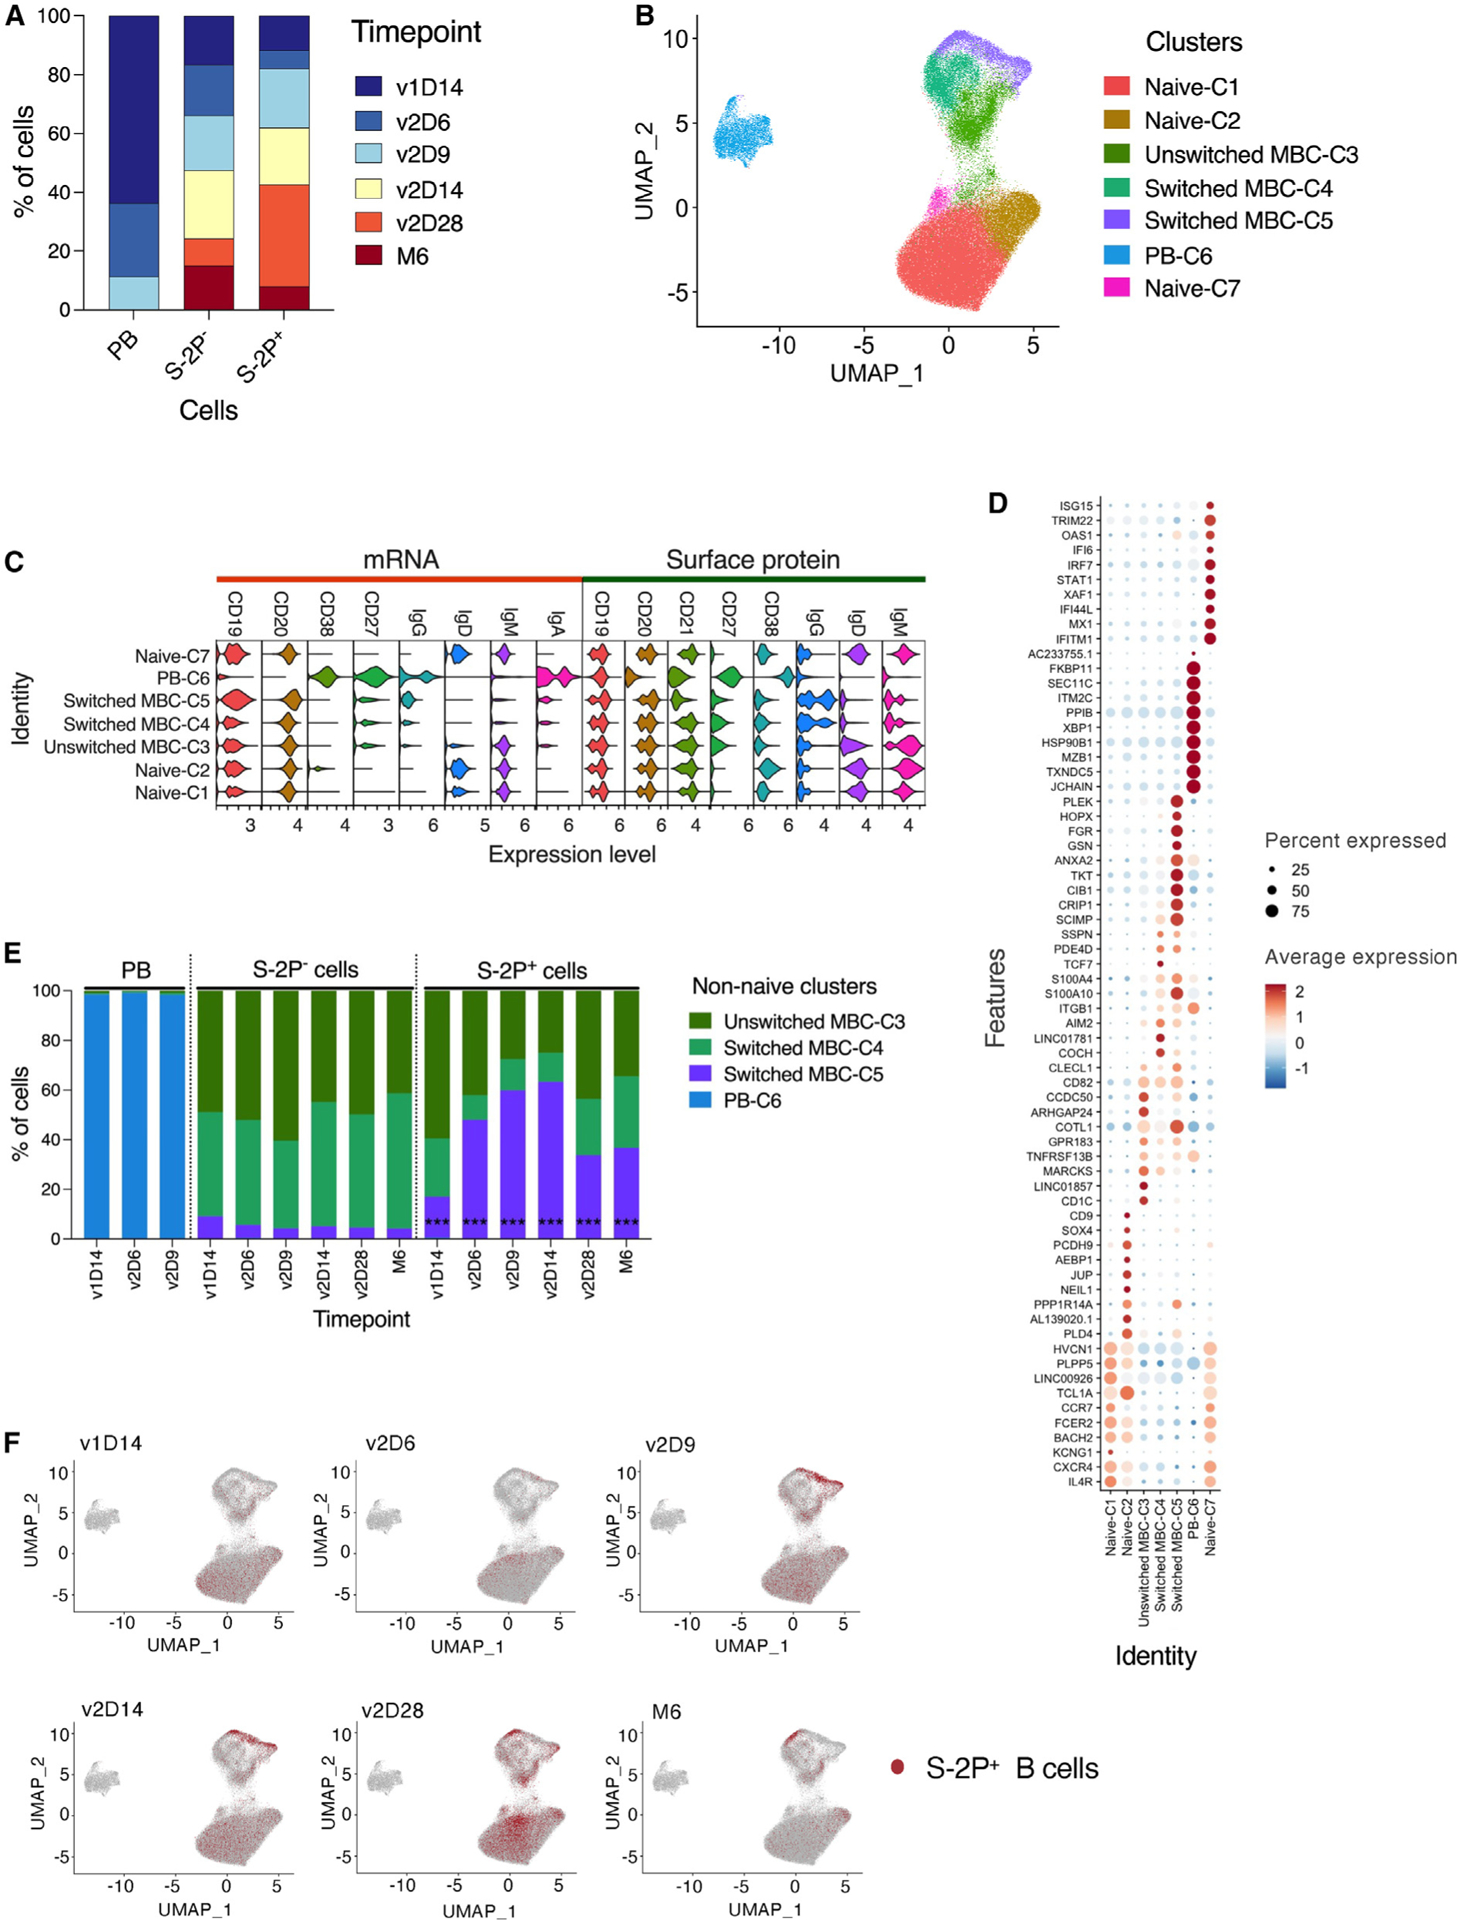
Protective immunity following vaccination is sustained by long-lived antibody-secreting cells and resting memory B cells (MBCs). Responses to two-dose SARS-CoV-2 mRNA-1273 vaccination are evaluated longitudinally by multimodal single-cell analysis in three infection-naïve individuals. Integrated surface protein, transcriptomics, and B cell receptor (BCR) repertoire analysis of sorted plasmablasts and spike+ (S-2P+) and S-2P- B cells reveal clonal expansion and accumulating mutations among S-2P+ cells. These cells are enriched in a cluster of immunoglobulin G-expressing MBCs and evolve along a bifurcated trajectory rooted in CXCR3+ MBCs. One branch leads to CD11c+ atypical MBCs while the other develops from CD71+ activated precursors to resting MBCs, the dominant population at month 6. Among 12 evolving S-2P+ clones, several are populated with plasmablasts at early timepoints as well as CD71+ activated and resting MBCs at later timepoints, and display intra- and/or inter-cohort BCR convergence. These relationships suggest a coordinated and predictable evolution of SARS-CoV-2 vaccine-generated MBCs.

Keywords: B cells; BCR repertoire; CP: Immunology; SARS-CoV-2; immunological memory; mRNA vaccine; single-cell profiling.


Conflict of interest statement

Declaration of interests S.H.K. receives consulting fees from Peraton. K.B.H. receives consulting fees from Prellis Biologics.

Figures

Figure 1.
Figure 1.. Study design
(A) Graphical depiction of blood draws, cell sorting, and ADT staining for SARS-CoV-2-uninfected vaccinees (n = 3) after receiving the two-dose mRNA-1273 vaccine. See also Table S1. (B) B cell gating strategy for sorting PBs (CD19+CD20), CD20+ S-2P (−), and S-2P+ (+) B cells. (C) Workflow for single-cell analyses showing steps from sample processing through data analysis.
Figure 2.
Figure 2.. Single-cell analyses of sorted populations show distinct clusters and enrichment of S-2P+ cells
(A) Bar graphs showing each time point contribution to the three sorted populations. See also Table S3. (B) UMAP showing unsupervised clustering of 109,225 B cells (integrated dataset) using gene expression data. See also Figure S1A. (C) Violin plots showing mRNA and surface protein (ADT) expression of canonical B cell markers and Ig isotypes for each cluster. The x axis shows the globalscaled and log-normalized gene expression value obtained using the function “NormalizedData” from the Seurat R package. (D) Dot plots showing the top-10 differentially expressed genes ordered by average log2 fold change for each cell cluster. Color intensity indicates average expression, whereas dot size denotes the percentage of cells expressing the gene. (E) Bar graphs showing contribution of non-naïve B cell clusters to each time point for the three sorted populations. The cell populations are indicated at the top of the bars. The p values shown reflect enrichment of MBC-C5 among S-2P+ versus S-2P cells at each time point. Differences were evaluated by chi-square test. ***p ≤ 0.001. See also Figure S1B. (F) UMAP showing kinetics of S-2P+ cell distribution among all clusters. Red dots represent S-2P+ cells at each time point and gray areas represent all other cells.
Figure 3.
Figure 3.. Single-cell analyses within MBC-C5 show distinct subclusters and enrichment of S-2P+ cells
(A) UMAP (left) showing unsupervised re-clustering of 6,524 cells from cluster MBC-C5 in Figure 2B using gene expression data and bar graphs showing contribution of each subcluster at each time point. See also Figure S1C. (B) Heatmap showing the top-10 differentially expressed genes for each subcluster. Red asterisks show genes associated with atypical MBCs. (C) Violin plots showing mRNA and surface protein (ADT) expression of B cell markers and Ig isotypes for each cluster. The x axis shows the global-scaled and lognormalized gene expression value obtained using the function “NormalizedData” from the Seurat R package. (D) UMAP showing kinetics of S-2P+ cell distribution among MBC-C5 subclusters. Red dots represent S-2P+ cells at each time point and gray areas represent all other cells. See also Table S3. (E) UMAP showing the distribution of S1+ (top) and RBD+ (bottom) cells among MBC-C5 subclusters at v2D28 (red) and M6 (blue) timepoints. (F) UMAP showing the single-cell trajectories inferred by Monocle3 within MBC-C5. Mixed MBC-SC5.1 was used as the root node based on kinetics depicted in Figure 3D. The encircled number denotes the positioning of the root node. The lines represent the principal graph generated by Monocle3 and the cells are colored according to relative pseudotime.
Figure 4.
Figure 4.. BCR repertoire and clonal overlap are distinct for S-2P+ cells
(A) Venn diagram showing clonal distribution of expanded clones among cell types. The number of unique and shared clones is indicated. See also Figure S2. (B) Clonal diversity of S-2P+ and S-2P B cells within each participant over time. Clonal diversity is quantified as diversity order q = 2 (inverse Simpson’s index). Points show the mean of 500 resampling repetitions, error bars show 95% confidence intervals. Clones were classified as S-2P+ if they contained at least one S-2P+ cell. Only non-naı¨ve S-2P+ and S-2P sorted B cells were included in this analysis. (C) Heatmap showing overlap of S-2P+ (lower triangle) and S-2P (upper triangle) clones across timepoints. Color intensity indicates overlap strength as measured by the Jaccard index. Only non-naïve S-2P+ and S-2P sorted B cells were included in this analysis. (D) Mean SHM frequency among clones sampled at M6 versus earlier timepoints. Each point represents the mean SHM frequency of all heavy chain sequences comprising a clone sampled within the specified time period. Lines connect clones across time periods. p values were calculated using a paired Wilcoxon test, and numbers in parentheses indicate number of clones tested. See also Figure S3.
Figure 5.
Figure 5.. Tracking of B cell responses shows relationships between MBCs and PBs
(A) Heatmap showing overlap of S-2P+ (lower triangle) and S-2P (upper triangle) clones across cell type clusters. Color intensity indicates overlap strength as measured by the Jaccard index. (B) Three largest lineage trees from S-2P+ clones containing resting MBC-SC5.2 clones at M6. SP tests showing enrichment of (C) switches from cell types to resting MBC-SC5.2 at all timepoints, and (D) switches from earlier timepoints to resting MBC-SC5.2 at M6 within B cell trees. Cells are shaded per SP test p value. Comparisons with p < 0.05 are marked with an X.
Figure 6.
Figure 6.. Intra- and inter-cohort convergence of S-2P+ clones mainly enriched in MBC-C5
(A) Proportion of cell types among S-2P+ B cells within BCR sequence clusters convergent across multiple participants, compared with S-2P+ B cells in clusters found in only one participant. Cluster 5 subclusters are arranged at the bottom of each barplot. (B) IGHV gene usage among convergent clusters. Colored bars indicate whether the sequence cluster was found in multiple participants (convergent) or only one (not convergent). The frequency of IGHV genes in the SARS-CoV-2 antibody database, CoV-AbDab, is also shown. Only IGHV occupying at least 5% of any comparison group are shown. See also Figure S6. (C) Proportion of cell types among S-2P+ B cells with heavy chain BCR sequences similar to previously published SARS-CoV-2 antibodies (“public”), compared with S-2P+ B cells that did not match previously published antibodies. (D) Phylogenetic tree of a measurably evolving clone expressing similar BCR sequences in all three participants. Amino acid alignment of convergent IGHV sequences from participants, as well as sequences listed in the Cov-AbDab database. See also Table S5.

References

    1. Barouch DH (2022). Covid-19 vaccines - immunity, variants, boosters.N. Engl. J. Med 387, 1011–1020. 10.1056/NEJMra2206573. - DOI - PMC - PubMed
    1. Baden LR, El Sahly HM, Essink B, Kotloff K, Frey S, Novak R, Diemert D, Spector SA, Rouphael N, Creech CB, et al. (2021). Efficacy and Safety of the mRNA-1273 SARS-CoV-2 Vaccine. N. Engl. J. Med 384, 403–416. 10.1056/NEJMoa2035389. - DOI - PMC - PubMed
    1. Thomas SJ, Moreira ED Jr., Kitchin N, Absalon J, Gurtman A, Lockhart S, Perez JL, Pérez Marc G, Polack FP, Zerbini C, et al. (2021). Safety and efficacy of the BNT162b2 mRNA Covid-19 vaccine through 6 months. N. Engl. J. Med 385, 1761–1773. 10.1056/NEJMoa2110345. - DOI - PMC - PubMed
    1. DeWolf S, Laracy JC, Perales MA, Kamboj M, van den Brink MRM, and Vardhana S (2022). SARS-CoV-2 in immunocompromised individuals. Immunity 55, 1779–1798. 10.1016/j.immuni.2022.09.006. - DOI - PMC - PubMed
    1. Chemaitelly H, Tang P, Hasan MR, AlMukdad S, Yassine HM, Benslimane FM, Al Khatib HA, Coyle P, Ayoub HH, Al Kanaani Z, et al. (2021). Waning of BNT162b2 vaccine protection against SARS-CoV-2 infection in Qatar. N. Engl. J. Med 385, e83. 10.1056/NEJMoa2114114. - DOI - PMC - PubMed

Publication types