. 2023 Jul 5;40(7):msad159.
doi: 10.1093/molbev/msad159.

Likelihood-Based Tests of Species Tree Hypotheses

Affiliations

Likelihood-Based Tests of Species Tree Hypotheses

Richard Adams et al. Mol Biol Evol. .

Abstract

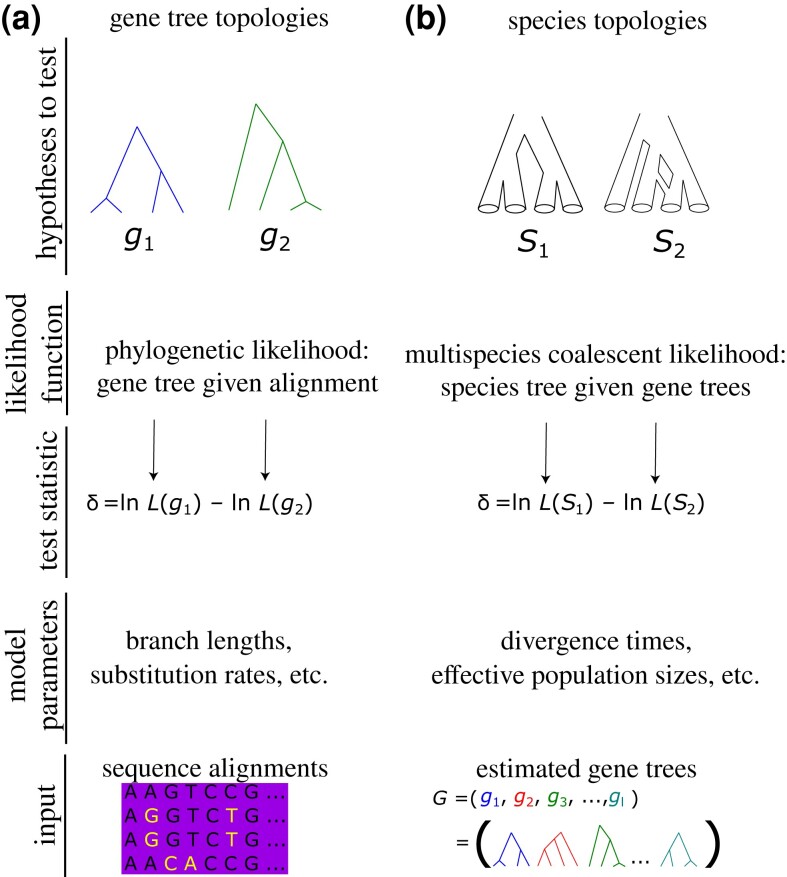
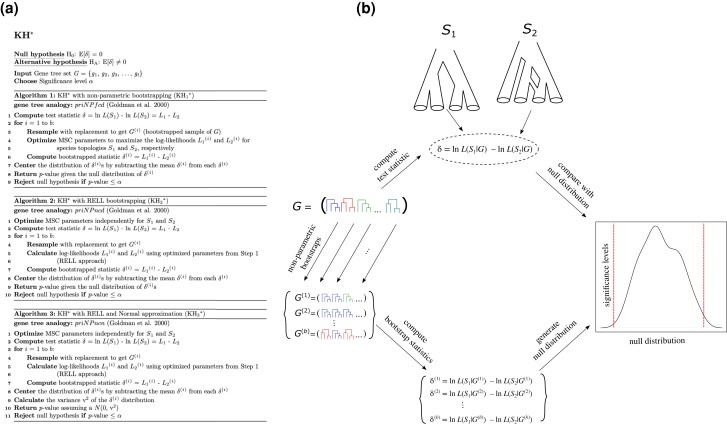
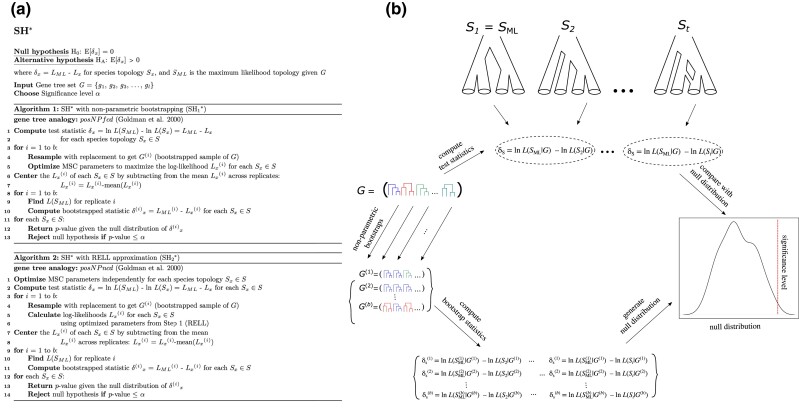
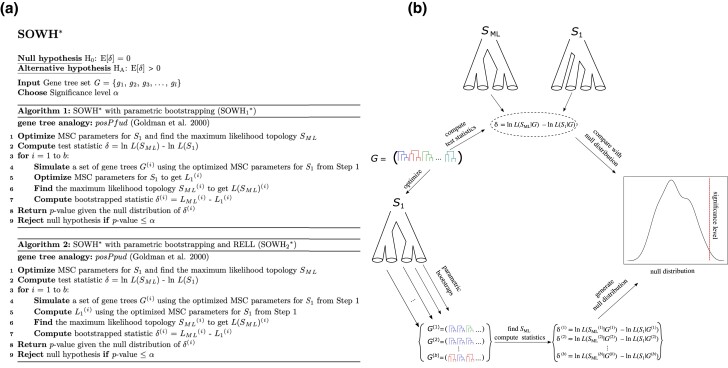
Likelihood-based tests of phylogenetic trees are a foundation of modern systematics. Over the past decade, an enormous wealth and diversity of model-based approaches have been developed for phylogenetic inference of both gene trees and species trees. However, while many techniques exist for conducting formal likelihood-based tests of gene trees, such frameworks are comparatively underdeveloped and underutilized for testing species tree hypotheses. To date, widely used tests of tree topology are designed to assess the fit of classical models of molecular sequence data and individual gene trees and thus are not readily applicable to the problem of species tree inference. To address this issue, we derive several analogous likelihood-based approaches for testing topologies using modern species tree models and heuristic algorithms that use gene tree topologies as input for maximum likelihood estimation under the multispecies coalescent. For the purpose of comparing support for species trees, these tests leverage the statistical procedures of their original gene tree-based counterparts that have an extended history for testing phylogenetic hypotheses at a single locus. We discuss and demonstrate a number of applications, limitations, and important considerations of these tests using simulated and empirical phylogenomic data sets that include both bifurcating topologies and reticulate network models of species relationships. Finally, we introduce the open-source R package SpeciesTopoTestR (SpeciesTopology Tests in R) that includes a suite of functions for conducting formal likelihood-based tests of species topologies given a set of input gene tree topologies.

Keywords: bootstrap; maximum likelihood; multispecies coalescent; phylogenetic networks; phylogenomics.


Figures

<sc>Fig.</sc> 1.
Fig. 1.
Comparing the components of classical likelihood-based tests of gene tree topologies (a) with the analogous tests of species topologies derived in this study (b). While topology is the primary focus of both tests (top row), a species tree hypothesis-testing framework (b) is concerned with the fit of species topologies (examples depicted by S1 and S2) to gene tree distributions (G shown in lower right) under the MSC model, rather than the fit of specific gene tree topologies (i.e., g1 and g2) to molecular sequence data (example alignment in lower left). The test statistics are computed by optimizing relevant model parameters according to either the standard phylogenetic likelihood function (a) or the MSC likelihood (b), respectively. Note that the example species topology S2 represents a hybridization network.
<sc>Fig.</sc> 2.
Fig. 2.
The KH* test for species tree hypotheses. Details for the three KH* algorithms (KH1*, KH2*, and KH3*) are provided in (a), and a general schematic overview of the KH* test is shown in (b). Briefly, the KH* test evaluates whether the difference in MSC likelihoods δ computed between two species topologies S1 and S2 (b, top) is a plausible draw from a null distribution obtained using nonparametric bootstrapping (b, right). Two example topologies are shown in (b): a classical bifurcating topology on the left (S1) and a species network on the right (S2). Nonparametric bootstrapping of the input gene tree set G is conducted to obtain b total replicate sets G(1), G(2), …, G(b) (b, left), which, in turn, yields a distribution of δ(1), δ(2), …, δ(b) (b, bottom) under the null hypothesis. The primary difference between the three KH* algorithms is whether RELL bootstrapping is used (KH2* and KH3*) or not (KH1*), while KH3* also uses normal approximation to evaluate significance. See table 1 for a description of gene tree analog acronyms priNPfcd, priNPncd, and priNPncn.
<sc>Fig.</sc> 3.
Fig. 3.
The SH* test for species tree hypotheses. Details for the two algorithms (SH1* and SH2*) are provided in (a), and a general schematic overview of the SH* test is shown in (b). Briefly, the SH* test evaluates whether the difference in MSC likelihoods δ computed between two or more species topologies S1,S2,,St (b, top) included in a set of t topologies is a plausible draw from a null distribution obtained using nonparametric bootstrapping. Specifically, the difference in MSC likelihood is computed between the species topology in the set with ML (SML) and each of the other t1 topologies. Several example topologies include two classical bifurcating trees on the left (S1 and S2) and a species network on the right (St). In this schematic, the first topology S1 also happens to be SML. Nonparametric bootstrapping of the input gene tree set G is conducted to obtain b total replicates G(1), G(2), …, G(b) (b, left), yielding a distribution of δ(1), δ(2), …, δ(b) (b, bottom) under the null hypothesis. As with KH*, the two SH* algorithms differ on whether RELL bootstrapping is used (SH2*) or not (SH1*). See table 1 for a description of gene tree analog acronyms posNPfcd and posNPncd.
<sc>Fig.</sc> 4.
Fig. 4.
The SOWH* test for species tree hypotheses. Details for the two SOWH* algorithms (SOWH1* and SOWH2*) are provided in (a), and a general schematic overview of the SOWH* test is shown in panel (b). Briefly, the SOWH* test evaluates whether the difference in MSC likelihoods δ computed between a hypothesized target species topology (S1; b, top) and the ML estimate (SML; b, top) is a plausible draw from a null distribution obtained using parametric bootstrapping (b, right). Parametric bootstrapping is conducted using the optimized branch lengths of S1 (b, left) to obtain b total replicates G(1), G(2), …, G(b) (b, bottom left) that are used to find a ML topology for each replicate which, in turn, yields a distribution of δ(1), δ(2), …, δ(b) (b, bottom right) under the null hypothesis. Each round of parametric bootstrapping is followed by a search for a ML topology that is used to compare with the target topology S1 at their optimized parameter values (branch lengths) to compute the values of δ(i). As with KH* and SH*, the two SOWH* algorithms differ on whether RELL bootstrapping is used (SOWH2*) or not (SOWH1*) in the processes of generating the null distribution of δS. See table 1 for a description of gene tree analog acronyms posPfud and posPpud.
<sc>Fig.</sc> 5.
Fig. 5.
Demonstrating the KH* test across an array of simulation scenarios for evaluating bifurcating topologies (left and center panels) and a species network (right panels). Heatmaps depict the mean P value obtained across 100 replicate analyses for each combination of simulation conditions (darker to lighter colors represent higher to lower P values), and the two topologies that are tested are shown above each respective heatmap. The data set sizes (i.e., number of input gene trees l) are represented on the y-axes, whereas the x-axes depict the scaling of different evolutionary parameters used in the simulations. For each set of conditions, gene trees were simulated using the left, “true” (generating) species topology shown above each respective set of analyses, with the alternative topology shown to the right in blue, and either the divergence times scaled by multiplying branches by a scaling factor γ[0.1,2] (all branches multiplied by the value of γ) for the left and center panels (a, b, d, and e) or by varying the migration fraction m[0,1] for the network shown in the right panels (c and f). The top panels (ac) were conducted using the true, simulated gene trees, while the results shown in the bottom panels (df) were analyzed using estimates of the gene trees.
<sc>Fig.</sc> 6.
Fig. 6.
Assessing the statistical performance of the KH* test across an array of simulation scenarios for evaluating true positives (blue trees and lines) and false positives (red lines) for bifurcating topologies (a, b, d, and e) and a species network (c and f). Results shown for tests of scenarios involving true positives (alternative topologies tested shown in dark blue) and false positive rates (red lines). For estimating power (blue lines), gene trees were simulated using the left, “true” (generating) species topology shown above each respective set of analyses, with the alternative topology shown to the right in blue above each set of analyses. False positive rates were estimated using randomly generated coalescent gene trees (red lines). Lines indicate the proportion of replicates with P ≤ 0.05, with colors ranging from light (l=10 gene trees) to dark (l=100 gene trees) in increments of 10 gene trees. Top panels (ac) show results when using the true, simulated gene trees, whereas estimated gene trees were used in the test results shown in the bottom panels (df). See figure 5 caption for additional information regarding the parameters γ and m.
<sc>Fig.</sc> 7.
Fig. 7.
Assessing the statistical performance of the SH* test across an array of simulation scenarios for evaluating true positives (blue trees and lines) as well as estimated false positive rates (red lines). Lines indicate the proportion of replicates with P ≤ 0.05, with colors ranging from light (l=10 gene trees) to dark (l=100 gene trees) in increments of 10 gene trees. Top panels (ac) show results when using the true, simulated gene trees, whereas estimated gene trees were used in the test results shown in the bottom panels (df). The third column shows the fraction of replicates with P ≤ 0.05 averaged across all 14 alternative rooted topologies for four-species trees. Generating species topology shown on the left, with the alternative topologies shown in blue. See figure 5 caption for additional information regarding the parameter γ.
<sc>Fig.</sc> 8.
Fig. 8.
Applying SH* to the avian phylogenomic data set. Boxplots summarizing the distribution of P values across 100 replicate analyses for each data set size obtained for 33 avian species topologies computed for different data set sizes (number of genes) and for different locus types: UCEs (left), exons (center), and introns (right). Tree labels in the upper right of each panel indicate the names of particular trees defined in Jarvis et al. (2014).
<sc>Fig.</sc> 9.
Fig. 9.
Investigating the statistical performance of the SOWH* test across an array of simulation scenarios for evaluating true positives (blue trees and lines) and false positives (red trees and lines). Lines indicate the proportion of replicates with P ≤ 0.05, with colors ranging from light blue (l=10 gene trees) to dark blue (l=100 gene trees) in increments of 10 gene trees. Results shown for the scenarios using the true, simulated gene trees (a and b), and the estimated gene trees (c and d). Generating species topologies shown in black to the left above each set of analyses, with the tested topologies shown in blue (i.e., true positives) or red (i.e., false positives). See figure 5 caption for additional information regarding the parameter γ.
<sc>Fig.</sc> 10.
Fig. 10.
Applying the SOWH* to three example test cases: Amphibians (left columns), Reptiles (center columns), and Neoaves (left columns). Violin plots depict the distribution of the test statistic δ(i) across b = 103 replicates for each pair of trees shown at the bottom. Stars indicate the value of the observed statistic, with colors of the stars indicating whether the result is statistically significant (red stars) or not (blue stars) given the null distribution (gray violin distributions). The top row of violin plots (ac) indicates the results obtained using the SOWH1* algorithm, while the bottom row (df) shows the results of the SOWH2* algorithm.
<sc>Fig.</sc> 11.
Fig. 11.
Estimated gene trees and statistical power of the SH* test. Results are shown for estimates of true positive rates (blue lines and trees) across a range of branch scaling values γ=[0.1,2] with gene trees estimated from simulated alignments comprising 100 bp (ac), 1 kb (df), and 10 kb (gi). Lines indicate the proportion of replicates with P ≤ 0.05, with colors ranging from light blue (l=10 gene trees) to dark blue (l=100 gene trees) in increments of 10 gene trees. The third column shows the fraction of replicates with P ≤ 0.05 averaged across all 14 alternative rooted topologies for four-species trees. See figure 5 caption for additional information regarding the parameter γ.
<sc>Fig.</sc> 12.
Fig. 12.
Evaluating the impact of gene tree estimation error on false positive rates of the SH* test. Results are shown for false positive rates estimated using randomly generated gene trees of uniform probability (i.e., no species tree was used) for both the SH1* (left) and SH2* (right) algorithms across increasing numbers of input gene trees (left to right; 10–100 gene trees) and different locus lengths (points; from 100 bp to 10 kb), with red circles indicating the use of the true, simulated gene trees.
<sc>Fig.</sc> 13.
Fig. 13.
Exploring the impact of recombination on the statistical performance of the KH* test. Results are shown for the mean P value across replicates (a) and proportion of replicates with P ≤ 0.05 (b). For each set of conditions, gene trees within a recombining locus were simulated using the “true” (generating) species topology shown to the right in black, with the alternative topology shown in blue. Divergence times for the true topology were scaled by multiplying branches by a scaling factor γ[0.1,2]. See Materials and Methods for our simulation protocol.

Similar articles

Cited by

References

    1. Adams RH, Castoe TA. 2019. Statistical binning leads to profound model violation due to gene tree error incurred by trying to avoid gene tree error. Mol Phyl Evol. 134:164–171. - PubMed
    1. Adams RH, Castoe TA, DeGiorgio M. 2021. PhyloWGA: chromosome-aware phylogenetic interrogation of whole genome alignments. Bioinformatics 37:1923–1925. - PMC - PubMed
    1. Adams RH, Schield DR, Card DC, Castoe TA. 2018. Assessing the impacts of positive selection on coalescent-based species tree estimation and species delimitation. Syst Biol. 67:1076–1090. - PubMed
    1. Anisimova M, Gascuel O. 2006. Approximate likelihood-ratio test for branches: a fast, accurate, and powerful alternative. Syst Biol. 55:539–552. - PubMed
    1. Ayala FJ. 2009. Darwin and the scientific method. Proc Natl Acad Sci U S A. 106 Suppl 1(Suppl 1):10033–10039. - PMC - PubMed

Publication types