. 2023 Jul 14;381(6654):231-239.
doi: 10.1126/science.abq3061. Epub 2023 Jul 13.

Recruited macrophages elicit atrial fibrillation

Affiliations

Recruited macrophages elicit atrial fibrillation

Maarten Hulsmans et al. Science. .

Abstract

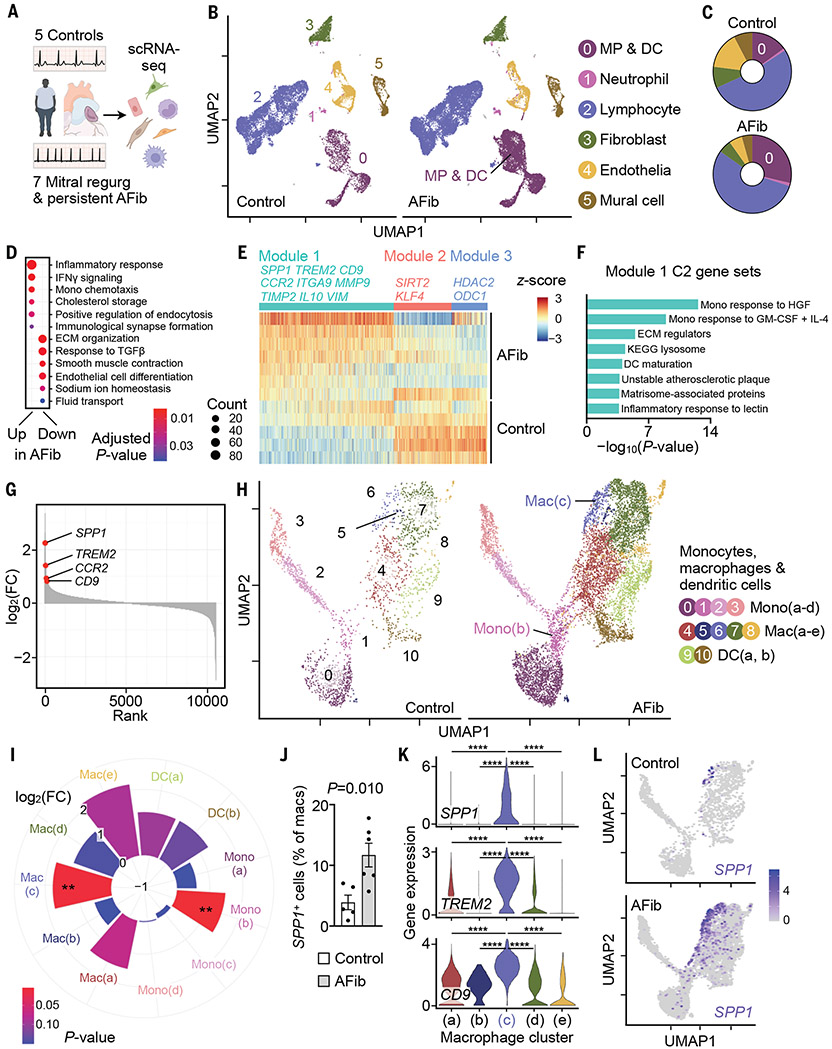
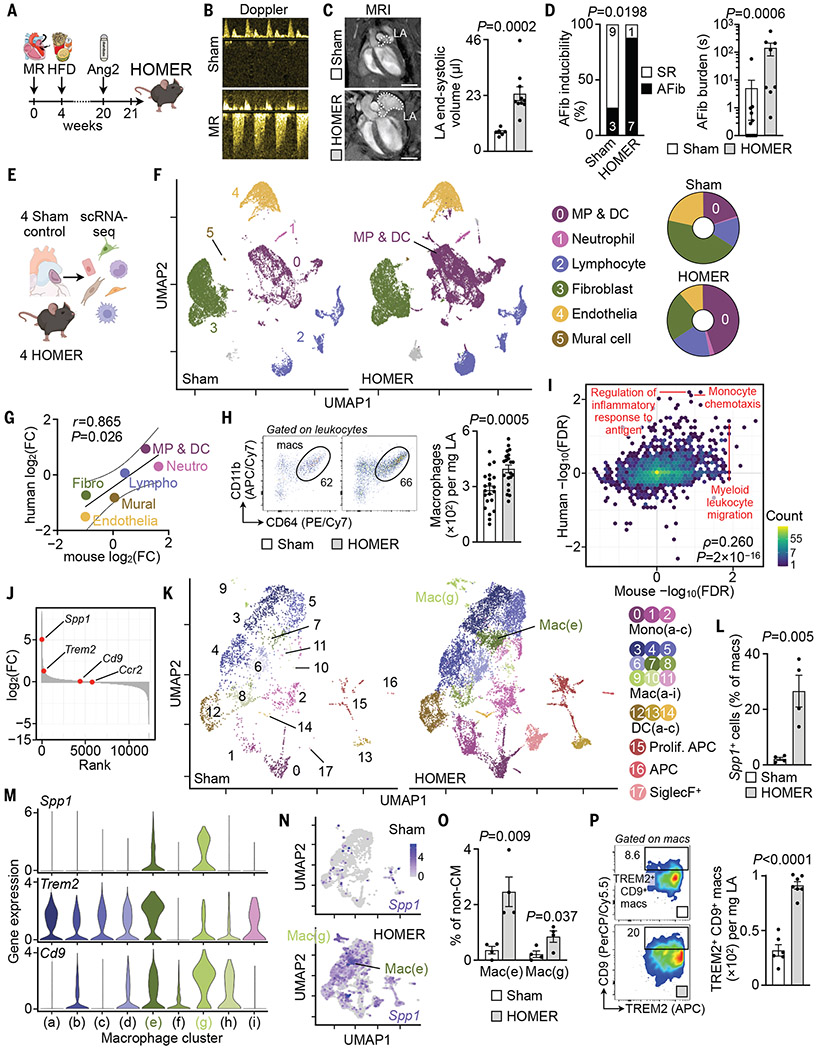
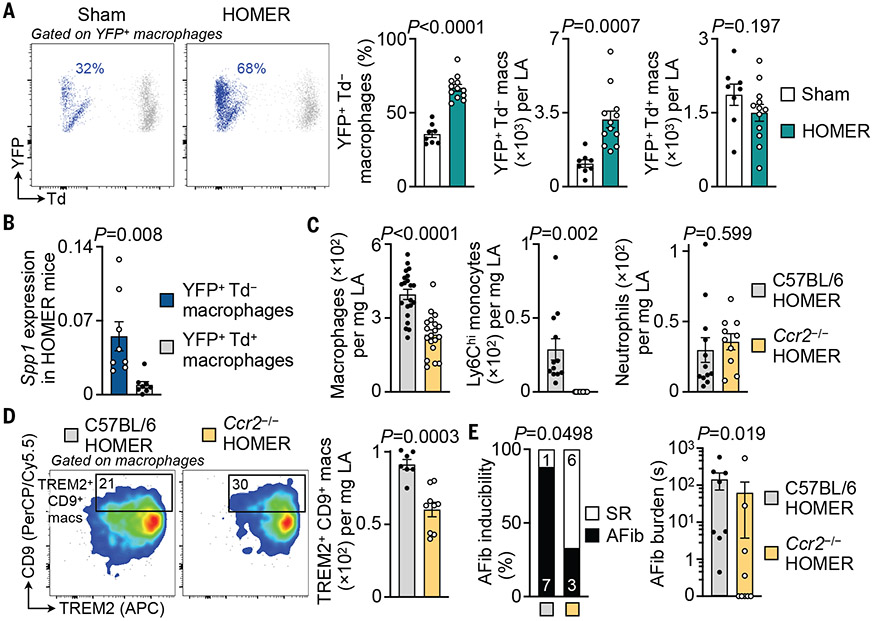
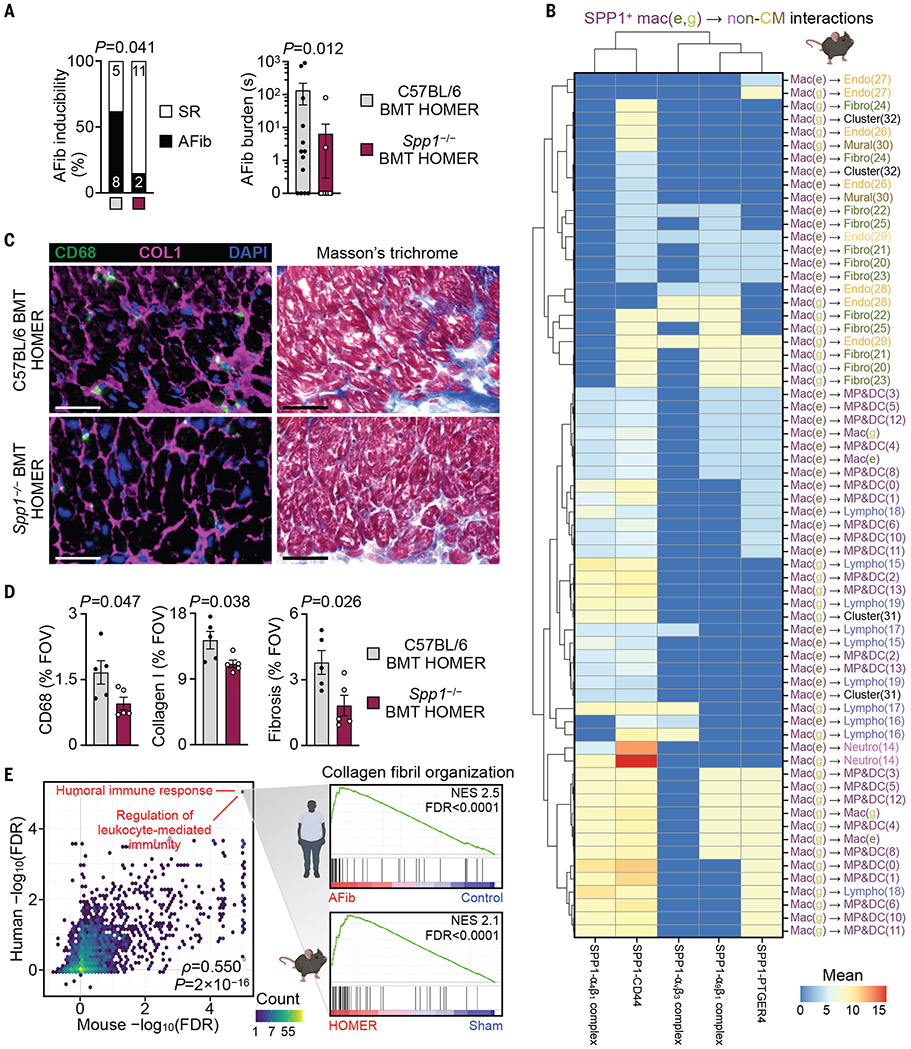
Atrial fibrillation disrupts contraction of the atria, leading to stroke and heart failure. We deciphered how immune and stromal cells contribute to atrial fibrillation. Single-cell transcriptomes from human atria documented inflammatory monocyte and SPP1+ macrophage expansion in atrial fibrillation. Combining hypertension, obesity, and mitral valve regurgitation (HOMER) in mice elicited enlarged, fibrosed, and fibrillation-prone atria. Single-cell transcriptomes from HOMER mouse atria recapitulated cell composition and transcriptome changes observed in patients. Inhibiting monocyte migration reduced arrhythmia in Ccr2-∕- HOMER mice. Cell-cell interaction analysis identified SPP1 as a pleiotropic signal that promotes atrial fibrillation through cross-talk with local immune and stromal cells. Deleting Spp1 reduced atrial fibrillation in HOMER mice. These results identify SPP1+ macrophages as targets for immunotherapy in atrial fibrillation.


Figures

Fig. 1.
Fig. 1.. Single-cell atlas of human atrial disease.
(A) scRNA-seq was performed in five controls and seven patients with AFib. (B) UMAP delineates six major cardiac cell types. (C) Distribution of cell populations. Color code corresponds to (B). (D) Gene ontology biological process (GOBP) gene sets (48, 49) up- or down-regulated in AFib from GSEA of MP/DC cluster. Circle size denotes number of enriched genes. ECM, extracellular matrix. (E) Gene expression in MP/DC cluster represented by z-scores of the log-transformed normalized counts. Rows, samples grouped by disease state; columns, genes in the three gene modules significantly associated with disease state; gene coexpression modules and exemplary genes are labeled. (F) Select MSigDB C2 gene sets (50) overrepresented in module 1 described in (E). GM-CSF, granulocyte-macrophage colony-stimulating factor; HGF, hepatocyte growth factor; IL-4, interleukin-4; KEGG, Kyoto Encyclopedia of Genes and Genomes. (G) Genes in MP/DC cluster ranked according to log2-fold changes [log2(FC)] between seven patients with AFib and five controls. (H) Subclustering of 10,555 MP/DCs from five controls and seven patients with AFib. (I) Difference in abundance of cells belonging to MP/DC subclusters between seven patients with AFib and five control patients. Pie size indicates log2(FC); color (blue, high; red, low) indicates the P value (two-tailed Student’s t test). **P < 0.01. (J) Fraction of SPP1+ macrophages in controls and patients with AFib. Bar graph shows mean ± SEM, n = 5 to 6 per group, two-tailed Student’s t test. (K) Gene expression levels (represented by log-transformed normalized counts) across macrophage clusters; Kruskal–Wallis (P < 2.2 × 10⁻¹⁶) followed by two-tailed Wilcoxon rank sum test. ****Adjusted P = 2 × 10⁻¹⁶. (L) SPP1 expression in MP/DCs from controls and patients with AFib.
Fig. 2.
Fig. 2.. Single-cell atlas of mouse atria.
(A) HOMER mice are exposed to mitral valve regurgitation (MR), high-fat diet (HFD), and angiotensin 2 (Ang2). (B) Doppler of MR. (C) (Left) MRI of left atrium (LA). Scale bars, 3 mm. (Right) LA end-systolic volume, n = 6 to 10 per group from two independent experiments, two-tailed Mann–Whitney test. (D) AFib inducibility and burden. n = 8 to 12 per group from two independent experiments. (Left) Two-sided Fisher’s exact test. (Right) Two-tailed Mann–Whitney test. Other parameters are shown in table S7. SR, sinus rhythm. (E) scRNA-seq was performed in four sham and four HOMER mice. (F) (Left) UMAP. (Right) Cell population distributions. (G) Log2(FC) of cell abundance in mouse and human atria. (H) Flow cytometry of sham and HOMER atria. n = 21 per group from five independent experiments, two-tailed Student’s t test. APC/Cy7, allophycocyanin/cyanine 7; PE/Cy7, phycoerythrin/cyanine 7. (I) Scatterplot showing C5 GOBP GSEA species concordance. GSEA is performed on lists of genes ranked according to differential expression in the disease state. −log10(FDR) is plotted for mouse (x axis) and human (y axis). −log10(FDR) are negative if the gene set is down-regulated. Yellow indicates high and blue indicates low gene set density. (J) Genes in MP/DC cluster ranked according to log2(FC) between four HOMER and four sham mice. The y axis was broken at −5 for displaying the top down-regulated genes. (K) Subclustering of MP/DCs from four sham and four HOMER mice. APC, antigen-presenting cell. (L) Atrial Spp1+ macrophages by scRNA-seq. n = 4 per group, two-tailed Student’s t test. (M) Gene expression levels (represented by log-transformed normalized counts) across macrophage clusters. (N) Spp1 expression in MP/DCs from sham and HOMER mice. (O) Spp1+ subpopulations in sham and HOMER mice. n = 4 per group, two-tailed Student’s t test. non-CM, noncardiomyocyte. (P) Flow cytometry of atrial macrophages in sham and HOMER mice. n = 6 to 7 per group from two independent experiments, two-tailed Student’s t test. PerCP/Cy5.5, peridinin-chlorophyll-protein/cyanine 5.5. All bar graph data are mean ± SEM with individual values for data distribution.
Fig. 3.
Fig. 3.. CCR2-dependent monocyte recruitment contributes to left atrial macrophage expansion and atrial disease.
(A) Flow cytometric quantification of recruited (YFP+ Td) and locally sourced (YFP+ Td+) left atrial macrophages in Cx3cr1CreER/+ Ai9fl/+ sham and HOMER mice. n = 8 to 12 per group from two independent experiments, two-tailed Student’s t test. Td, tdTomato; YFP, yellow fluorescent protein. (B) Relative Spp1 expression levels by qPCR in recruited (YFP+ Td) and locally sourced (YFP+ Td+) left atrial macrophages in Cx3cr1CreER/+ Ai9fl/+ HOMER mice. n = 8 per group from two independent experiments, two-tailed Wilcoxon matched-pairs signed rank test. (C) Flow cytometric quantification of myeloid cell populations in left atrial tissues from C57BL/6 and Ccr2−/− HOMER mice. Macrophages: 21 C57BL/6 and 19 Ccr2−/− HOMER mice from five independent experiments; monocytes and neutrophils: 12 C57BL/6 and 10 Ccr2−/− HOMER mice from three independent experiments; two-tailed Student’s t test. (D) Flow cytometric quantification of TREM2+ CD9+ left atrial macrophages in C57BL/6 and Ccr2−/− HOMER mice. n = 7 to 9 per group from two independent experiments, two-tailed Student’s t test. (E) AFib inducibility and burden in C57BL/6 and Ccr2−/− HOMER mice by means of electrophysiological (EP) study. n = 8 to 9 per group from two independent experiments. (Left) Two-sided Fisher’s exact test. (Right) Two-tailed Mann–Whitney test. Other EP parameters are shown in table S8. All bar graph data are mean ± SEM with individual values for data distribution.
Fig. 4.
Fig. 4.. Macrophage-derived SPP1 promotes atrial disease.
(A) EP study of AFib inducibility and burden in C57BL/6 BMT HOMER and Spp1−/− BMT HOMER mice. n = 13 per group from three independent experiments. (Left) Two-sided Fisher’s exact test. (Right) Two-tailed Mann–Whitney test. Other EP parameters are shown in table S9. (B) Heatmap of SPP1–receptor interactions between SPP1+ macrophages [mac(e) and mac(g)] and other non-CMs in four HOMER mice. SPP1 and cognate receptors are shown on the x axis. Cell populations that express Spp1 and the receptor are shown on the y axis and are color-coded according to the major cardiac cell types identified in Fig. 2F. Color of scale bar (red, high; blue, low) indicates average Spp1 and receptor expression levels in their respective interacting subpopulations (represented by mean normalized counts) if the enrichment of an interacting SPP1–receptor pair in the given interacting subpopulations was statistically significant (P < 0.05). Non-significant interactions were assigned a value of 0. (C) Representative immunofluorescent staining of macrophages (CD68, green), collagen deposition (COL1, magenta), and nuclei [4′,6-diamidino-2-phenylindole (DAPI), blue] and histological staining of fibrosis (Masson’s trichrome staining) in left atrial tissue from C57BL/6 BMT HOMER and Spp1−/− BMT HOMER mice. Scale bars, 50 μm. (D) Quantification of CD68+, COL1+, and fibrotic area in left atrial tissue from C57BL/6 BMT HOMER and Spp1−/− BMT HOMER mice. Bar graphs show percentage of positive staining per field of view (FOV); n = 5 per group from two independent experiments, two-tailed Student’s t test. (E) Scatterplot showing concordance between C5 GOBP GSEA results in human and mouse fibroblasts in AFib and HOMER (as in Fig. 2I). (Inset) Detailed GSEA results for gene set “GOBP collagen fibril organization” in human and mouse fibroblast clusters. NES, normalized enrichment score. All bar graph data are mean ± SEM with individual values for data distribution.

Comment in

References

    1. Litvinukova M et al., Cells of the adult human heart. Nature 588, 466–472 (2020). - PMC - PubMed
    1. Nicolás-Ávila JA, Hidalgo A, Ballesteros I, Specialized functions of resident macrophages in brain and heart. J Leukoc Biol 104, 743–756 (2018). - PubMed
    1. Forte E, Furtado MB, Rosenthal N, The interstitium in cardiac repair: role of the immune-stromal cell interplay. Nat Rev Cardiol 15, 601–616 (2018). - PubMed
    1. Benjamin EJ et al., Heart Disease and Stroke Statistics-2019 Update: A Report From the American Heart Association. Circulation 139, e56–e528 (2019). - PubMed
    1. Yamashita T et al., Recruitment of immune cells across atrial endocardium in human atrial fibrillation. Circ J 74, 262–270 (2010). - PubMed