. 2023 Jun 7;7(8):bvad076.
doi: 10.1210/jendso/bvad076. eCollection 2023 Jul 3.

Pregnancy-associated Steroid Effects on Insulin Sensitivity, Adipogenesis, and Lipogenesis: Role of Wnt/β-Catenin Pathway

Affiliations

Pregnancy-associated Steroid Effects on Insulin Sensitivity, Adipogenesis, and Lipogenesis: Role of Wnt/β-Catenin Pathway

Neethu Sara Alex et al. J Endocr Soc. .

Abstract

Context: The shift in maternal energy metabolism characteristic of pregnancy is thought to be driven by various hormonal changes, especially of ovarian and placental steroids. Imbalances in circulating estradiol (E2) and progesterone (P4) levels during this period are often associated with metabolic disturbances leading to the development of gestational diabetes mellitus (GDM). Since abnormalities in the Wnt pathway effector transcription factor 7-like 2 (TCF7L2) are commonly associated with the occurrence of GDM, we hypothesized that the canonical or β-catenin-dependent Wnt signaling pathway mediates the metabolic actions of E2 and P4.

Objective: Our study was aimed at elucidating the metabolic function of the steroids E2 and P4, and examining the role of the canonical Wnt signaling pathway in mediating the actions of these steroids.

Methods: The ovariectomized (OVX) rat was used as a model system to study the effect of known concentrations of exogenously administered E2 and P4. Niclosamide (Nic) was administered to block Wnt signaling. 3T3-L1 cells were used to analyze changes in differentiation in the presence of the steroids or niclosamide.

Results: In the present study, we observed that E2 enhanced insulin sensitivity and inhibited lipogenesis while P4 increased lipogenic gene expression-in 3T3-L1 adipocytes, and in adipose tissue and skeletal muscle of OVX rats when the dosage of E2 and P4 mimicked that of pregnancy. Both E2 and P4 were also found to upregulate Wnt signaling. Nic nhibited the steroid-mediated increase in Wnt signaling in adipocytes and OVX rats. The insulin-sensitizing and antilipogenic actions of E2 were found to be mediated by the canonical Wnt pathway, but the effects of P4 on lipogenesis appeared to be independent of it. Additionally, it was observed that inhibition of Wnt signaling by Nic hastened adipogenic differentiation, and the inhibitory effect of E2 on differentiation was prevented by Nic.

Conclusion: The findings presented in this study highlight the role of steroids and Wnt pathway in glucose and lipid metabolism and are relevant to understanding the pathophysiology of metabolic disorders arising from hormonal disturbances.

Keywords: adipose tissue; estradiol; insulin signaling; lipid metabolism; progesterone; skeletal muscle.


Figures

Figure 1.
Figure 1.
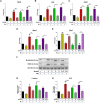
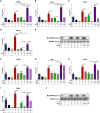
Effect of steroids and niclosamide (Nic) on canonical Wnt signaling in mature/differentiated adipocytes. 3T3-L1 adipocytes were serum-starved for 6 hours and incubated with Nic (1 μM), estradiol (E2; 100 nM), progesterone (P4; 1 μM), or their combinations for 18 hours (n = 3). RNA isolated from these cells was analyzed for the expression of canonical Wnt signaling pathway genes A, Tcf7l2; and B, Lrp5; target genes C, Axin2; and D, Ppard; and the negative regulator of Wnt signaling E, Sfrp1 by qRT-PCR. Gene expression was normalized to the expression of Rpl19. Cell lysates were analyzed for the active form of β-catenin and Dvl2 protein by F, immunoblotting. β-actin was used as the loading control. G and H, Densitometric analysis was performed. Data are represented as mean ± SEM of fold change compared to the expression in untreated cells, in A to E, G, and H. Statistical significance among treatment groups was determined by one-way analysis of variance and Bonferroni post test. *, **, and *** represent statistically significant differences of P less than .05, P less than .01, and P less than .001, respectively. #, ##, and ### represent statistically significant differences of P less than .05, P less than .01, and P less than .001, respectively, with respect to untreated cells. Axin2, axis inhibition protein 2; Dvl2, disheveled segment polarity protein 2; Lrp5, low-density lipoprotein receptor-related protein 5; Ppard, peroxisome proliferator-activated receptor delta; qRT-PCR, quantitative reverse-transcription polymerase chain reaction; Rpl19, 60S ribosomal protein L19; Sfrp1, secreted frizzled-related protein 1; Tcf7l2, transcription factor 7-like 2.
Figure 2.
Figure 2.
Effect of steroids and niclosamide (Nic) on insulin signaling in mature/differentiated adipocytes. 3T3-L1 adipocytes were serum-starved for 6 hours and incubated with Nic (1 μM), estradiol (E2; 100 nM), progesterone (P4; 1 μM), or their combinations for 18 hours (n = 3). RNA isolated from these cells was analyzed for the expression of insulin sensitivity marker genes like A, Slc2a4; B, Insr; C, Acadm; and D, Foxo1 by qRT-PCR. Gene expression was normalized to the expression of Rpl19. Cell lysates were analyzed for the expression of insulin signaling pathway proteins insulin receptor-β and phospho-Akt by E, immunoblotting. β-actin was used as the loading control. F and G, Densitometric analysis was performed. Data are represented as mean ± SEM of fold change compared to the expression in untreated cells, in A to D, F, and G. Statistical significance among treatment groups was determined by one-way analysis of variance and Bonferroni post test. *, **, and *** represent statistically significant differences of P less than .05, P less than .01, and P less than .001, respectively. #, ##, and ### represent statistically significant differences of P less than .05, P less than .01, and P less than .001, respectively, with respect to untreated cells. Acadm, acyl-CoA dehydrogenase medium chain; Foxo1, forkhead box O1; Insr, insulin receptor; qRT-PCR, quantitative reverse-transcription polymerase chain reaction; Rpl19, 60S ribosomal protein L19; Slc2a4, solute carrier family 2 member 4 or facilitated glucose transporter GLUT4.
Figure 3.
Figure 3.
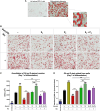
Effect of steroids and niclosamide (Nic) on adipogenic differentiation in 3T3-L1 cells. Preadipocytes were grown in 24- or 12-well plates and induced to differentiate into adipocytes. On day 7 of differentiation, wells were stained with Oil Red O to visualize lipid droplets and characterize the extent of differentiation. The images in A represent the appearance of preadipocytes in which differentiation had not been induced (on the left panel) and completely differentiated adipocytes in which lipid droplets can be visualized by the red color (on the right panel). Representative images of stained wells containing adipocytes differentiated in the presence of Nic (1 μM), estradiol (E2; 100 nM), progesterone (P4; 1 μM), or their combinations (n = 3) are shown in B. Representative images in A and B were captured at 20× magnification in bright field using an inverted microscope. The scale bars represent a distance of 100 μm. C, The images captured were quantified for the area occupied by the red stain in different treatment groups using image analysis software. D, Additionally, the Oil Red O stain was eluted from wells and intensity of the color was measured at 520 nm. Data are represented as mean ± SEM in C and D. Statistical significance among treatment groups was determined by one-way analysis of variance and Bonferroni post test. *, **, and *** represent statistically significant differences of P less than .05, P less than .01, and P less than .001, respectively. # and ### represent statistically significant differences of P less than .05 and P less than .001, respectively, with respect to untreated differentiating cells.
Figure 4.
Figure 4.
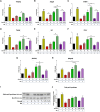
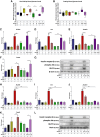
Effect of steroids and niclosamide (Nic) on expression of adipogenesis and lipogenesis markers during 3T3-L1 differentiation. Preadipocytes were induced to differentiate into adipocytes in the presence of Nic (1 μM), estradiol (E2; 100 nM), progesterone (P4; 1 μM), or their combinations (n = 3). On day 7 of differentiation, RNA isolated from these cells was analyzed for the expression of adipogenesis markers A, Adipoq; B, Fabp4; C, Cebpa; and D, Pparg; and lipogenesis markers E, Lpl; F, Fasn; G, Slc27a1; and H, Mogat1 by qRT-PCR. Gene expression was normalized to the expression of Rpl19. I, Cell lysates were analyzed for the expression of the fatty acid synthase enzyme complex by immunoblotting. β-actin was used as the loading control. J, Densitometric analysis was performed. Data are represented as mean ± SEM of fold change compared to the expression in untreated cells, in A to H and J. Statistical significance among treatment groups was determined by one-way analysis of variance and Bonferroni post test. *, **, and *** represent statistically significant differences of P less than .05, P less than .01, and P less than .001, respectively. #, ##, and ### represent statistically significant differences of P less than .05, P less than .01, and P less than .001, respectively, with respect to untreated cells. Adipoq, adiponectin; Cebpa, CCAAT/enhancer binding protein alpha; Fabp4, fatty acid binding protein 4; Lpl, lipoprotein lipase; Fasn, fatty acid synthase; Mogat1, monoacylglycerol O-acyltransferase 1; Pparg, peroxisome proliferator-activated receptor gamma; qRT-PCR, quantitative reverse-transcription polymerase chain reaction; Rpl19, 60S ribosomal protein L19; Slc27a1, solute carrier family 27 member 1 or long-chain fatty acid transport protein 1.
Figure 5.
Figure 5.
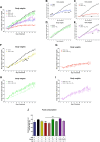
Effect of steroids and niclosamide (Nic) on body weight and food consumption in ovariectomized (OVX) rats. OVX rats were treated with the steroids—estradiol (E2; 10 μg/day), progesterone (P4; 10 mg/day), and their combination—in the absence and presence of the Wnt inhibitor Nic (20 mg/kg body weight/day). Body weights of rats from the various experimental groups were recorded on a daily basis during the 23-day treatment period (n≥6). The body weight on each day is expressed as a percentage of the body weight on day 1 of treatment (considered 100%) for each rat in each group. Mean ± SEM of the percentage of initial body weight of animals in each group is plotted against the day of treatment. A, Body weight gain in intact rats, OVX rats, and OVX rats treated with E2, P4, and E2 + P4 was compared. To appreciate the differences between groups, graphs showing body weight gain of each group in relation to the control OVX group were plotted: B, Intact vs OVX rats; C, OVX vs OVX + E2 rats; D, OVX vs OVX + P4 rats; and E, OVX vs OVX + E2 + P4 rats. To assess the effect of Nic, comparisons of body weight gain were made between the following groups: F, OVX vs OVX + Nic rats; G, OVX + E2 vs OVX + Nic + E2 rats; H, OVX + P4 vs OVX + Nic + P4 rats; and I, OVX + E2 + P4 vs OVX + Nic + E2 + P4 rats. Statistical significance among groups was determined by 2-way analysis of variance (ANOVA) and Bonferroni post test. #, ##, and ### represent statistically significant differences of P less than .05, P less than .01, and P less than .001, respectively, between the percentage body weight gain of the treatment group and the percentage body weight gain of the OVX group on a particular day. J, Total food consumption of rats from the various experimental groups was recorded over the course of the 23-day treatment period. Data are represented as mean ± SEM. Statistical significance among treatment groups was determined by one-way ANOVA and Bonferroni post test. *** represents a statistically significant difference of P less than .001. # and ### represent statistically significant differences of P less than .05 and P less than .001, respectively, with respect to untreated OVX rats.
Figure 6.
Figure 6.
Effect of steroids and niclosamide (Nic) on canonical Wnt signaling in the gonadal white adipose tissue (GWAT) and soleus skeletal muscle of ovariectomized (OVX) rats. OVX rats were treated with Nic (20 mg/kg body weight/day), estradiol (E2; 10 μg/day), progesterone (P4; 10 mg/day), or their combinations, for a period of 23 days. The GWAT and soleus muscle collected from these rats (n = 4 each) were analyzed for the expression of canonical Wnt signaling pathway genes Tcf7l2 (A, GWAT; F, soleus) and Lrp5 (B, GWAT; G, soleus), and target genes Axin2 (C, GWAT; H, soleus) and Ppard (D, GWAT; I, soleus) by qRT-PCR analysis. Gene expression was normalized to the expression of B2m. GWAT and soleus lysates (n = 3 each) were also analyzed for the active form of β-catenin by immunoblotting (E, GWAT; J, soleus). β-actin and actin were used as loading controls for GWAT and soleus lysates, respectively. Data is represented as mean ± SEM of fold change compared to the untreated OVX control group in A to D and F to I. Statistical significance among treatment groups was determined by one-way analysis of variance and Bonferroni post test. *, **, and *** represent statistically significant differences of P less than .05, P less than .01, and P less than .001, respectively. #, ##, and ### represent statistically significant differences of P less than .05, P less than .01, and P less than .001, respectively, with respect to untreated OVX rats. Axin2, axis inhibition protein 2; B2m, β-2 microglobulin; Lrp5, low-density lipoprotein receptor-related protein 5; Ppard, peroxisome proliferator-activated receptor delta; qRT-PCR, quantitative reverse-transcription polymerase chain reaction; Tcf7l2, transcription factor 7-like 2.
Figure 7.
Figure 7.
Effect of steroids and niclosamide (nic) on blood glucose levels and insulin sensitivity in the gonadal white adipose tissue (GWAT) and soleus skeletal muscle muscle of ovariectomized (OVX) rats. OVX rats were treated with Nic (20 mg/kg body weight/day), estradiol (E2; 10 μg/day), progesterone (P4; 10 mg/day), or their combinations, for a period of 23 days. A, Nonfasting and B, fasting (4 hours) glucose levels were measured in rats from each experimental group (n≥6) using blood collected from a tail nick. Data are plotted as mean ± SEM in A and B. GWAT and soleus muscle collected from these rats (n = 4 each) were analyzed for expression of insulin sensitivity marker genes like Slc2a4 (C, GWAT; H, Soleus), Insr (D, GWAT; I, soleus), Acadm (E, GWAT; J, soleus), and Foxo1 (F, GWAT; K, Soleus) by qRT-PCR analysis. Gene expression was normalized to the expression of B2m. GWAT and soleus lysates (n = 3 each) were also analyzed for expression of insulin signaling pathway proteins insulin receptor-β and phospho-Akt, and the facilitated glucose transporter GLUT4 by immunoblotting (G, GWAT; L, soleus). β-actin and actin were used as loading controls for GWAT and soleus lysates, respectively. Data is represented as mean ± SEM of fold change compared to the untreated OVX control group in C to F and H to K. Statistical significance among treatment groups was determined by one-way analysis of variance and Bonferroni post test. *, **, and *** represent statistically significant differences of P less than .05, P less than .01, and P less than .001, respectively. #, ##, and ### represent statistically significant differences of P less than .05, P less than .01, and P less than .001, respectively, with respect to untreated OVX rats. Acadm, acyl-CoA dehydrogenase medium chain; B2m, β-2 microglobulin; Foxo1, forkhead box O1; Insr, insulin receptor; qRT-PCR, quantitative reverse-transcription polymerase chain reaction; Slc2a4, solute carrier family 2 member 4 or GLUT4.
Figure 8.
Figure 8.
Effect of steroids and niclosamide (Nic) on fat accumulation and lipogenesis in the gonadal white adipose tissue (GWAT) of ovariectomized (OVX) rats. OVX rats were treated with Nic (20 mg/kg body weight/day), estradiol (E2; 10 μg/day), progesterone (P4; 10 mg/day), or their combinations, for a period of 23 days. A, GWAT collected from these rats (n≥6) was weighed and plotted as mean ± SEM. RNA isolated from GWAT (n = 4) was analyzed for the expression of lipogenesis markers B, Lpl; C, Fasn; D, Slc27a1; and E, Mogat1, by qRT-PCR analysis. Gene expression was normalized to the expression of B2m. F, GWAT lysates (n = 3) were also analyzed for expression of the fatty acid synthase enzyme complex by immunoblotting. β-actin was used as the loading control. G, Densitometric analysis was performed. Data are represented as mean ± SEM of fold change compared to the untreated OVX control group in B to E and G. Statistical significance among treatment groups was determined by one-way analysis of variance and Bonferroni post test. *, **, and *** represent statistically significant differences of P less than .05, P less than .01, and P less than .001, respectively. #, ##, and ### represent statistically significant differences of P less than .05, P less than .01, and P less than .001, respectively, with respect to untreated OVX rats. B2m, β-2 microglobulin; Fasn, fatty acid synthase; Lpl, lipoprotein lipase; Mogat1, monoacylglycerol O-acyltransferase 1; qRT-PCR, quantitative reverse-transcription polymerase chain reaction; Slc27a1, solute carrier family 27 member 1 or long-chain fatty acid transport protein 1.
Figure 9.
Figure 9.
Effect of steroids and niclosamide (Nic) on adipokines in ovariectomized (OVX) rats. OVX rats were treated with Nic (20 mg/kg body weight/day), estradiol (E2; 10 μg/day), progesterone (P4; 10 mg/day), or their combinations, for 23 days. A, Blood collected from these rats (n = 5) was used to determine serum adiponectin concentrations by ELISA. Data are represented as mean ± SEM of the absolute values. The GWAT collected from these rats (n = 4) was analyzed for the expression of adipokines B, Adipoq and C, Lep by qRT-PCR analysis. Gene expression was normalized to the expression of B2m. Data are represented as mean ± SEM of fold change compared to the untreated OVX control group in B and C. Statistical significance among treatment groups was determined by one-way analysis of variance and Bonferroni post-test. ** and *** represent statistically significant differences of P less than .01 and P less than .001, respectively. # and ### represent statistically significant differences of P less than .05 and P less than .001, respectively, with respect to untreated OVX rats. Adipoq, adiponectin; B2m, β-2 microglobulin; ELISA, enzyme-linked immunosorbent assay; Lep, leptin; GWAT, gonadal white adipose tissue.
Figure 10.
Figure 10.
Expression of wnt signaling pathway markers in the gonadal white adipose tissue (GWAT) and soleus skeletal muscle of nonpregnant and pregnant rats. GWAT and soleus muscle collected from nonpregnant (NP) rats and from pregnant rats humanely killed on day 7 (P7), day 10 (P10), day 14 (P14), and day 21 (P21) of their pregnancy (n = 3 each) was analyzed for the active form of β-catenin by immunoblotting (A, GWAT; H, soleus). β-Actin and actin were used as loading controls for GWAT and soleus lysates, respectively. B, Densitometric analysis was performed (GWAT; I, soleus). GWAT and soleus muscle from NP and P10 rats (n = 4 each) were also analyzed for the expression of canonical Wnt signaling pathway genes Tcf7l2 (C, GWAT; J, Soleus) and Lrp5 (D, GWAT; K, Soleus), target genes Axin2 (E, GWAT; L, Soleus) and Ppard (F, GWAT; M, Soleus), and the negative regulator of Wnt signaling Sfrp1 (G, GWAT; N, Soleus) by qRT-PCR analysis. Gene expression was normalized to the expression of B2m. Data are represented as mean ± SEM of fold change compared to the NP control group, in B to G and I to N. Statistical significance was determined by one-way analysis of variance and Bonferroni post test in B and I and by t test in C to G and J to N. * and ** represent statistically significant differences of P less than .05 and P less than .01, respectively. Axin2, axis inhibition protein 2; B2m, β-2 microglobulin; Lrp5, low-density lipoprotein receptor-related protein 5; Ppard, peroxisome proliferator-activated receptor delta; qRT-PCR, quantitative reverse-transcription polymerase chain reaction; Sfrp1, secreted frizzled-related protein 1; Tcf7l2, transcription factor 7-like 2.
Figure 11.
Figure 11.
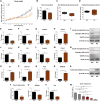
Effect of niclosamide (Nic) treatment in pregnant rats. Rats were treated with either the vehicle (Veh; 10% Cremophor EL) or Nic (20 mg/kg body weight/day) during pregnancy. Body weights of vehicle (Veh) and Nic-treated pregnant rats were recorded on a daily basis (n≥6). Body weight on each day is expressed as a percentage of the body weight on day 1 of treatment (considered 100%) for each rat in each group. A, Mean ± SEM of the percentage of initial body weight of animals in each group is plotted against the day of treatment. Statistical significance between the groups was determined by 2-way analysis of variance and Bonferroni post test. B, Total food consumption of Veh- and Nic-treated pregnant rats was recorded over the course of the treatment period. C, Nonfasting and D, fasting (4 hours) glucose levels were measured in rats at the end of treatment (n≥6) using blood collected from a tail nick. Data are represented as mean ± SEM in B to D. Gonadal white adipose tissue (GWAT) collected from Veh- and Nic-treated pregnant rats (n = 4) was analyzed for the expression of insulin sensitivity marker genes like E, Slc2a4; F, Insr; G, Acadm; and H, Foxo1 for the expression of lipogenesis markers O, Lpl; P, Fasn; Q, Slc27a1; and R, Mogat1 and for the expression of adipokines U, Adipoq and V, Lep by qRT-PCR analysis. Similarly, the soleus skeletal muscle (n = 4) was analyzed for the expression of insulin sensitivity marker genes J, Slc2a4; K, Insr; L, Acadm; and M, Foxo1. Gene expression was normalized to the expression of B2m. GWAT lysates (n = 3) were analyzed for expression of insulin signaling pathway proteins insulin receptor-β and phospho-Akt; I, the facilitated glucose transporter GLUT4; and S, the fatty acid synthase enzyme complex, by immunoblotting. Soleus lysates (n = 3) were analyzed for expression of N, insulin receptor-β, phospho-Akt, and GLUT4 by immunoblotting. β-Actin and actin were used as loading controls for GWAT and soleus lysates, respectively. Data are represented as mean ± SEM of fold change compared to the Veh-treated group in E to H, J to M, O to R, and U to V. T, Blood collected from Veh- or Nic-treated pregnant rats (n = 5) was used to determine serum adiponectin concentrations by ELISA. W, Adiponectin levels were also measured in blood collected from nonpregnant rats (NP) and from pregnant rats humanely killed on day 7 (P7), day 10 (P10), day 14 (P14), and day 21 (P21) of their pregnancy (n = 4) for comparison. Data are represented as mean ± SEM of the absolute values in T and W. Statistical significance between treatment groups was determined by t test. *, **, and *** represent statistically significant differences of P less than .05, P less than .01, and P less than .001, respectively. Acadm, acyl-CoA dehydrogenase medium chain; Adipoq, adiponectin; B2m, β-2 microglobulin; ELISA, enzyme-linked immunosorbent assay; Fasn, fatty acid synthase; Foxo1, forkhead box O1; Insr, insulin receptor; Lep, leptin; Lpl, lipoprotein lipase; Mogat1, monoacylglycerol O-acyltransferase 1; qRT-PCR, quantitative reverse-transcription polymerase chain reaction; Slc2a4, solute carrier family 2 member 4 or GLUT4; Slc27a1, solute carrier family 27 member 1 or long-chain fatty acid transport protein 1.
Figure 12.
Figure 12.
Effect of niclosamide (Nic) on weight of liver and expression of lipogenic genes in liver tissue of pregnant rats. Whole liver collected from pregnant rats treated with the vehicle (Veh; 10% Cremophor EL) or Nic (20 mg/kg body weight/day) (n≥6) was A, photographed and B, weighed. C, The weight of the liver is also expressed as a fraction of the body weight of the rat. The whitish appearance of the liver from Nic-treated pregnant rats in A denotes the accumulation of fat around the organ. Data are represented as mean ± SEM in B and C. The liver collected from Veh- and Nic-treated pregnant rats (n = 4) was analyzed for the expression of liver-specific lipogenesis markers D, Fasn; E, Mogat1; F, Dgat1; and G, Dbi by qRT-PCR analysis. Gene expression was normalized to the expression of B2m. Data are represented as mean ± SEM of fold change compared to the Veh-treated group in D to G. Statistical significance between treatment groups was determined by t test. *, **, and *** represent statistically significant differences of P less than .05, P less than .01, and P less than .001, respectively. B2m, β-2 microglobulin; Dbi, diazepam binding inhibitor or acyl-CoA binding protein; Dgat1, diacylglycerol O-acyltransferase 1; Fasn, fatty acid synthase; Mogat1, monoacylglycerol O-acyltransferase 1; qRT-PCR, quantitative reverse-transcription polymerase chain reaction.

References

    1. Vejrazkova D, Vcelak J, Vankova M, et al. Steroids and insulin resistance in pregnancy. J Steroid Biochem Mol Biol. 2014;139:122‐129. - PubMed
    1. Napso T, Yong HEJ, Lopez-Tello J, Sferruzzi-Perri AN. The role of placental hormones in mediating maternal adaptations to support pregnancy and lactation. Front Physiol. 2018;9:1091. - PMC - PubMed
    1. Parrettini S, Caroli A, Torlone E. Nutrition and metabolic adaptations in physiological and complicated pregnancy: focus on obesity and gestational diabetes. Front Endocrinol (Lausanne). 2020;11:937. - PMC - PubMed
    1. Del Rincon JP, Iida K, Gaylinn BD, et al. Growth hormone regulation of p85α expression and phosphoinositide 3-kinase activity in adipose tissue: mechanism for growth hormone-mediated insulin resistance. Diabetes. 2007;56(6):1638‐1646. - PubMed
    1. Masuyama H, Hiramatsu Y. Potential role of estradiol and progesterone in insulin resistance through constitutive androstane receptor. J Mol Endocrinol. 2011;47(2):229‐239. - PubMed

LinkOut - more resources