. 2023 Jun 27:10:1176107.
doi: 10.3389/fmolb.2023.1176107. eCollection 2023.

Variability of the innate immune response is globally constrained by transcriptional bursting

Affiliations

Variability of the innate immune response is globally constrained by transcriptional bursting

Nissrin Alachkar et al. Front Mol Biosci. .

Abstract

Transcription of almost all mammalian genes occurs in stochastic bursts, however the fundamental control mechanisms that allow appropriate single-cell responses remain unresolved. Here we utilise single cell genomics data and stochastic models of transcription to perform global analysis of the toll-like receptor (TLR)-induced gene expression variability. Based on analysis of more than 2000 TLR-response genes across multiple experimental conditions we demonstrate that the single-cell, gene-by-gene expression variability can be empirically described by a linear function of the population mean. We show that response heterogeneity of individual genes can be characterised by the slope of the mean-variance line, which captures how cells respond to stimulus and provides insight into evolutionary differences between species. We further demonstrate that linear relationships theoretically determine the underlying transcriptional bursting kinetics, revealing different regulatory modes of TLR response heterogeneity. Stochastic modelling of temporal scRNA-seq count distributions demonstrates that increased response variability is associated with larger and more frequent transcriptional bursts, which emerge via increased complexity of transcriptional regulatory networks between genes and different species. Overall, we provide a methodology relying on inference of empirical mean-variance relationships from single cell data and new insights into control of innate immune response variability.

Keywords: burst frequency; burst size; innate immunity; scRNA-seq inference; stochastic transcription; telegraph model; toll-like receptor; transcriptional bursting.


Conflict of interest statement

The authors declare that the research was conducted in the absence of any commercial or financial relationships that could be construed as a potential conflict of interest.

Figures

FIGURE 1
FIGURE 1
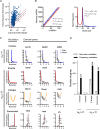
TLR-induced transcriptional variability is linearly constrained. (A). Overall variability in the scRNA-seq dataset (Hagai et al., 2018). Shown is the scatter plot of the sample mean (μ) and variance (σ2) calculated for 2340 TLR-dependent genes across 20 experimental conditions. Data points corresponding to Jchain, Ccl5 and Nfkbia highlighted in yellow, red, and green, respectively. Broken line indicates μ = σ 2 line. (B). Schematic description of the fitting protocol. (C). Histogram of coefficient of determination (R 2 ) for 2,133 gene fits characterised by a significant regression slope (p-value < 0.05). R 2 = 0.6 broken line corresponds to the high confidence gene cut-off. (D). Distribution of the fitted regression slopes for the 1,551 high confidence gene set. Histogram of the fitted slopes shown on the left. Number of genes with different slope range shown on the right. (E). Fitted mean-variance relationships for a subset of genes. Shown are the individual datapoints (LPS, PIC and unstimulated) as well as fitted regression line with a fitted equation (* denotes statistically significant intercept, p-value < 0.05) and the coefficient of determination (R 2 ). (F). Mean mRNA counts across treatments (LPS, PIC) and time (0, 2, 4, 6 h) for the 1,551 high confidence genes.
FIGURE 2
FIGURE 2
Mean-variance relationships constrain transcriptional bursting characteristics. (A). Theoretical burst size and frequency characteristics. (Left) Simulated mean variance relationships with positive (in blue, α = 20, α0 = 100) and negative (in red, α = 20, α0 = −100) intercepts, respectively. (Middle & Right) Derived burst size and frequency modulation schemes for corresponding parameter values calculated using moment estimators. A special case of α = 20, α0 = 0 is shown in broken line. (B). Global modulation of transcriptional busting. Shown is the comparison between fitted mean-variance relationship and derived theoretical burst size and frequency modulation schemes vs. experimental data. Shown is distribution of relative root mean square error (RRMSE) of 1,551 high confidence genes (C). Modulation schemes for Cd44, Pfn1, Eif6 and Cxcl10 genes. Shown is the comparison between theoretical relationships based on fitted mean-variance relationships (in red) and corresponding estimates from data (open circles). Equations for fitted mean-variance relationships highlighted in the top left panel, respectively.
FIGURE 3
FIGURE 3
LPS-induced gene expression undergoes different modes of transcriptional bursting. (A). Relative changes of burst size and burst frequency. Shown is the relative fold change of burst size and frequency calculated across the individual range of mean expression for 1,551 high confidence genes (in blue circles). Identity line depicted in black, two-fold change highlighted in red. (B). Theoretical relationship between burst size and frequency. (Left) Simulated mean variance relationships with positive (in blue, α = 20, α0 = 100) and negative (in red, α = 20, α0 = −100) intercepts, respectively. (Right) Burst size and frequency modulation schemes for corresponding parameter values calculated using moment estimators. A special case of α = 20, α 0 = 0 shown in broken line. (C). Modulation of burst size and frequency across a range of individual genes. Shown are inverse relationship (α 0 > 0) in blue as well as inverse, U-shape and concurrent relationships (α 0 < 0). Relationship predicted from linear constraints in solid lines and corresponding estimates from experimental data in open circles. U-shape numerically defined as maximum burst size value > α/2 and minimum burst size value < α/2 across conditions. (D). Prevalence of different modulation schemes across 1,551 high confidence genes. Definition of the mode as in C, dominant modulation defined by absolute difference in the burst size vs. frequency changes across the respective range of mean expression (as in A).
FIGURE 4
FIGURE 4
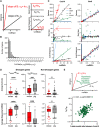
TLR response variability is associated with regulatory complexity. (A). Schematic representation of the 2-state and 3-state models of transcription. (B). Comparison between the fitted and measured mRNA counts distributions. Shown are cumulative probability distribution of data (in green) vs. the corresponding 2-state and 3-state stochastic model fits (in red and blue, respectively) for representative condition for Eif6 (PIC, 4h, replicate 3) and Ccl2 (LPS, 2h, replicate 2) genes. (C). Analysis of transcriptional bursting across high coverage genes and conditions fitted by 2-state vs. 3-state models. Shown is the comparison between best fit 2-state and 3-state models in terms of mean mRNA expression, variance, burst size and frequency from experimental data. Best fit defined by AIC best model <0.5AIC 2nd best (from Supplementary Figure S3B). Burst size and frequency calculated per condition using moment estimators. Statistical significance assessed with Mann-Whitney test (** p-value < 0.01, **** p-value < 0.0001). (D). Relationship between slope of the mean-variance relationship and fraction of 3-state model fits for high coverage genes. Fraction of 3-state model fits per gene defined by the number of conditions with AIC 3-state model <AIC 2-state over all conditions per gene. Broken line indicates 0.5, r denotes Spearman correlation coefficient.
FIGURE 5
FIGURE 5
Evolutionary control of TLR response variability. (A). Schematic representation of response variability during evolution for putative species A and (B). Shown are mean variance relationships corresponding to slopes (α1 and α2 = kα1) and the predicted burst size (B) and frequency (F) modulation schemes for corresponding parameter values calculated using moment estimators. (B). Histogram of the slope ratio k calculated for the 169 orthologue genes across all pairwise comparisons between mouse, rat, rabbit and pig. k = max (α1,α2)/min (α1,α2), where α1 and α2 denote slopes of the fitted mean-variance relationships for each pair of species per gene. (C). Modulation schemes for Cxcl10 and Cbx8 genes. Shown is the comparison between theoretical relationships based on the fitted mean-variance relationships (in solid lines, colour-coded by species) and corresponding moment estimates for burst size and frequency from experimental data (circles). (D). Analysis of burst size and frequency for divergent and non-divergent mouse and pig TLR-response genes. Shown are box plots of average burst size and mean-normalized frequency per gene stratified into divergent (αmouse> 2αpig or αpig>2αpig) and complementary non-divergent groups (31, 15 and 123 orthologue genes, respectively). Statistical significance assessed with a paired Wilcoxon test (**** p-value < 0.0001, *** p-value < 0.001, ns not significant). (E). Change of variability between species is associated with regulatory complexity. Top: Schematic representation of the hypothesis. Bottom: Relationship between the slope ratio (αA/αB) estimated for 146 pairwise comparisons between 28 fitted orthologue genes for mouse, rat, rabbit and pig; and the corresponding ratio between species A and B of the number of conditions per gene with 3-state model fitting better than 2-state model. Absolute difference in AIC of the two models was used for model selection. Shown is the Spearman correlation coefficient r and a p-value for r > 0.

Similar articles

Cited by

References

    1. Adamson A., Boddington C., Downton P., Rowe W., Bagnall J., Lam C., et al. (2016). Signal transduction controls heterogeneous NF-κB dynamics and target gene expression through cytokine-specific refractory states. Nat. Commun. 7, 12057. 10.1038/ncomms12057 - DOI - PMC - PubMed
    1. Akaike H. (1973). “Information theory and an extension of the maximum likelihood principle,” in Selected papers of hirotugu Akaike (Berlin, Germany: Springer; ).
    1. Al-Mohy A. H., Higham N. J. (2011). Computing the action of the matrix exponential, with an application to exponential integrators. Siam J. Sci. Comput. 33, 488–511. 10.1137/100788860 - DOI
    1. Avraham R., Haseley N., Brown D., Penaranda C., Jijon H. B., Trombetta J. J., et al. (2015). Pathogen cell-to-cell variability drives heterogeneity in host immune responses. Cell 162, 1309–1321. 10.1016/j.cell.2015.08.027 - DOI - PMC - PubMed
    1. Bagnall J., Boddington C., England H., Brignall R., Downton P., Alsoufi Z., et al. (2018). Quantitative analysis of competitive cytokine signaling predicts tissue thresholds for the propagation of macrophage activation. Sci. Signal 11, eaaf3998. 10.1126/scisignal.aaf3998 - DOI - PubMed

LinkOut - more resources