Review
. 2023 Jun 19;9(6):e17336.
doi: 10.1016/j.heliyon.2023.e17336. eCollection 2023 Jun.

Cardiac magnetic resonance of hypertrophic heart phenotype: A review

Affiliations
Review

Cardiac magnetic resonance of hypertrophic heart phenotype: A review

Davide Tore et al. Heliyon. .

Abstract

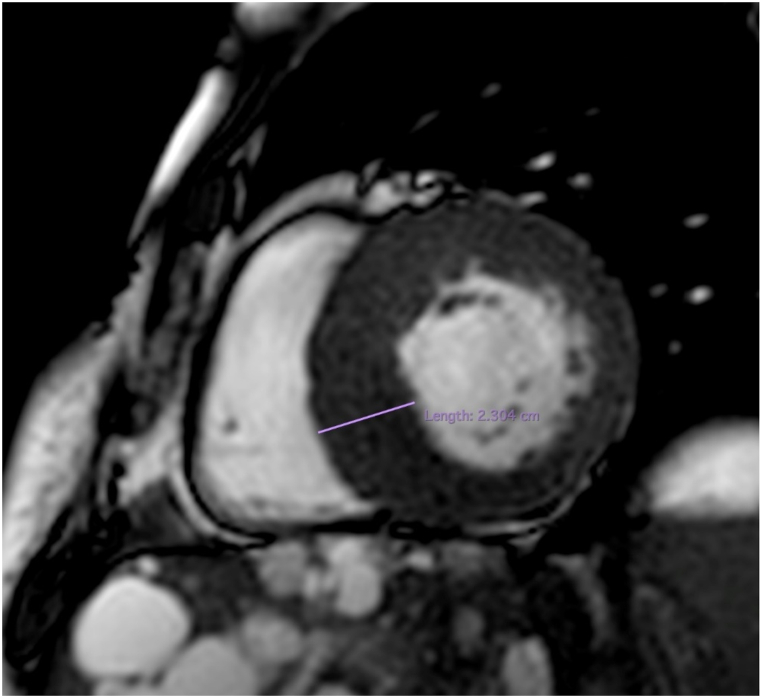
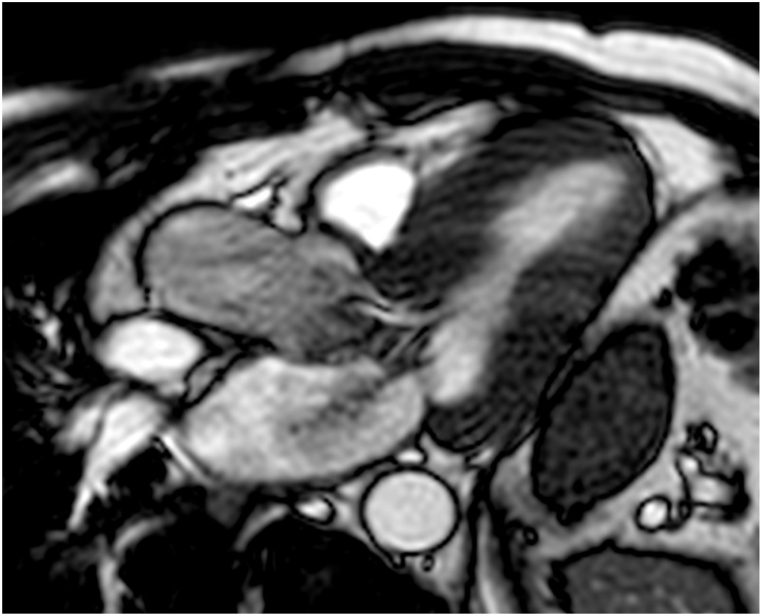
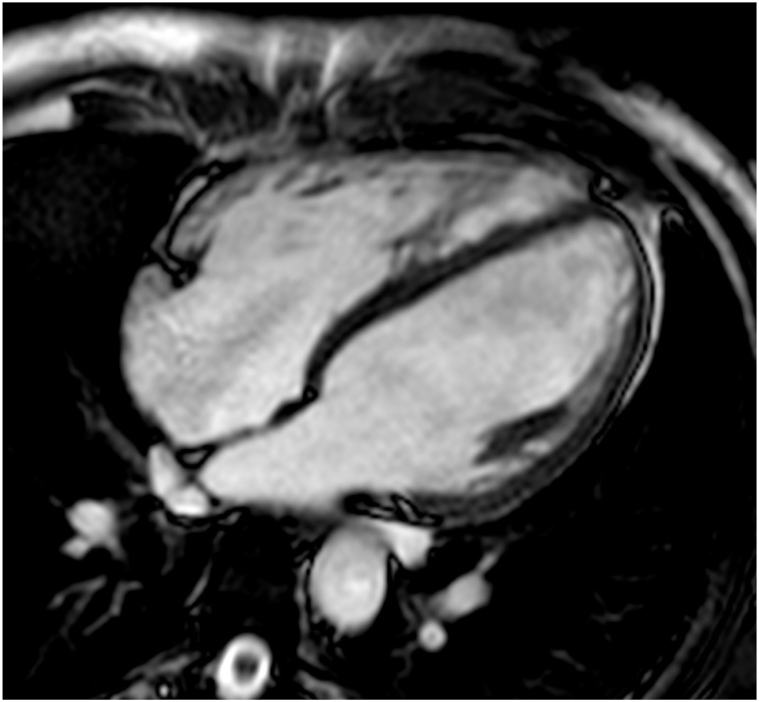
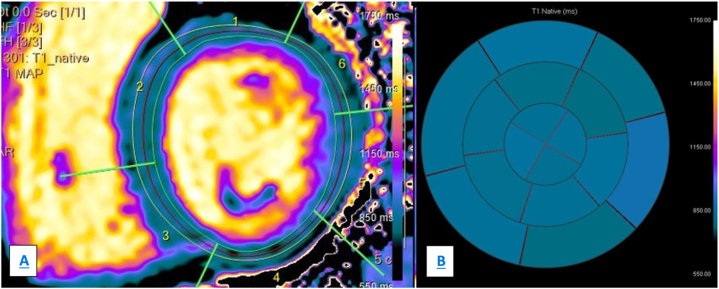
Hypertrophic heart phenotype is characterized by an abnormal left ventricular (LV) thickening. A hypertrophic phenotype can develop as adaptive response in many different conditions such as aortic stenosis, hypertension, athletic training, infiltrative heart muscle diseases, storage disorders and metabolic disorders. Hypertrophic cardiomyopathy (HCM) is the most frequent primary cardiomyopathy (CMP) and a genetical cause of cardiac hypertrophy. It requires the exclusion of any other cause of LV hypertrophy. Cardiac magnetic resonance (CMR) is a comprehensive imaging technique that allows a detailed evaluation of myocardial diseases. It provides reproducible measurements and myocardial tissue characterization. In clinical practice CMR is increasingly used to confirm the presence of ventricular hypertrophy, to detect the underlying cause of the phenotype and more recently as an efficient prognostic tool. This article aims to provide a detailed overview of the applications of CMR in the setting of hypertrophic heart phenotype and its role in the diagnostic workflow of such condition.

Keywords: Amyloidosis; Anderson-fabry disease; CMR; Cardiac hypertrophy; HCM; Iron overload; Sarcoidosis.


Conflict of interest statement

The authors declare the following financial interests/personal relationships which may be considered as potential competing interests:Marco Gatti MD is a Guest editor for Heliyon Clinical Research.

Figures

Fig. 1
Fig. 1
SSFP, short axis view: example of LV and RV contouring process in the diastolic phase.
Fig. 2
Fig. 2
SSFP, short axis view: interventricular septum hypertrophy (23 mm) in patient with HCM.
Fig. 3
Fig. 3
SSFP long-axis, 3-chamber view: SAM at the level of LVOT in a patient with HCM.
Fig. 4
Fig. 4
SSFP long-axis, 4-chamber view: bi-atrial and bi-ventricular dilatation in a patient with athlete's heart.
Fig. 5
Fig. 5
Inversion recovery sequence to evaluate LGE, 4-chamber view: the image shows diffuse subendocardial LV LGE in a Patient with aTTR amyloidosis with cardiac involvement. LGE is also visible both in left and right atrium.
Fig. 6
Fig. 6
Native T1 mapping, panel A shows the segmentation process to calculate nT1 values in the same patient in Fig. 5. Panel B (bull's eye) shows the results: nT1 values are elevated (within 1213 ms).
Fig. 7
Fig. 7
T2 mapping. Panel A shows the segmentation process, panel B (bull's eye) shows the resulting values of T2 mapping, increased.
Fig. 8
Fig. 8
Inversion recovery sequence to evaluate LGE, short axis view: patient with history of isolated cardiac sarcoidosis. Short axis view shows LGE at the inferior hinge point at medium level on the infero-septal wall of LV.
Fig. 9
Fig. 9
Native T1 mapping, panel A shows the segmentation process to calculate nT1 values in a patient with Fabry disease; panel B (bull's eye) shows the results: the mean values are mildly reduced.
Fig. 10
Fig. 10
Native T1 mapping, panel A shows the segmentation process to evaluate nT1 values in a patient affected by cardiac iron overload. Panel B (bull's eye) shows the results: nT1 values are reduced (819–842 ms).
Fig. 11
Fig. 11
T2* mapping, panel A shows the segmentation process to calculate the T2* values in the same patient of Fig. 10. Resulting values are shown in panel B: mean T2* values are low (15 ms, normal range >20 ms).

Similar articles

Cited by

References

    1. Pradella S., Grazzini G., de Amicis C., Letteriello M., Acquafresca M., Miele V. Cardiac magnetic resonance in hypertrophic and dilated cardiomyopathies. Radiologia Medica. 2020;125:1056–1071. doi: 10.1007/s11547-020-01276-x. - DOI - PubMed
    1. Stachera M., Przybyło P., Sznajder K., Gierlotka M. Cardiac magnetic resonance in the assessment of hypertrophic cardiomyopathy phenotypes and stages – pictorial review. Pol. J. Radiol. 2021;86:672–684. doi: 10.5114/pjr.2021.112310. - DOI - PMC - PubMed
    1. Proctor R.D., Shambrook J.S., McParland P., Peebles C.R., Brown I.W., Harden S.P. Imaging hypertrophic heart diseases with cardiovascular MR. Clin. Radiol. 2011;66:176–186. doi: 10.1016/j.crad.2010.09.008. - DOI - PubMed
    1. Baggiano A., del Torto A., Guglielmo M., Muscogiuri G., Fusini L., Babbaro M., Collevecchio A., Mollace R., Scafuri S., Mushtaq S., Conte E., Annoni A.D., Formenti A., Mancini M.E., Mostardini G., Andreini D., Guaricci A.I., Pepi M., Fontana M., Pontone G. Role of CMR mapping techniques in cardiac hypertrophic phenotype. Diagnostics. 2020;10 doi: 10.3390/diagnostics10100770. - DOI - PMC - PubMed
    1. Chinali M., Aurigemma G.P. Editorial: refining patterns of left ventricular hypertrophy using cardiac MRI: “Brother, can you spare a paradigm? Circ Cardiovasc Imaging. 2010;3:129–131. doi: 10.1161/CIRCIMAGING.110.944959. - DOI - PubMed

LinkOut - more resources