

Association between long-term exposure to ambient air pollutants and the risk of tuberculosis: A time-series study in Nantong, China
- PMID: 37441410
- PMCID: PMC10333459
- DOI: 10.1016/j.heliyon.2023.e17347
Association between long-term exposure to ambient air pollutants and the risk of tuberculosis: A time-series study in Nantong, China
Abstract
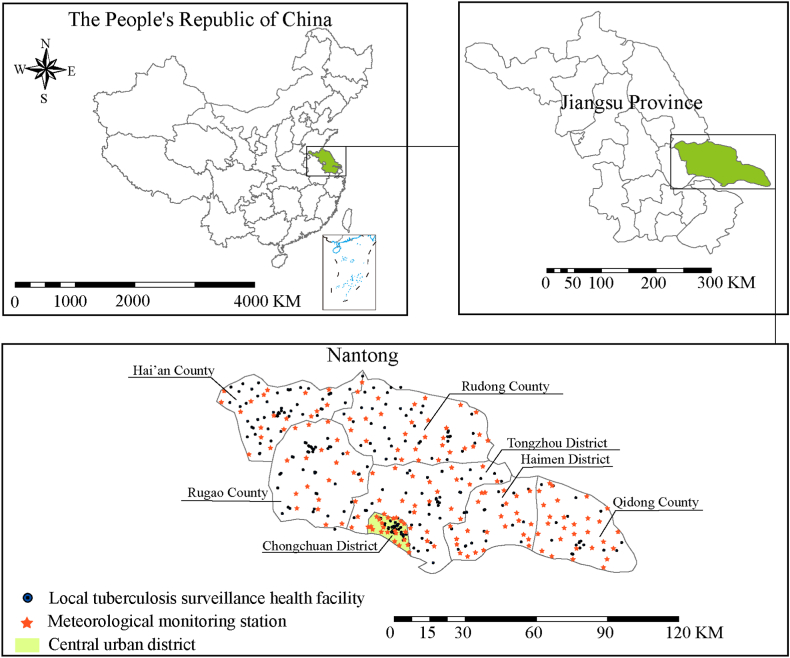
Background: Increasing evidence has shown that the risk of tuberculosis (TB) might be related to the exposure to air pollutants; however, the findings are inconsistent and studies on long-term air pollutant exposure and TB risk are scarce. This study aime to assess the relationship between monthly exposure to air pollution and TB risk in Nantong, China.
Methods: We collected the time series data on the number of TB cases, as well as environmental and socioeconomic covariates from January 2005 to December 2020. The impact of air pollutant exposure on TB risk was evaluated using the distributed lag nonlinear model (DLNM). Stratified analyses were conducted to examine the effect modifications of sex and age on the association between air pollutants and TB risk. Sensitivity analyses were applied to test the stability of the model.
Results: There were a total of 54,096 cases of TB in Nantong during the study period. In the single-pollutant model, for each 10 μg/m3 increase in concentration, the pooled relative risks (RRs) of TB reached the maximum to 1.10 (95% confidence interval (CI): 1.04-1.16, lag 10 months) for particulate matter with aerodynamic diameter less than 2.5 μm (PM2.5), 1.05 (95% CI: 1.01-1.10, lag 9 months) for particulate matter with aerodynamic diameter less than 10 μm (PM10), and 1.11 (95%CI: 1.04-1.19, lag 10 months) for nitrogen dioxide (NO2). Ozone (O3) did not show significant effect on TB risk. Effect modifications of sex and age on the association between air pollutants and TB risk were not observed. The multi-pollutant model results showed no significant variation compared with the single-pollutant model.
Conclusions: Our study suggests that air pollutants pose a substantial threat to the TB risk. Reducing air pollution might be crucial for TB prevention and control.
Keywords: Air pollution; Distributed lag non-linear model; Tuberculosis.
© 2023 The Authors.
Conflict of interest statement
The authors declare that they have no known competing financial interests or personal relationships that could have appeared to influence the work reported in this paper.
Figures


Similar articles
-
Association between short-term exposure to ambient air pollutants and the risk of tuberculosis outpatient visits: A time-series study in Hefei, China.Environ Res. 2020 May;184:109343. doi: 10.1016/j.envres.2020.109343. Epub 2020 Mar 3. Environ Res. 2020. PMID: 32192989
-
Effects of short-term exposure to air pollution on hospital admissions of young children for acute lower respiratory infections in Ho Chi Minh City, Vietnam.Res Rep Health Eff Inst. 2012 Jun;(169):5-72; discussion 73-83. Res Rep Health Eff Inst. 2012. PMID: 22849236
-
Short-term effect of ambient air pollutant change on the risk of tuberculosis outpatient visits: a time-series study in Fuyang, China.Environ Sci Pollut Res Int. 2022 Apr;29(20):30656-30672. doi: 10.1007/s11356-021-17323-7. Epub 2022 Jan 7. Environ Sci Pollut Res Int. 2022. PMID: 34993790
-
Short-term exposure to particulate matter (PM10 and PM2.5), nitrogen dioxide (NO2), and ozone (O3) and all-cause and cause-specific mortality: Systematic review and meta-analysis.Environ Int. 2020 Sep;142:105876. doi: 10.1016/j.envint.2020.105876. Epub 2020 Jun 23. Environ Int. 2020. PMID: 32590284
-
Association between exposure to ambient air pollution and hospital admission, incidence, and mortality of stroke: an updated systematic review and meta-analysis of more than 23 million participants.Environ Health Prev Med. 2021 Jan 26;26(1):15. doi: 10.1186/s12199-021-00937-1. Environ Health Prev Med. 2021. PMID: 33499804 Free PMC article.
Cited by
-
Ambient air pollution contributed to pulmonary tuberculosis in China.Emerg Microbes Infect. 2024 Dec;13(1):2399275. doi: 10.1080/22221751.2024.2399275. Epub 2024 Sep 5. Emerg Microbes Infect. 2024. PMID: 39206812 Free PMC article.
-
Association of ambient PM2.5 concentration with tuberculosis reactivation diseases-an integrated spatio-temporal analysis.IJID Reg. 2023 Aug 10;8:145-152. doi: 10.1016/j.ijregi.2023.08.001. eCollection 2023 Sep. IJID Reg. 2023. PMID: 37674566 Free PMC article.
-
Spatio-Temporal Pattern of Tuberculosis Distribution in Romania and Particulate Matter Pollution Associated With Risk of Infection.Geohealth. 2024 Feb 6;8(2):e2023GH000972. doi: 10.1029/2023GH000972. eCollection 2024 Feb. Geohealth. 2024. PMID: 38638801 Free PMC article.
-
Predicting Tuberculosis Risk in Cattle, Buffaloes, Sheep, and Goats in China Based on Air Pollutants and Meteorological Factors.Animals (Basel). 2024 Dec 22;14(24):3704. doi: 10.3390/ani14243704. Animals (Basel). 2024. PMID: 39765608 Free PMC article.
-
Association between ambient particulate matter and latent tuberculosis infection among 198 275 students.J Glob Health. 2024 Dec 13;14:04244. doi: 10.7189/jogh.14.04244. J Glob Health. 2024. PMID: 39666581 Free PMC article.
References
-
- Cohen A.J., Brauer M., Burnett R., et al. Estimates and 25-year trends of the global burden of disease attributable to ambient air pollution: an analysis of data from the Global Burden of Diseases Study. Lancet. 2015;389(10082):1907–1918. doi: 10.1016/S0140-6736(17)30505-6. 2017. - DOI - PMC - PubMed
LinkOut - more resources
Full Text Sources
