

Investigating ionizing radiation-induced changes in breast cancer cells using stimulated Raman scattering microscopy
- PMID: 37441447
- PMCID: PMC10335321
- DOI: 10.1117/1.JBO.28.7.076501
Investigating ionizing radiation-induced changes in breast cancer cells using stimulated Raman scattering microscopy
Abstract
Significance: Altered lipid metabolism of cancer cells has been implicated in increased radiation resistance. A better understanding of this phenomenon may lead to improved radiation treatment planning. Stimulated Raman scattering (SRS) microscopy enables label-free and quantitative imaging of cellular lipids but has never been applied in this domain.
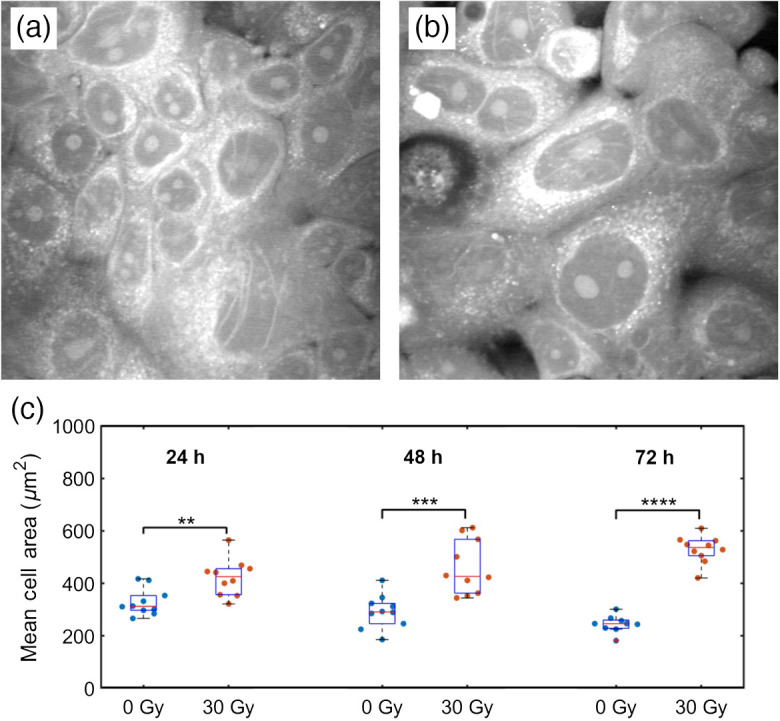
Aim: We sought to investigate the radiobiological response in human breast cancer MCF7 cells using SRS microscopy, focusing on how radiation affects lipid droplet (LD) distribution and cellular morphology.
Approach: MCF7 breast cancer cells were exposed to either 0 or 30 Gy (X-ray) ionizing radiation and imaged using a spectrally focused SRS microscope every 24 hrs over a 72-hr time period. Images were analyzed to quantify changes in LD area per cell, lipid and protein content per cell, and cellular morphology. Cell viability and confluency were measured using a live cell imaging system while radiation-induced lipid peroxidation was assessed using BODIPY C11 staining and flow cytometry.
Results: The LD area per cell and total lipid and protein intensities per cell were found to increase significantly for irradiated cells compared to control cells from 48 to 72 hrs post irradiation. Increased cell size, vacuole formation, and multinucleation were observed as well. No significant cell death was observed due to irradiation, but lipid peroxidation was found to be greater in the irradiated cells than control cells at 72 hrs.
Conclusions: This pilot study demonstrates the potential of SRS imaging for investigating ionizing radiation-induced changes in cancer cells without the use of fluorescent labels.
Keywords: ionizing radiation; lipids imaging; stimulated Raman scattering microscopy.
© 2023 The Authors.
Figures


Similar articles
-
Label-Free Imaging of Lipid Droplets in Prostate Cells Using Stimulated Raman Scattering Microscopy and Multivariate Analysis.Anal Chem. 2022 Jun 28;94(25):8899-8908. doi: 10.1021/acs.analchem.2c00236. Epub 2022 Jun 14. Anal Chem. 2022. PMID: 35699644 Free PMC article.
-
Label-Free Imaging of Lipid Storage Dynamics in Caenorhabditis elegans using Stimulated Raman Scattering Microscopy.J Vis Exp. 2021 May 28;(171). doi: 10.3791/61870. J Vis Exp. 2021. PMID: 34125101
-
Biochemical signatures of in vitro radiation response in human lung, breast and prostate tumour cells observed with Raman spectroscopy.Phys Med Biol. 2011 Nov 7;56(21):6839-55. doi: 10.1088/0031-9155/56/21/006. Epub 2011 Oct 5. Phys Med Biol. 2011. PMID: 21971286
-
Stimulated Raman scattering microscopy in chemistry and life science - Development, innovation, perspectives.Biotechnol Adv. 2022 Nov;60:108003. doi: 10.1016/j.biotechadv.2022.108003. Epub 2022 Jun 9. Biotechnol Adv. 2022. PMID: 35690271 Review.
-
Imaging chemistry inside living cells by stimulated Raman scattering microscopy.Methods. 2017 Sep 1;128:119-128. doi: 10.1016/j.ymeth.2017.07.020. Epub 2017 Jul 23. Methods. 2017. PMID: 28746829 Review.
References
Publication types
MeSH terms
Substances
LinkOut - more resources
Full Text Sources
Medical
Research Materials
