. 2023 Jun 26;13(11):3744-3760.
doi: 10.7150/thno.81407. eCollection 2023.

Single-cell RNA sequencing identifies critical transcription factors of tumor cell invasion induced by hypoxia microenvironment in glioblastoma

Affiliations

Single-cell RNA sequencing identifies critical transcription factors of tumor cell invasion induced by hypoxia microenvironment in glioblastoma

Yanru Zhang et al. Theranostics. .

Abstract

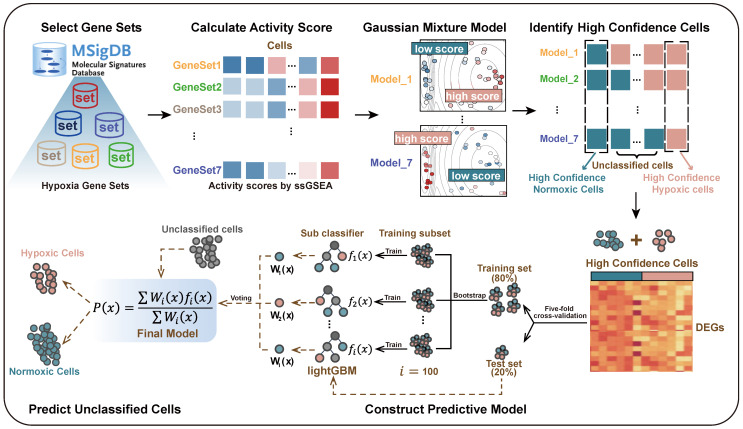
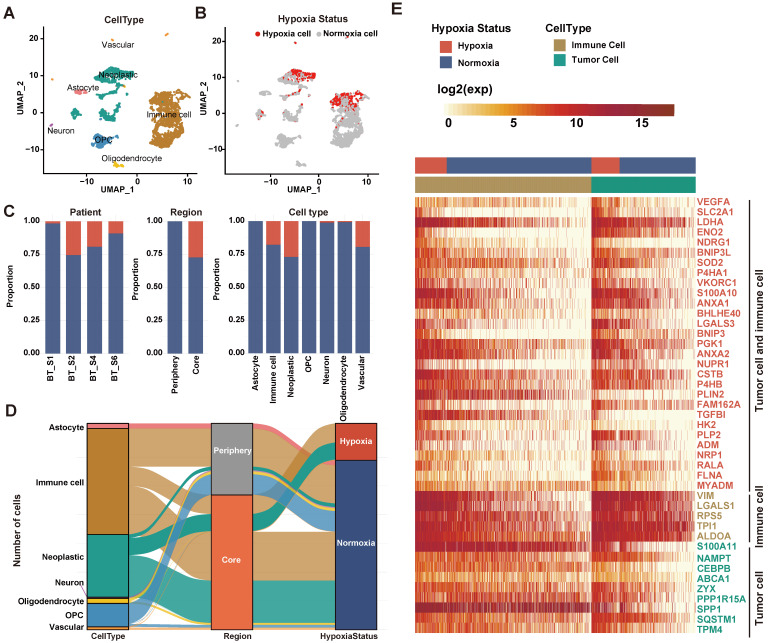
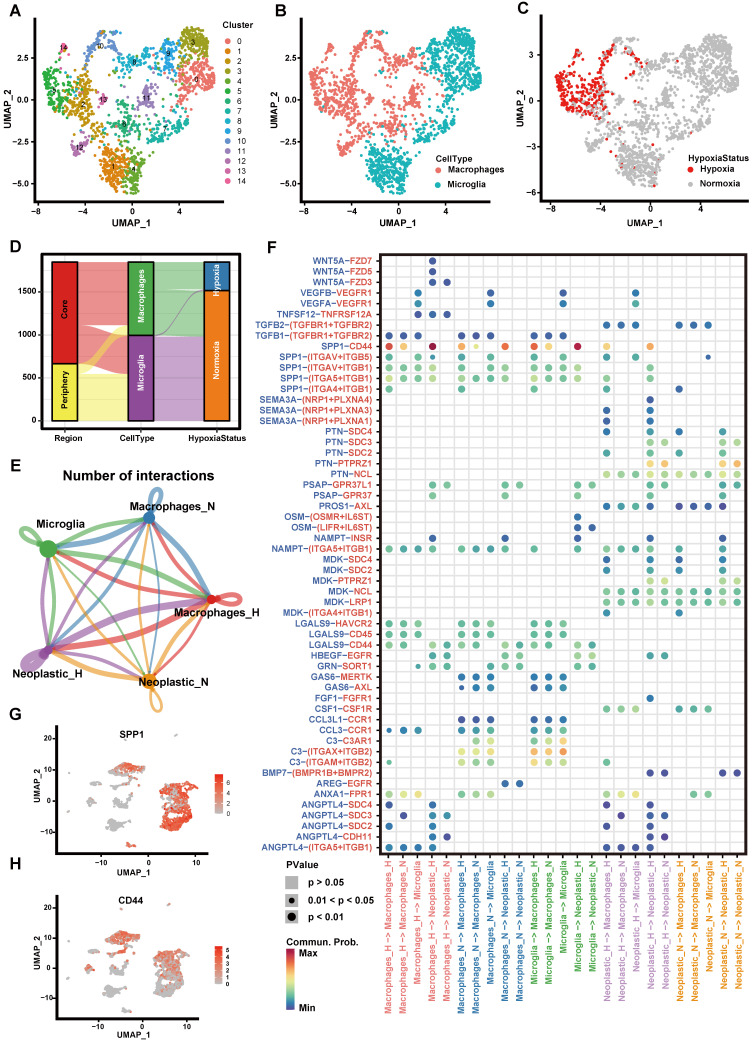
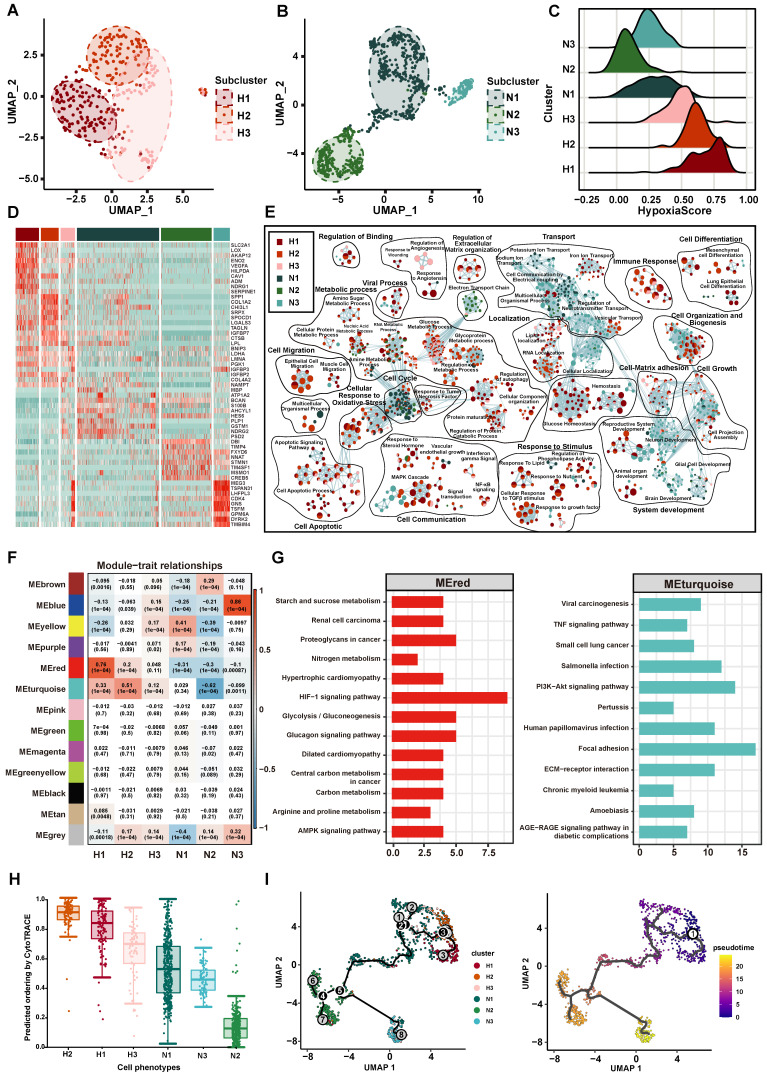
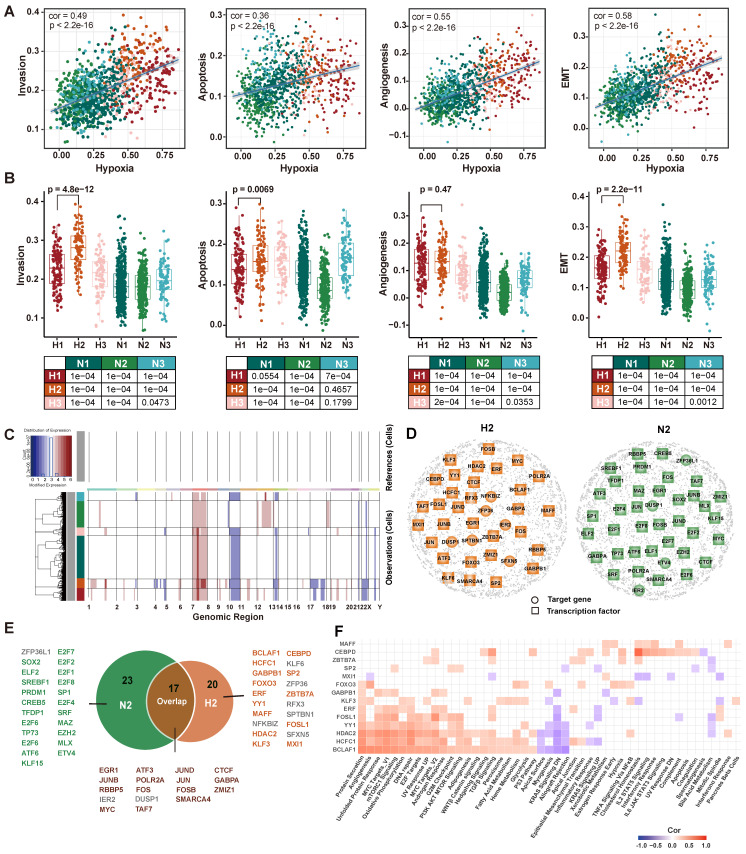
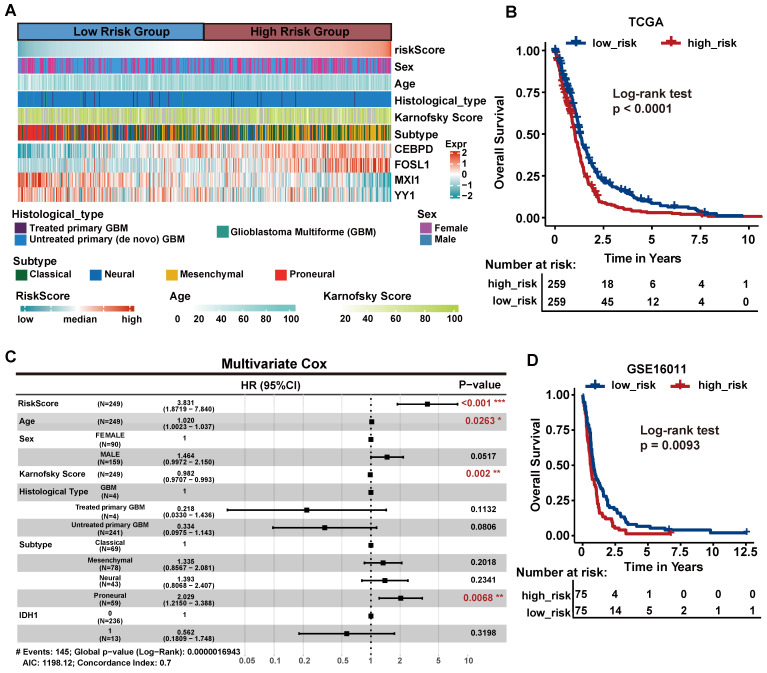
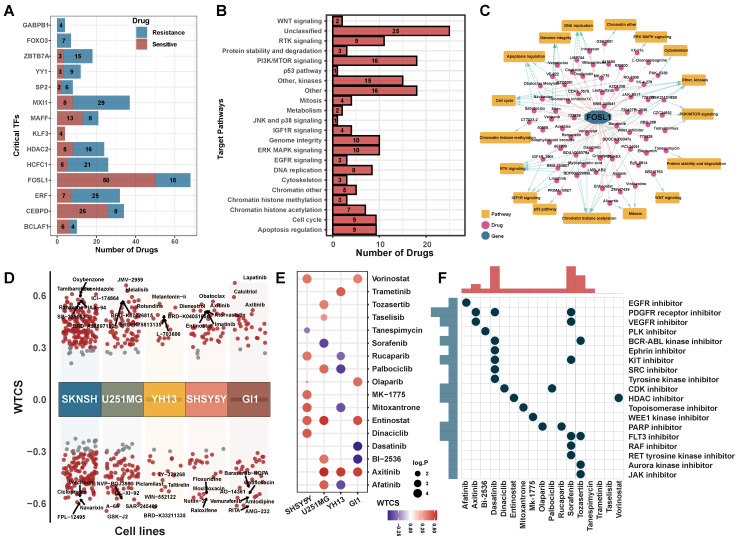
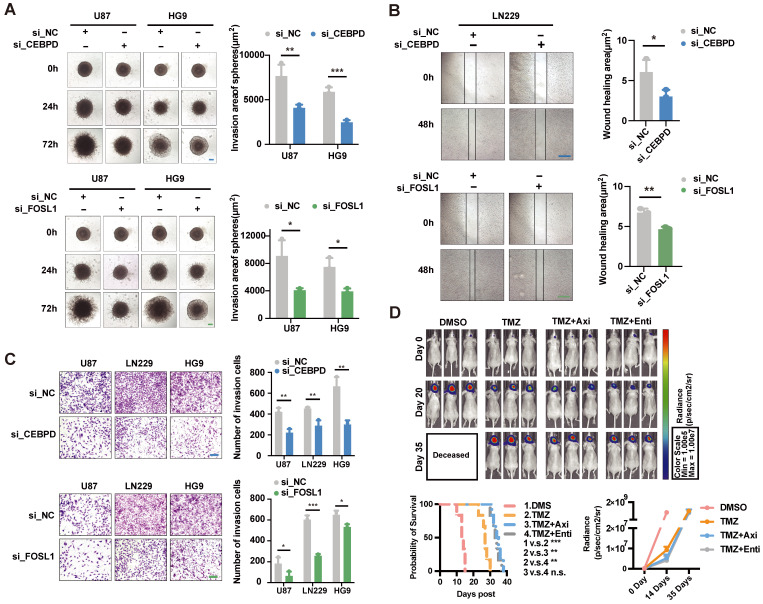
Rationale: Glioblastoma (GBM) is an aggressive malignant primary brain cancer with poor survival. Hypoxia is a hallmark of GBM, which promotes tumor cells spreading (invasion) into the healthy brain tissue. Methods: To better elucidate the influence of hypoxia on GBM invasion, we proposed a data-driven modeling framework for predicting cellular hypoxia (CHPF) by integrating single cell transcriptome profiling and hypoxia gene signatures. Results: We characterized the hypoxia status landscape of GBM cells and observed that hypoxic cells were only present in the tumor core. Then, by investigating the cell-cell communication between immune cells and tumor cells, we discovered significant interaction between macrophages and tumor cells in hypoxic microenvironment. Notably, we dissected the functional heterogeneity of tumor cells and identified a hypoxic subpopulation that had highly invasive potential. By constructing cell status specific gene regulatory networks, we further identified 14 critical regulators of tumor invasion induced by hypoxic microenvironment. Finally, we confirmed that knocking down two critical regulators CEBPD and FOSL1 could reduce the invasive ability of GBM under hypoxic conditions. Additionally, we revealed the therapeutic effect of Axitinib and Entinostat through the mice model. Conclusion: Our work revealed the critical regulators in hypoxic subpopulation with high invasive potential in GBM, which may have practical implications for clinical targeted-hypoxia cancer drug therapy.

Keywords: glioblastoma; hypoxia status; invasion; regulators; single-cell RNA sequencing.


Conflict of interest statement

Competing Interests: The authors have declared that no competing interest exists.

Figures

Figure 1
Figure 1
Overview of the cellular hypoxia predicting framework (CHPF).
Figure 2
Figure 2
Defining cellular hypoxia status in GBM. (A) UMAP plot of all the 3,589 single cells in 4 primary GBMs. Cell types were differentiated by colors. (B) UMAP plot of all single cells colored by hypoxia status. (C) Distribution of hypoxic cells in different patients, regions and cell types. (D) Sankey diagram showing the connection of cell types, cell- originating regions and hypoxia status. (E) Expression profile of hypoxia-related genes. The 29 red-colored genes were identified as important hypoxia-related genes in both tumor cells and immune cells, the five brown-colored genes were only identified as important hypoxia-related genes in immune cells, and the nine green-colored genes were only identified as important hypoxia-related genes in tumor cells.
Figure 3
Figure 3
Cell-cell communication between immune cells and tumor cells. (A-C) The UMAP plot showing immune cells. (A) Different colors labeled for 15 clusters, respectively. (B) Different colors labeled for different cell types. (C) Different colors labeled for different hypoxia status. (D) Sankey diagram showing the connection of cell types, cell collected regions and hypoxia status in immune cells. (E) Cell-cell interaction network of hypoxic tumor cells, normoxic tumor cells, microglia, hypoxic macrophages, normoxic macrophages. The node size represents the number of interactions. The width of the edge represents the number of significant ligand-receptor interactions in two cell types. (F) Bubble heatmap showing cells interaction strength for different ligand-receptor pairs. Dot size indicates p-value generated by the permutation test and dot color represents communication probabilities. Empty space indicates that the communication probability is zero. (G-H) The UMAP plot showing the SPP1 (G) and CD44 (H) expression level in all cell types.
Figure 4
Figure 4
The Characteristics of tumor cell subpopulation. (A-B) The UMAP plot showing hypoxic tumor cell subpopulations (A) and normoxic tumor cell subpopulations (B). Cell subpopulations are differentiated by colors. (C) Density distribution of hypoxia scores in six tumor cell subpopulations. (D) The heatmap plot of the top 10 differentially expressed genes in each subpopulation. (E) Enrichment map of biological pathways by marker genes in each subpopulation. Nodes in the network represent pathways and are colored by associated subpopulations. (F) The relationship between gene modules and subpopulations by WGCNA. (G) KEGG analysis of the MEred module (left) and MEturquoise module (right). (H) CytoTRACE score of each subpopulation. (I) Trajectory analysis of tumor cells, colored by each subpopulation (left) and pseudotime (right).
Figure 5
Figure 5
Transcriptomic and genomic analysis of hypoxia and invasion. (A) Correlation analysis of hypoxia with invasion, apoptosis, angiogenesis, and EMT. (B) Boxplot showing the invasion, apoptotic, angiogenesis, and EMT enrichment scores for each subpopulation. (C) Heatmap of the inferred CNAs across six tumor subpopulation cells, in which genes are sorted by genomic location. (D) GRNs of H2 subpopulation (left) and N2 subpopulation (right). Colored nodes imply the critical target genes (circle) or TFs (square). (E) The critical TFs and critical target genes identified from two GRNs. Green represents TFs recognized only in the N2 GRN, orange represents TFs recognized only in the H2 GRN, and brown represents TFs recognized in both GRNs. Gray represents target genes recognized in GRNs. (F) Correlation analysis between hallmark pathway enrichment scores and regulatory module enrichment scores. The enrichment scores were calculated by GSVA. Empty space indicates that the |cor| < 0.3 or p >0.05.
Figure 6
Figure 6
The survival analysis of critical TFs. (A) Heatmap of the expression of the four critical TFs in 518 GBM patients from TCGA cohort with clinical and histopathological characteristics. Patients were sorted by risk score. (B) Survival analysis based on the prognostic model in the TCGA cohort. Patients in the high-risk group had poor survival. Log-rank p < 0.0001. (C) Multivariate Cox regression analysis validated risk score as an independent prognostic factor in TCGA. (D) Survival analysis in an external validation set GSE16011.
Figure 7
Figure 7
Potential drugs targeting critical regulators. (A) The number of potential drugs targeting each critical TF. (B) Signaling pathways targeted by predicted potential drugs. (C) The network of FOSL1-related drugs and signaling pathways. The pink line indicated a positive correlation and the gray line indicated a negative correlation. Blue dotted line indicated the relationship between drug and regulated signaling pathways. (D) Candidate drugs perturbed by DEGs of critical TFs targeted in five brain cancer cell lines. WTCS > 0 represented that the drug was positive to the gene signature, WTCS < 0 represented that the drug was negative to the gene signature, and near zero represented unrelated. (E) WTCS of 17 potential drugs identified in both two strategies. The dot color indicated the value of WTCS and the dot size indicated the significance level (-log10 P-value). (F) CMap mode of action (MoA) analysis of the 17 compounds.
Figure 8
Figure 8
Experimental validation of the effect of critical TFs and potential drugs in the hypoxia microenvironment. (A) Effects on tumor cell invasion ability after interfered CEBPD and FOSL1 with siRNA were examined by 3D sphere invasion assay in U87 and HG9 GBM cells under hypoxic conditions. Scale bar is 20 μm. Student's t-test, * P < 0.05, ** P < 0.01, *** P < 0.001. (B) The effect on tumor cell migration ability after interfered the CEBPD and FOSL1 with siRNA was examined by wound healing assay in LN229 GBM cells under hypoxic conditions. Scale bar is 50 μm. Student's t-test, * P < 0.05, ** P < 0.01, *** P < 0.001. (C) Effects on tumor cell invasion ability by Transwell invasion assay in U87, LN229 and HG9 GBM cells after interference of CEBPD and FOSL1 with siRNA under hypoxic conditions. Scale bars are 200 μm. Student's t-test, * P < 0.05, ** P < 0.01, *** P < 0.001. (D) Representative pictures and statistical plots of intracranial tumor size in mice after group treatment were shown by luciferase live imaging in an in situ tumorigenic mouse model constructed by U87 GBM cells, as well as statistics and analysis of survival in mice. Student's t-test and Log-rank (Mantel-Cox) test, * P < 0.05, ** P < 0.01, *** P < 0.001.

References

    1. Vollmann-Zwerenz A, Leidgens V, Feliciello G, Klein CA, Hau P. Tumor Cell Invasion in Glioblastoma. Int J Mol Sci. 2020;21:1932. - PMC - PubMed
    1. Louis DN, Perry A, Reifenberger G, von Deimling A, Figarella-Branger D, Cavenee WK. et al. The 2016 World Health Organization Classification of Tumors of the Central Nervous System: a summary. Acta Neuropathol. 2016;131:803–20. - PubMed
    1. Stupp R, Hegi ME, Mason WP, van den Bent MJ, Taphoorn MJ, Janzer RC. et al. Effects of radiotherapy with concomitant and adjuvant temozolomide versus radiotherapy alone on survival in glioblastoma in a randomised phase III study: 5-year analysis of the EORTC-NCIC trial. Lancet Oncol. 2009;10:459–66. - PubMed
    1. Ostrom QT, Gittleman H, Farah P, Ondracek A, Chen Y, Wolinsky Y. et al. CBTRUS statistical report: Primary brain and central nervous system tumors diagnosed in the United States in 2006-2010. Neuro Oncol. 2013;15(Suppl 2):ii1–56. - PMC - PubMed
    1. Lara-Velazquez M, Al-Kharboosh R, Jeanneret S, Vazquez-Ramos C, Mahato D, Tavanaiepour D. et al. Advances in Brain Tumor Surgery for Glioblastoma in Adults. Brain Sci. 2017;7(12):166. - PMC - PubMed

Substances