

Diagnostic accuracy of clinical signs and symptoms of COVID-19: A systematic review and meta-analysis to investigate the different estimates in a different stage of the pandemic outbreak
- PMID: 37441773
- PMCID: PMC10344460
- DOI: 10.7189/jogh.13.06026
Diagnostic accuracy of clinical signs and symptoms of COVID-19: A systematic review and meta-analysis to investigate the different estimates in a different stage of the pandemic outbreak
Abstract
Background: The coronavirus (COVID-19) pandemic caused enormous adverse socioeconomic impacts worldwide. Evidence suggests that the diagnostic accuracy of clinical features of COVID-19 may vary among different populations.
Methods: We conducted a systematic review and meta-analysis of studies from PubMed, Embase, Cochrane Library, Google Scholar, and the WHO Global Health Library for studies evaluating the accuracy of clinical features to predict and prognosticate COVID-19. We used the National Institutes of Health Quality Assessment Tool to evaluate the risk of bias, and the random-effects approach to obtain pooled prevalence, sensitivity, specificity, and likelihood ratios.
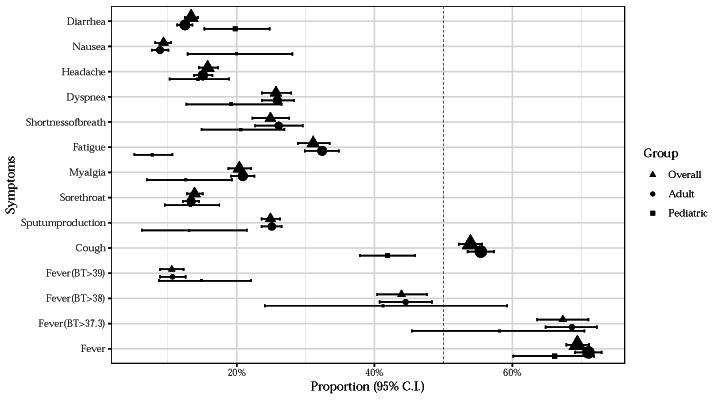
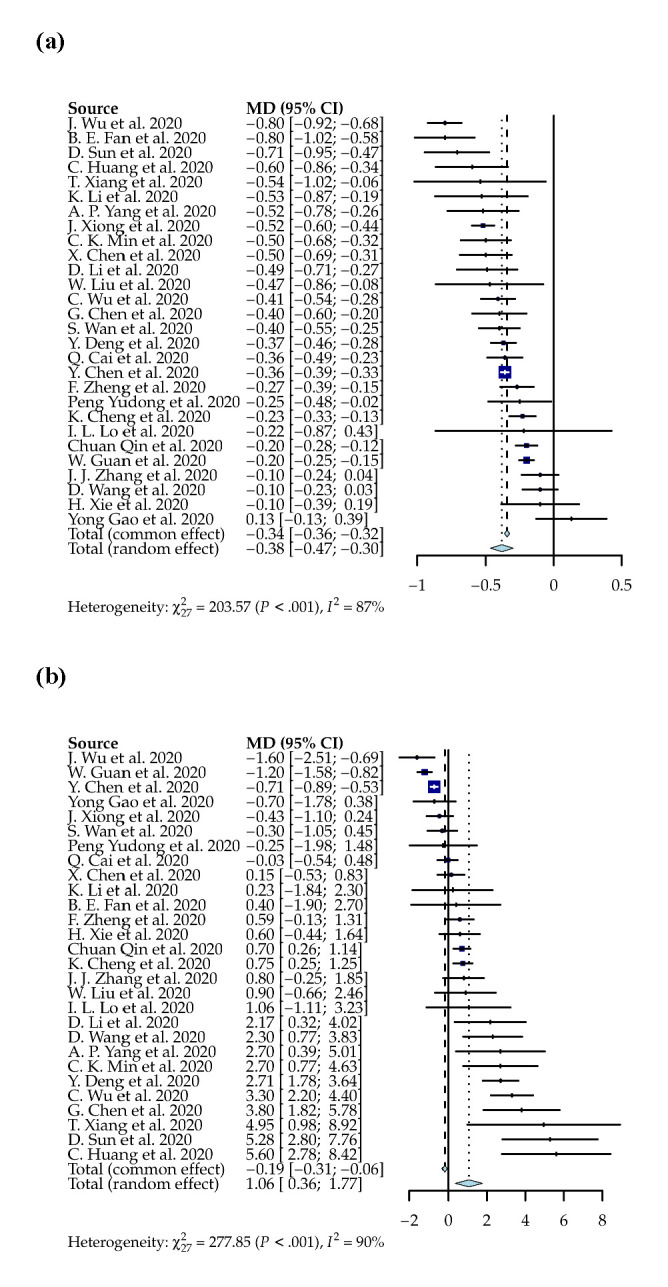
Results: Among the 189 included studies (53 659 patients), fever, cough, diarrhoea, dyspnoea, and fatigue were the most reported predictors. In the later stage of the pandemic, the sensitivity in predicting COVID-19 of fever and cough decreased, while the sensitivity of other symptoms, including sputum production, sore throat, myalgia, fatigue, dyspnoea, headache, and diarrhoea, increased. A combination of fever, cough, fatigue, hypertension, and diabetes mellitus increases the odds of having a COVID-19 diagnosis in patients with a positive test (positive likelihood ratio (PLR) = 3.06)) and decreases the odds in those with a negative test (negative likelihood ratio (NLR) = 0.59)). A combination of fever, cough, sputum production, myalgia, fatigue, and dyspnea had a PLR = 10.44 and an NLR = 0.16 in predicting severe COVID-19. Further updating the umbrella review (1092 studies, including 3 342 969 patients) revealed the different prevalence of symptoms in different stages of the pandemic.
Conclusions: Understanding the possible different distributions of predictors is essential for screening for potential COVID-19 infection and severe outcomes. Understanding that the prevalence of symptoms may change with time is important to developing a prediction model.
Copyright © 2023 by the Journal of Global Health. All rights reserved.
Conflict of interest statement
Disclosure of interest: The authors completed the ICMJE Disclosure of Interest Form (available upon request from the corresponding author) and disclose no relevant interests.
Figures


References
Publication types
MeSH terms
Grants and funding
LinkOut - more resources
Full Text Sources
Medical
