Review
. 2023 Sep 15:437:108838.
doi: 10.1016/j.heares.2023.108838. Epub 2023 Jul 4.

Latent neural dynamics encode temporal context in speech

Affiliations
Review

Latent neural dynamics encode temporal context in speech

Emily P Stephen et al. Hear Res. .

Abstract

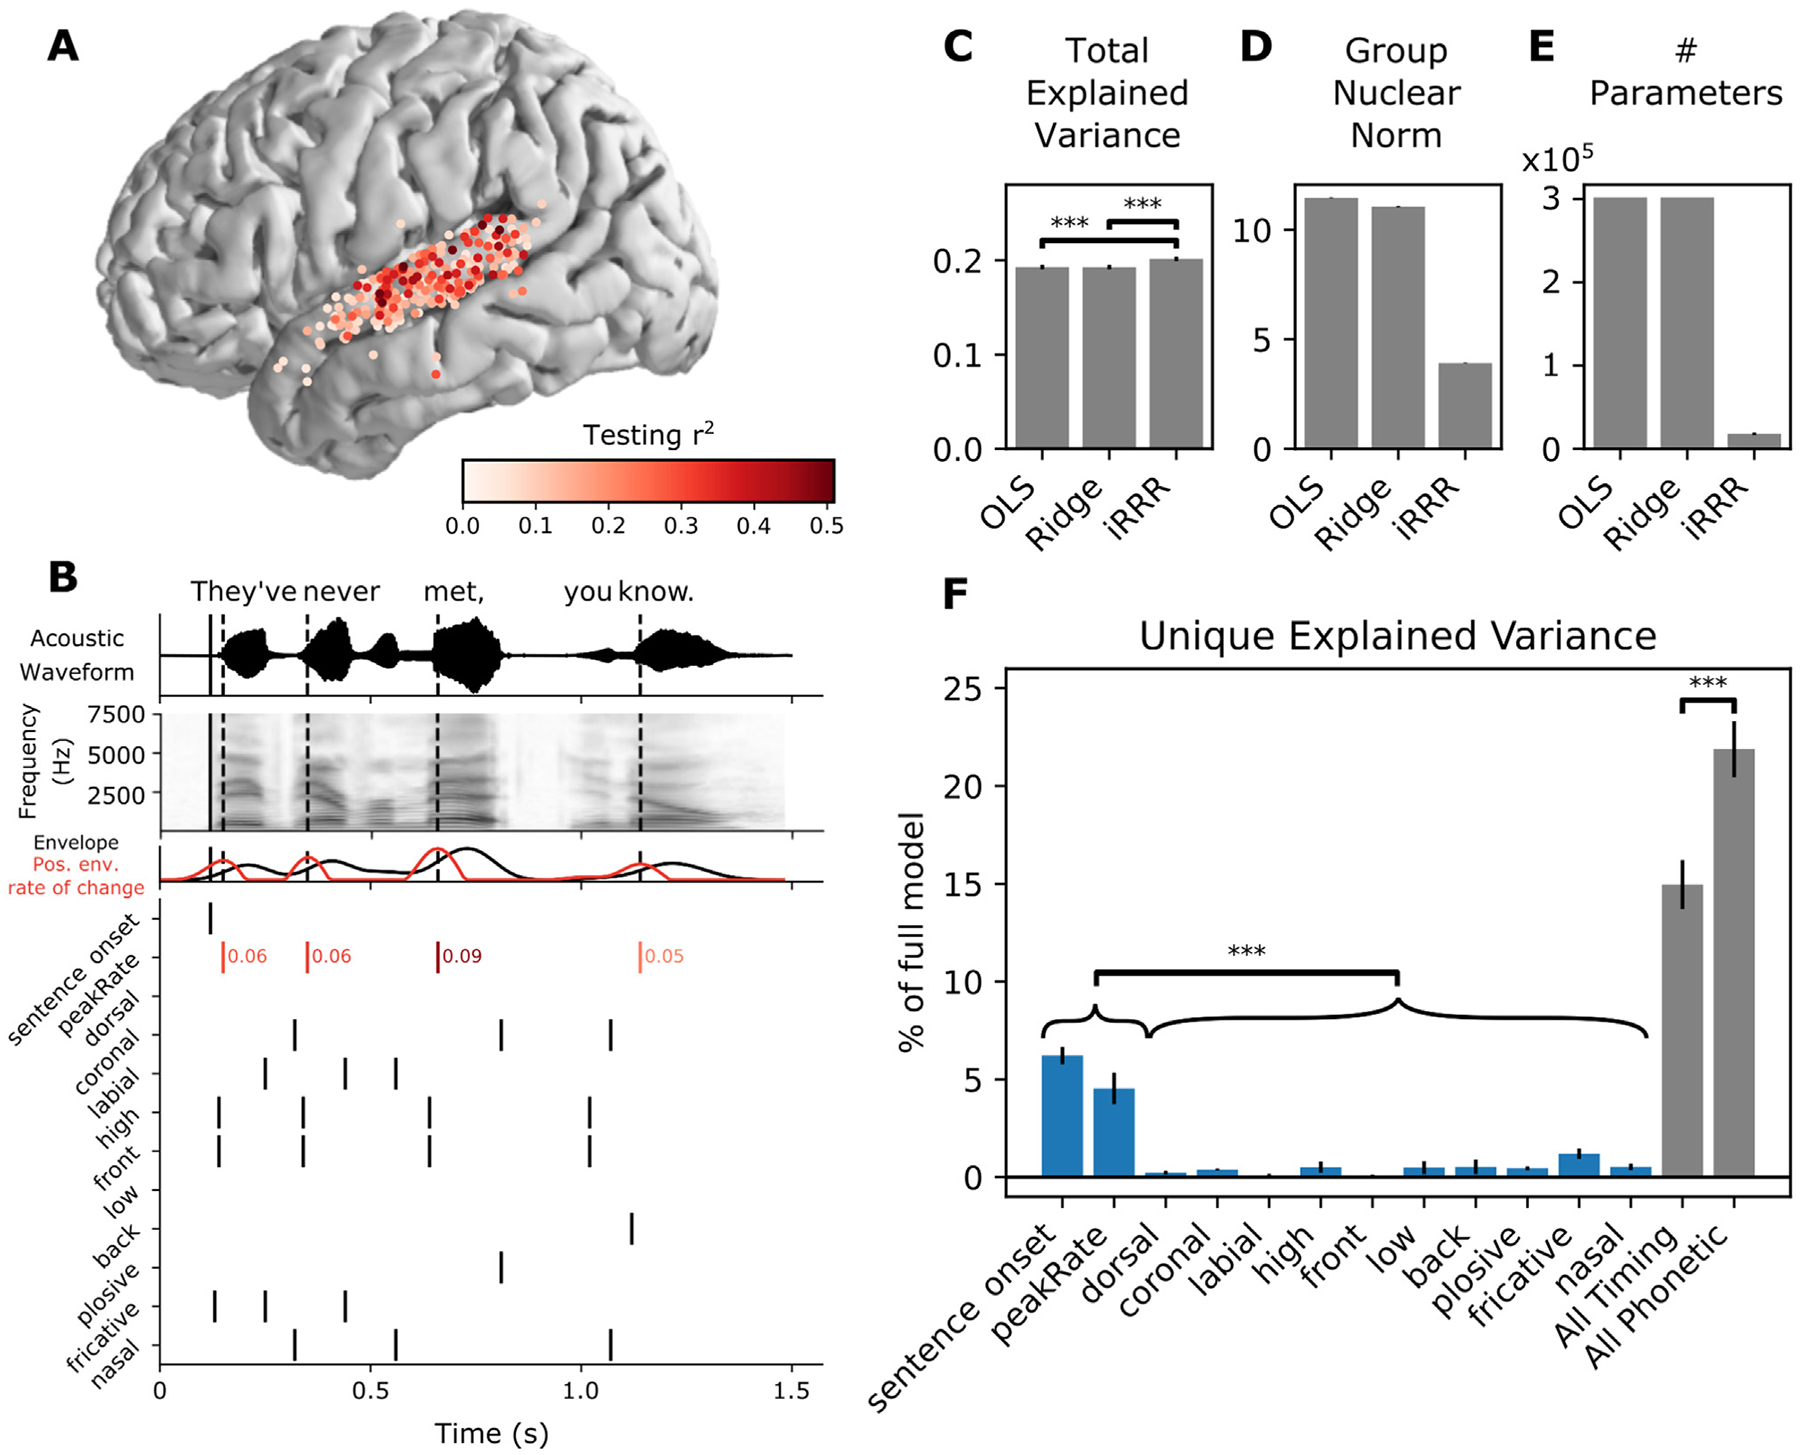
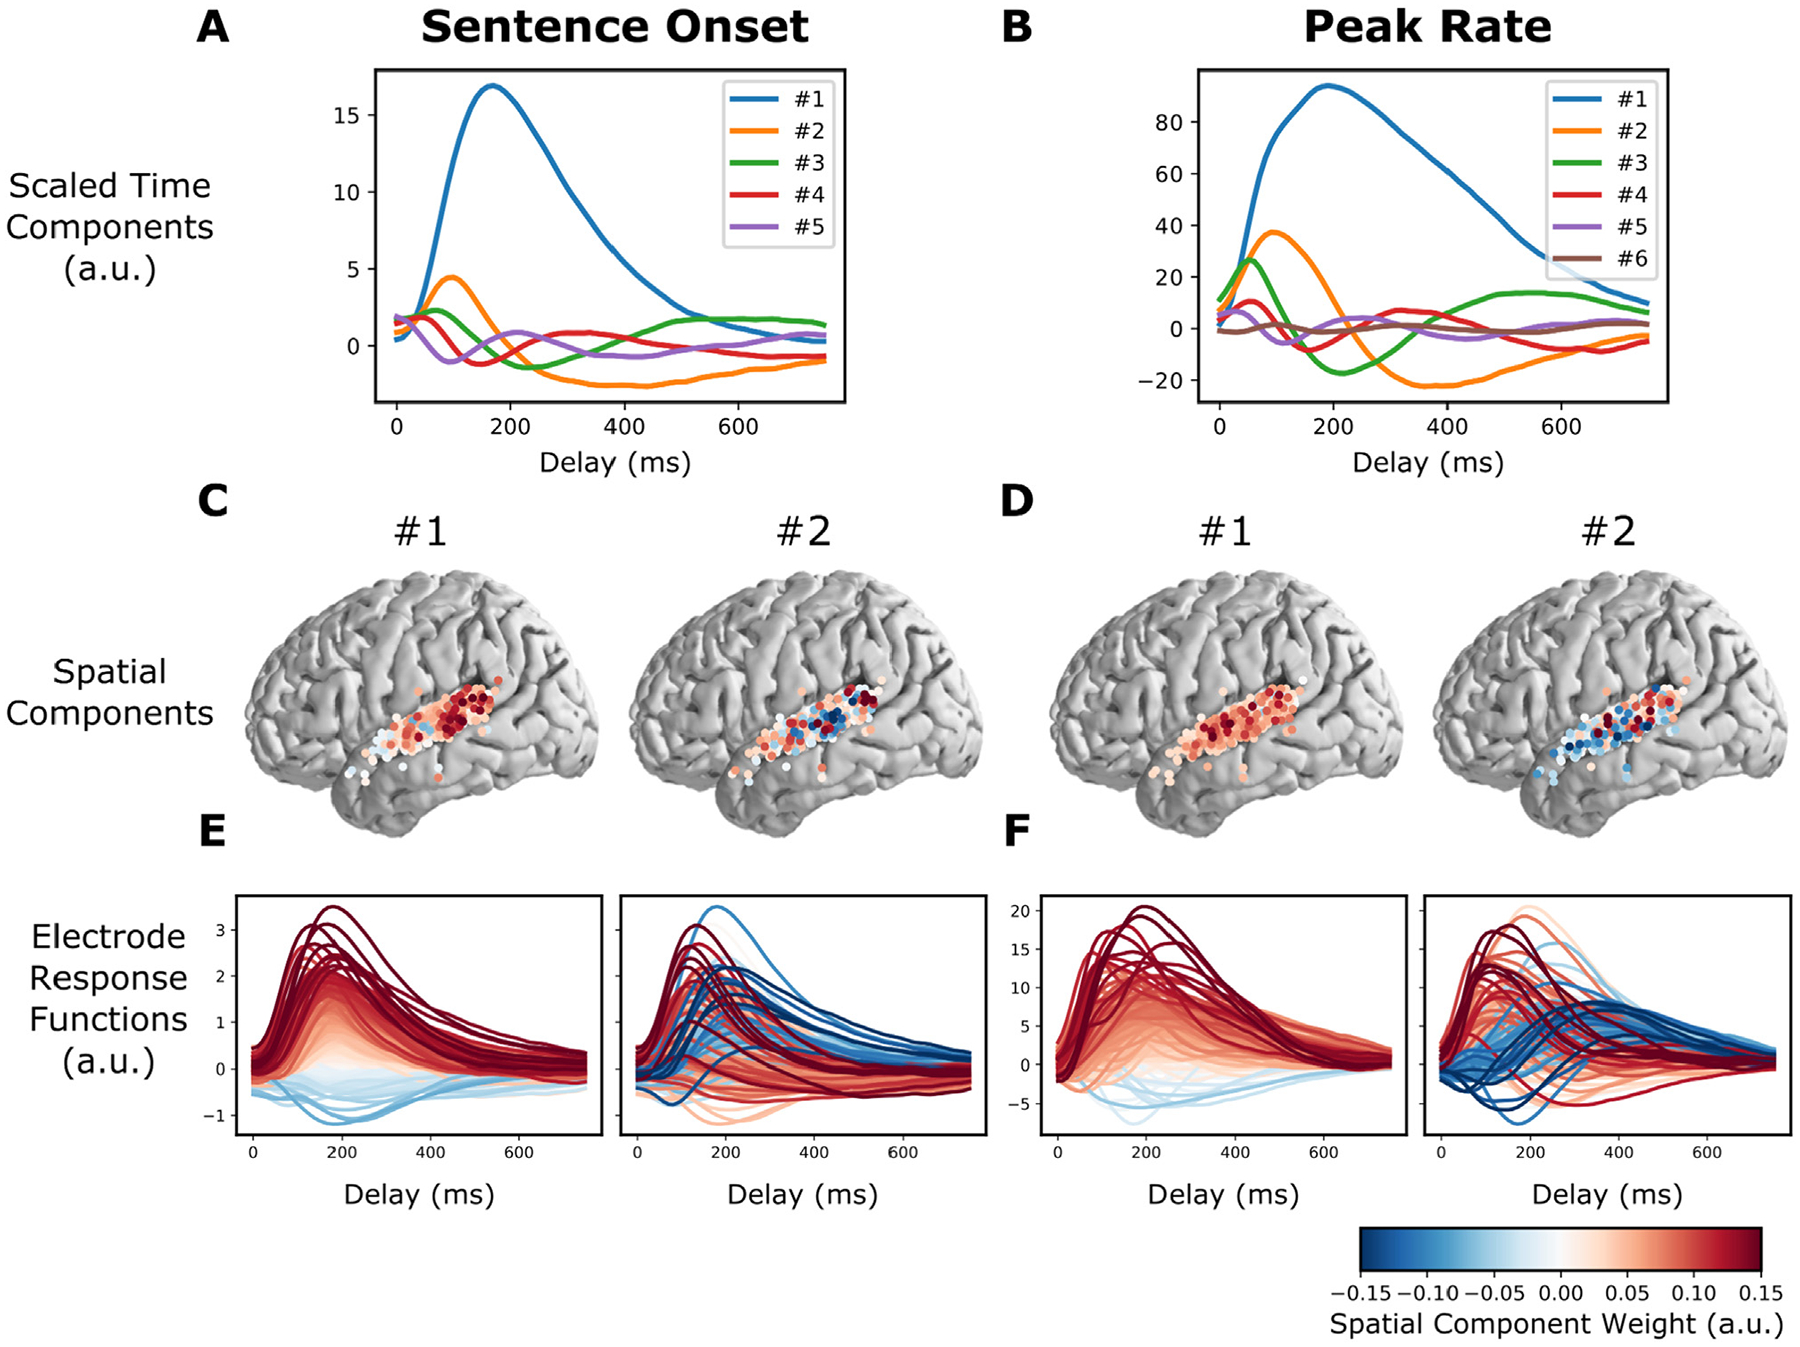
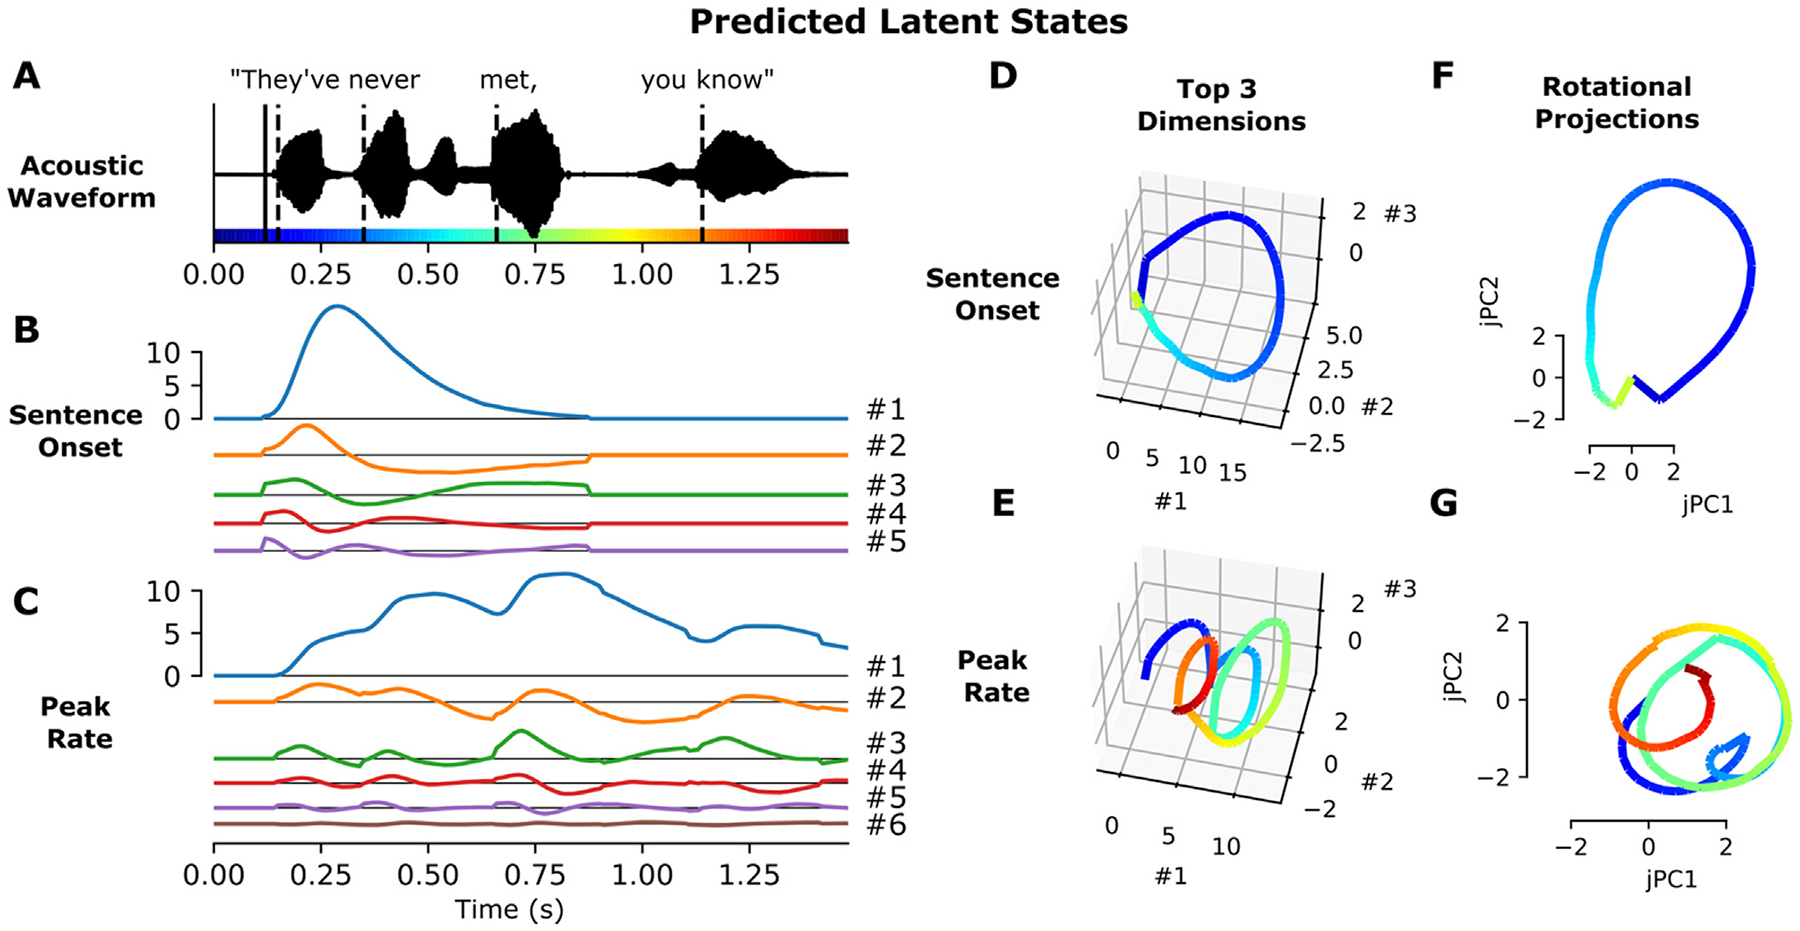
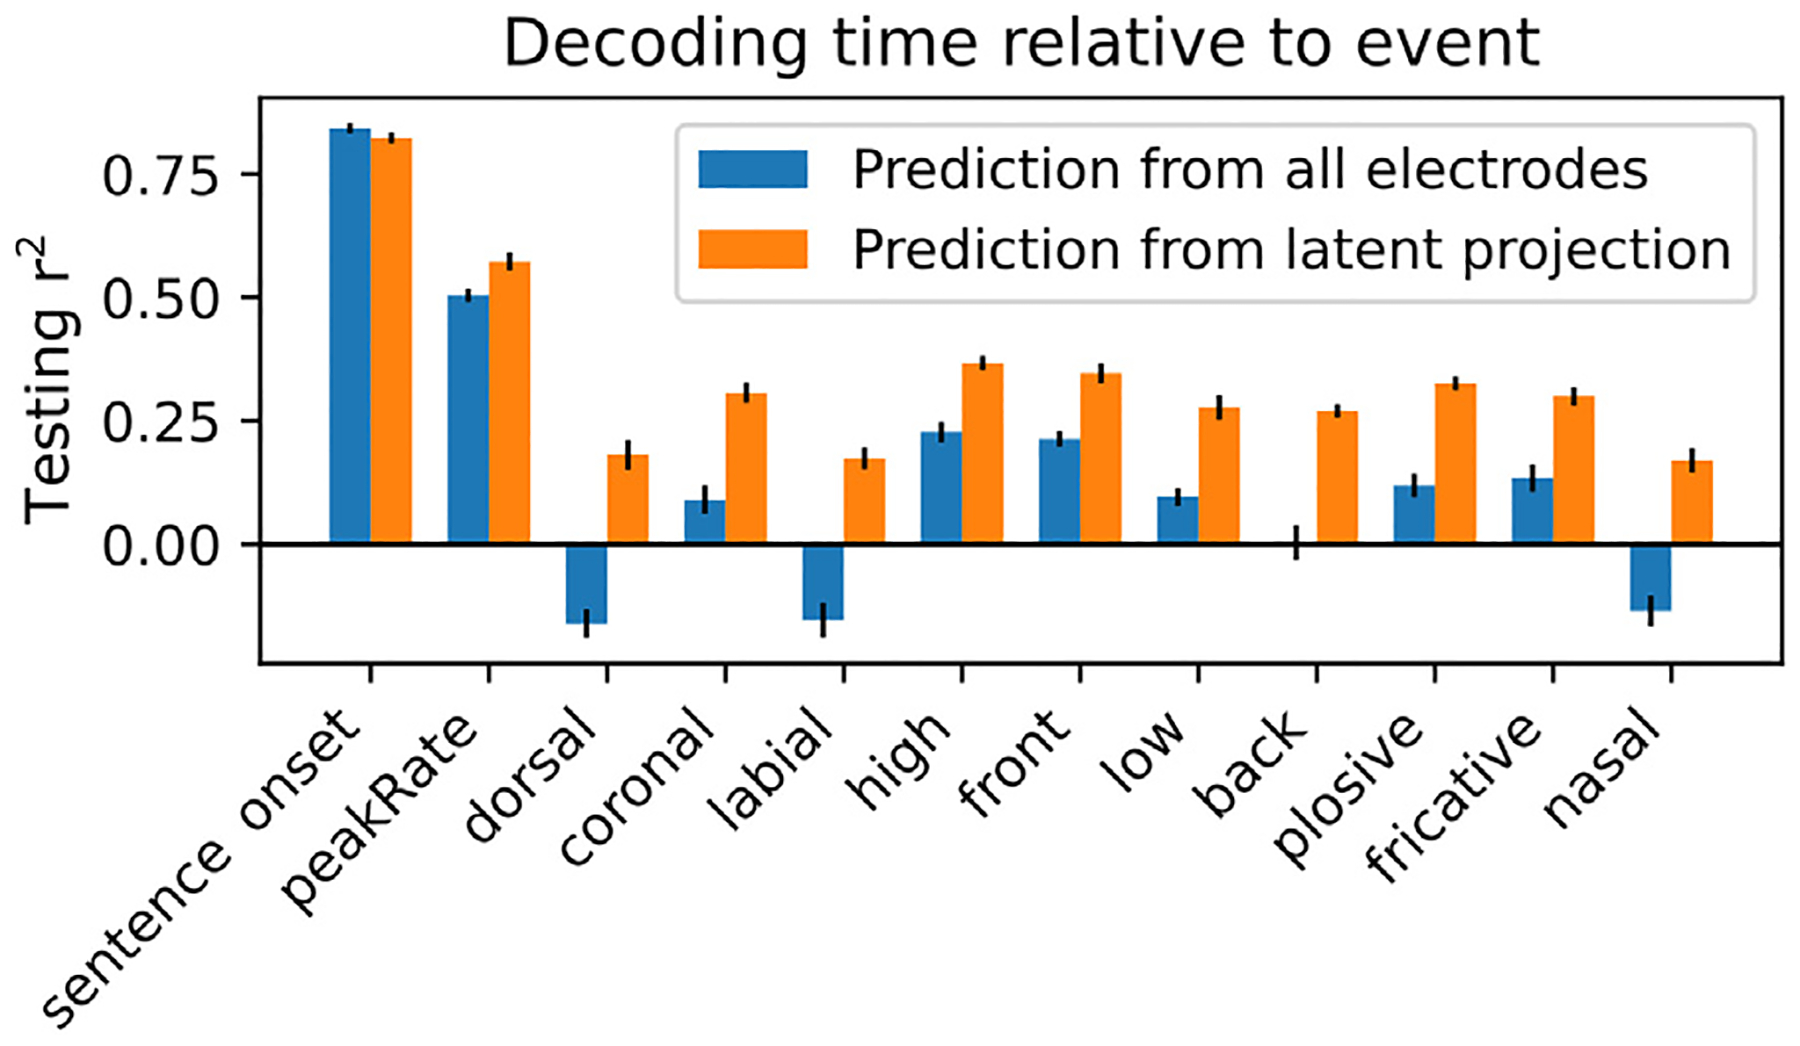
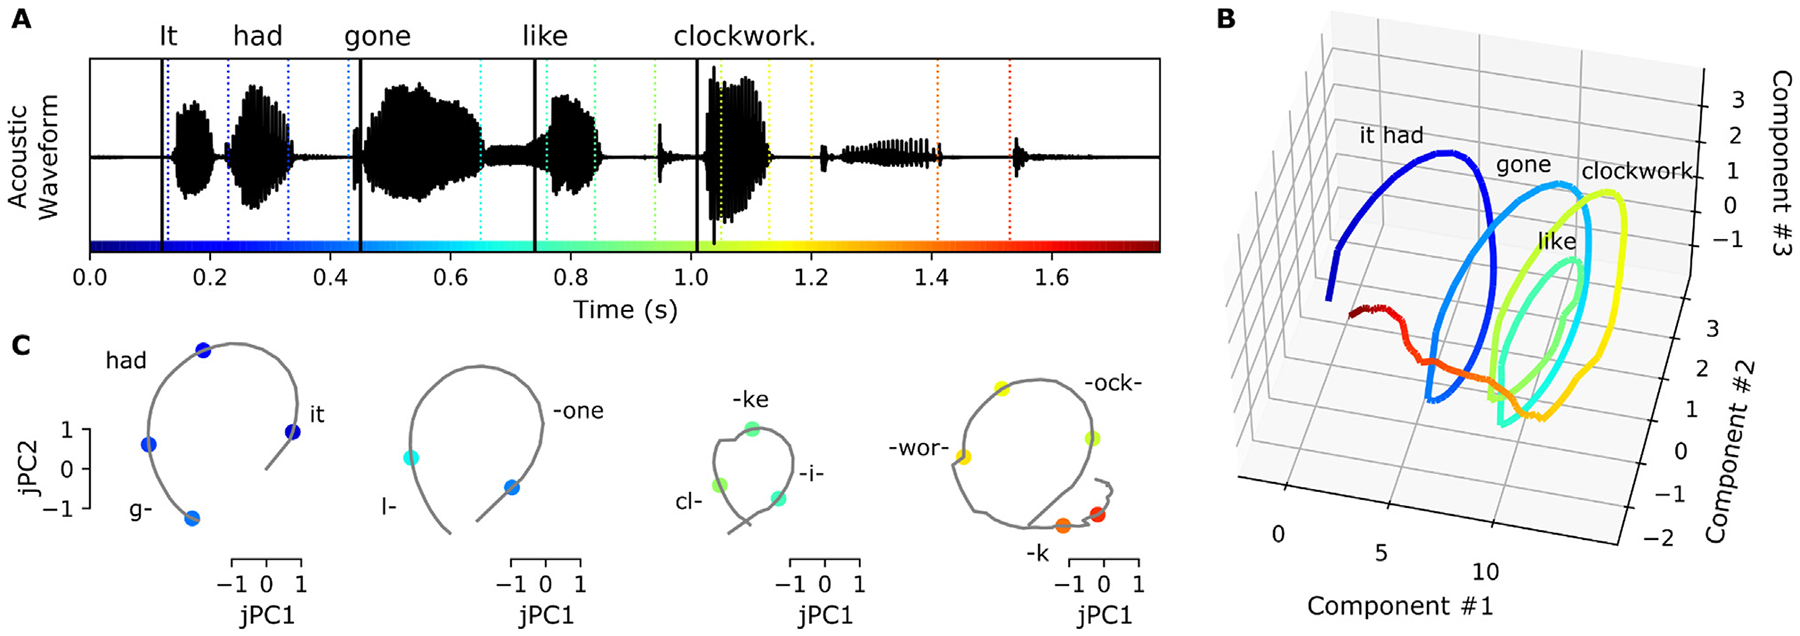
Direct neural recordings from human auditory cortex have demonstrated encoding for acoustic-phonetic features of consonants and vowels. Neural responses also encode distinct acoustic amplitude cues related to timing, such as those that occur at the onset of a sentence after a silent period or the onset of the vowel in each syllable. Here, we used a group reduced rank regression model to show that distributed cortical responses support a low-dimensional latent state representation of temporal context in speech. The timing cues each capture more unique variance than all other phonetic features and exhibit rotational or cyclical dynamics in latent space from activity that is widespread over the superior temporal gyrus. We propose that these spatially distributed timing signals could serve to provide temporal context for, and possibly bind across time, the concurrent processing of individual phonetic features, to compose higher-order phonological (e.g. word-level) representations.

Keywords: Auditory; Electrocorticography; Latent state; Reduced-rank regression; Superior temporal gyrus.


Conflict of interest statement

Declaration of Competing Interest The authors declare no competing interests.

Figures

Fig. 1.
Fig. 1.
iRRR outperforms models that treat each electrode individually, and sentence onset and peak rate capture more of the variance than phonetic features. A: Electrodes used for model fitting, colored according to the testing r2 of the linear spectrotemporal (STRF) model (electrodes were selected for subsequent analysis if they were located over STG and if their testing r2 for the spectrotemporal model was greater than 0.05). B: Features used for feature temporal receptive field modeling. Top: the acoustic waveform of an example sentence. The solid vertical line shows the sentence onset event, and the dashed vertical lines show the times of the peak rate events. Second panel: the corresponding mel-band spectrogram. Third panel: the envelope of the acoustic waveform (black) and the positive rate of change of the envelope (red). The peaks in the positive envelope rate of change are the peak rate events. Bottom: the feature time series. White space represents no event (encoded by 0 in the feature matrix), black lines represent event times (encoded by 1), and red lines indicate peak rate event times with their corresponding magnitude indicated to the right. C, D, E: Performance of the iRRR model in comparison to ordinary least squares (OLS) and ridge regression (Ridge). 95% confidence intervals were estimated using the standard error of the mean across cross-validation folds (see Section 3.8). Significance was assessed for comparisons using two-sided paired t-tests across cross-validation folds, *** p<0.0005. C: Total explained variance, computed as the testing r2 computed over all speech-responsive electrodes. D: Group nuclear norm, meaning the penalty term from the iRRR model (see Eq. (11)). E: The effective number of parameters for the fitted models. F: Unique explained variance for each feature (over all speech-responsive electrodes), expressed as a percentage of the variance captured by the full model. Comparing individual features, both timing features have significantly more unique explained variance than all phonetic features, after Bonferroni correction over pairs (left). Also shown is the unique explained variance for the combined timing features (sentence onset and peak rate) and the combined phonetic features (right). When the features are grouped, the phonetic features capture more unique explained variance than the timing features.
Fig. 2.
Fig. 2.
The model fit captures known response differences between pSTG and mSTG. A and B: Time components for the sentence onset and peak rate response matrices, scaled by their singular value (all panels of this figure use the fit from the first cross-validation fold). C: The first two spatial components (across electrodes) for sentence onset. E: The electrode responses to sentence onset events (rows of the sentence onset response matrix), colored by the first (left) or second (right) peak rate spatial component. The first spatial component for sentence onset shows that electrodes with large sentence onset responses (red lines in the left plot of E) tend to be in posterior STG (red circles in the left plot of C). D and F: (like C and E, but for peak rate). The second spatial component divides electrodes into fast and slow peak rate responses (red and blue lines in the right plot of F), which tend to occur over pSTG and mSTG, respectively (red and blue circles in the right plot of D).
Fig. 3.
Fig. 3.
Feature latent states have rotational dynamics that capture continuous relative timing information. A: Acoustic waveform of the stimulus. Solid and dashed vertical lines indicate the timing of the sentence onset and peak rate events, respectively. Colors along the x-axis are used to indicate time in parts d-G. B, C: Predicted latent states for the sentence onset and peak rate features corresponding to the given stimulus. D, E: Top three dimensions of the predicted sentence onset and peak rate latent states (the top three dimensions capture 98.7% and 98.8% of the variance in the sentence onset and peak rate coefficient matrices, respectively). F, G: Projection of the predicted sentence onset and peak rate latent states onto the plane of fastest rotation (identified using jPCA). The displayed jPCA projections capture 31.8% and 20.3% of the variance in the sentence onset and peak rate coefficient matrices, respectively. All panels of this figure use the fit from the first cross-validation fold.
Fig. 4.
Fig. 4.
Latent states from the model can be used to decode time relative to feature events. Performance of a perceptron model trained to decode the time relative to the most recent feature event, for each feature. The models were trained either using the full high-dimensional set of high gamma responses across electrodes (blue bars) or using the projection of those responses onto the subspaces spanned by the feature latent states (orange bars). Performance is quantified using the testing set r2.
Fig. 5.
Fig. 5.
Peak rate rotational latent states could provide a temporal scaffolding on which individual acoustic features can be organized. A: The acoustic waveform for the stimulus “It had gone like clockwork”. Solid vertical lines indicate the times of peak rate events, and colored dashed vertical lines indicate the times of phonetic feature events. Colors are used to indicate time in all panels. B: The predicted peak rate latent state follows a spiral trajectory in the top 3 dimensions. C: Projected onto the plane of greatest rotation (jPC1 and 2), the predicted peak rate latent state divides the sentence into four intervals, each consisting of a rotation through state space that captures the time since the peak rate event occurred. Downstream processing could combine the relative time information encoded in the peak rate subspace (grey traces) with the feature identities encoded in the feature subspaces (colored points) to compose higher-order representations of words or small groups of words. Text in panels B and C indicates the approximate timing of the words in the stimulus.

Similar articles

Cited by

References

    1. Aertsen AMHJ, Johannesma PIM, 1981. The spectro-temporal receptive field: a functional characteristic of auditory neurons. Biol. Cybern 42, 133–143. doi:10.1007/BF00336731. - DOI - PubMed
    1. Antin B, Shenoy K, Linderman S, 2021. Probabilistic jPCA: a constrained model of neural dynamics, in: Cosyne Abstracts 2021. Presented at the Cosyne21, Online.
    1. Aoi MC, Mante V, Pillow JW, 2020. Prefrontal cortex exhibits multidimensional dynamic encoding during decision-making. Nat. Neurosci 23, 1410–1420. doi:10.1038/s41593-020-0696-5. - DOI - PMC - PubMed
    1. Aoi M and Pillow JW, 2018. Model-based targeted dimensionality reduction for neuronal population data. Advances in neural information processing systems, 31. - PMC - PubMed
    1. Austern M and Zhou W, 2020. Asymptotics of cross-validation. arXiv preprint arXiv:2001.11111.

Publication types