. 2023 Aug 17;83(16):2896-2910.e4.
doi: 10.1016/j.molcel.2023.06.032. Epub 2023 Jul 12.

Distinct layers of BRD4-PTEFb reveal bromodomain-independent function in transcriptional regulation

Affiliations

Distinct layers of BRD4-PTEFb reveal bromodomain-independent function in transcriptional regulation

Bin Zheng et al. Mol Cell. .

Abstract

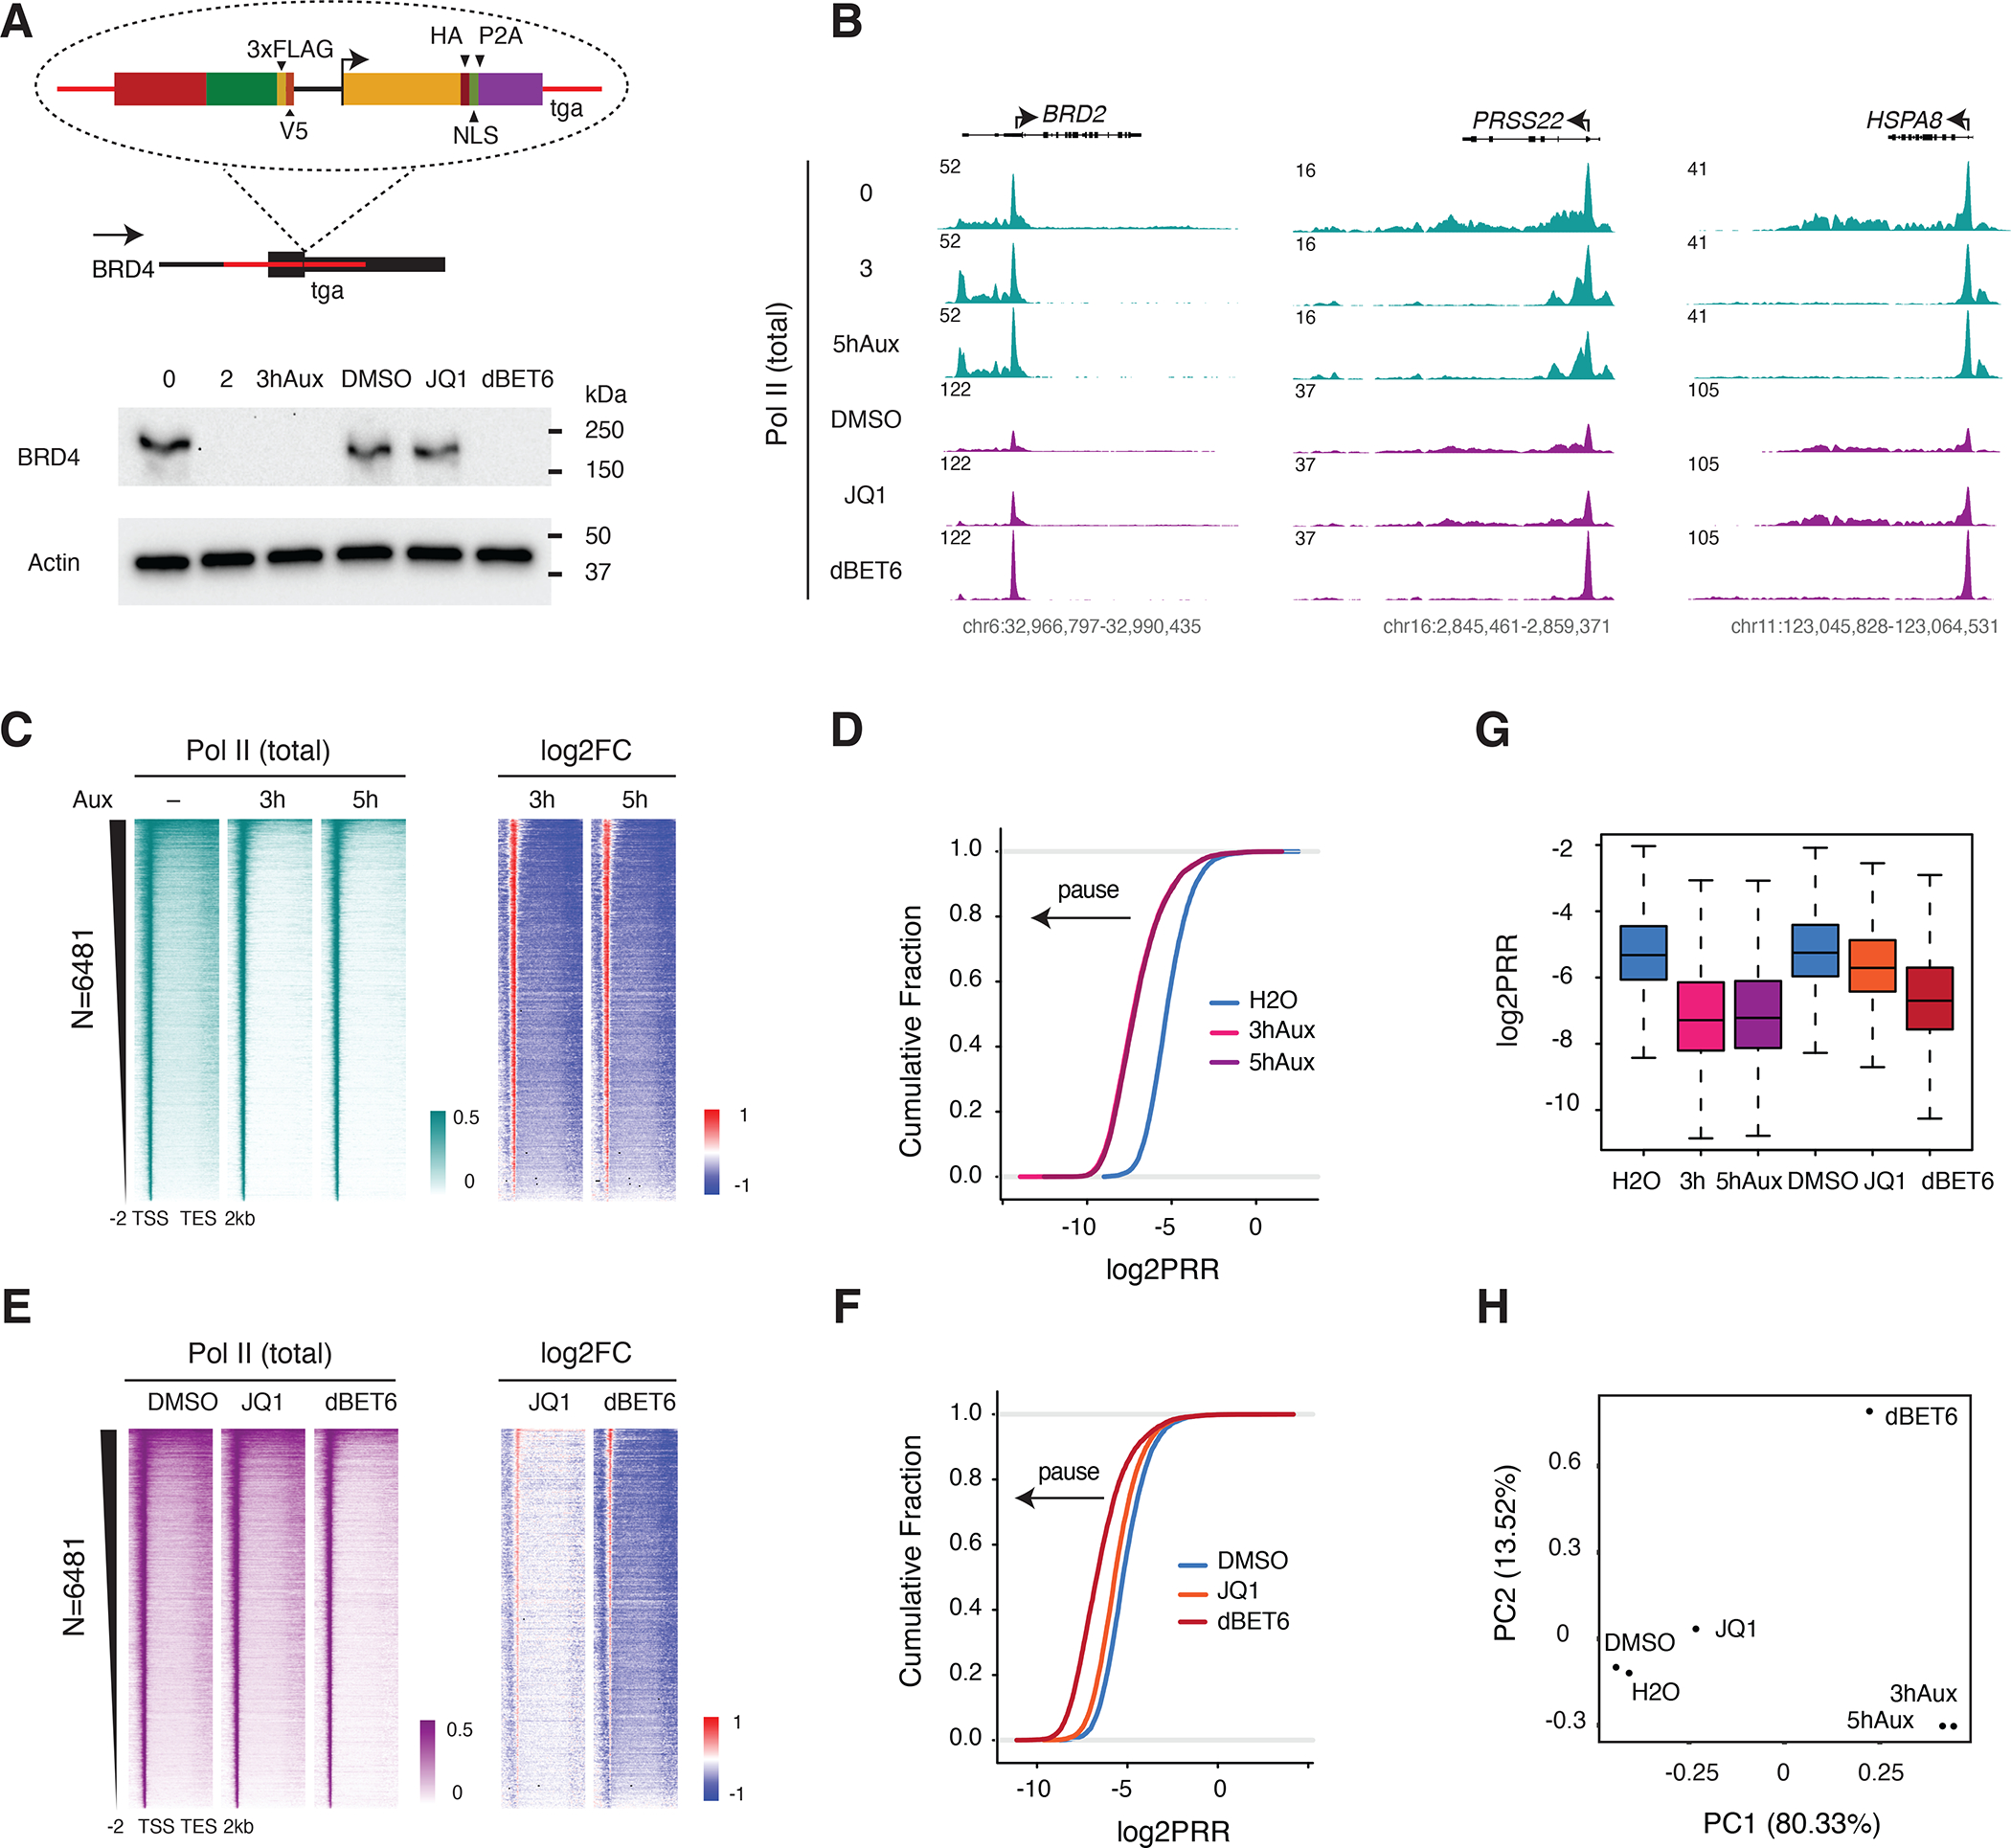
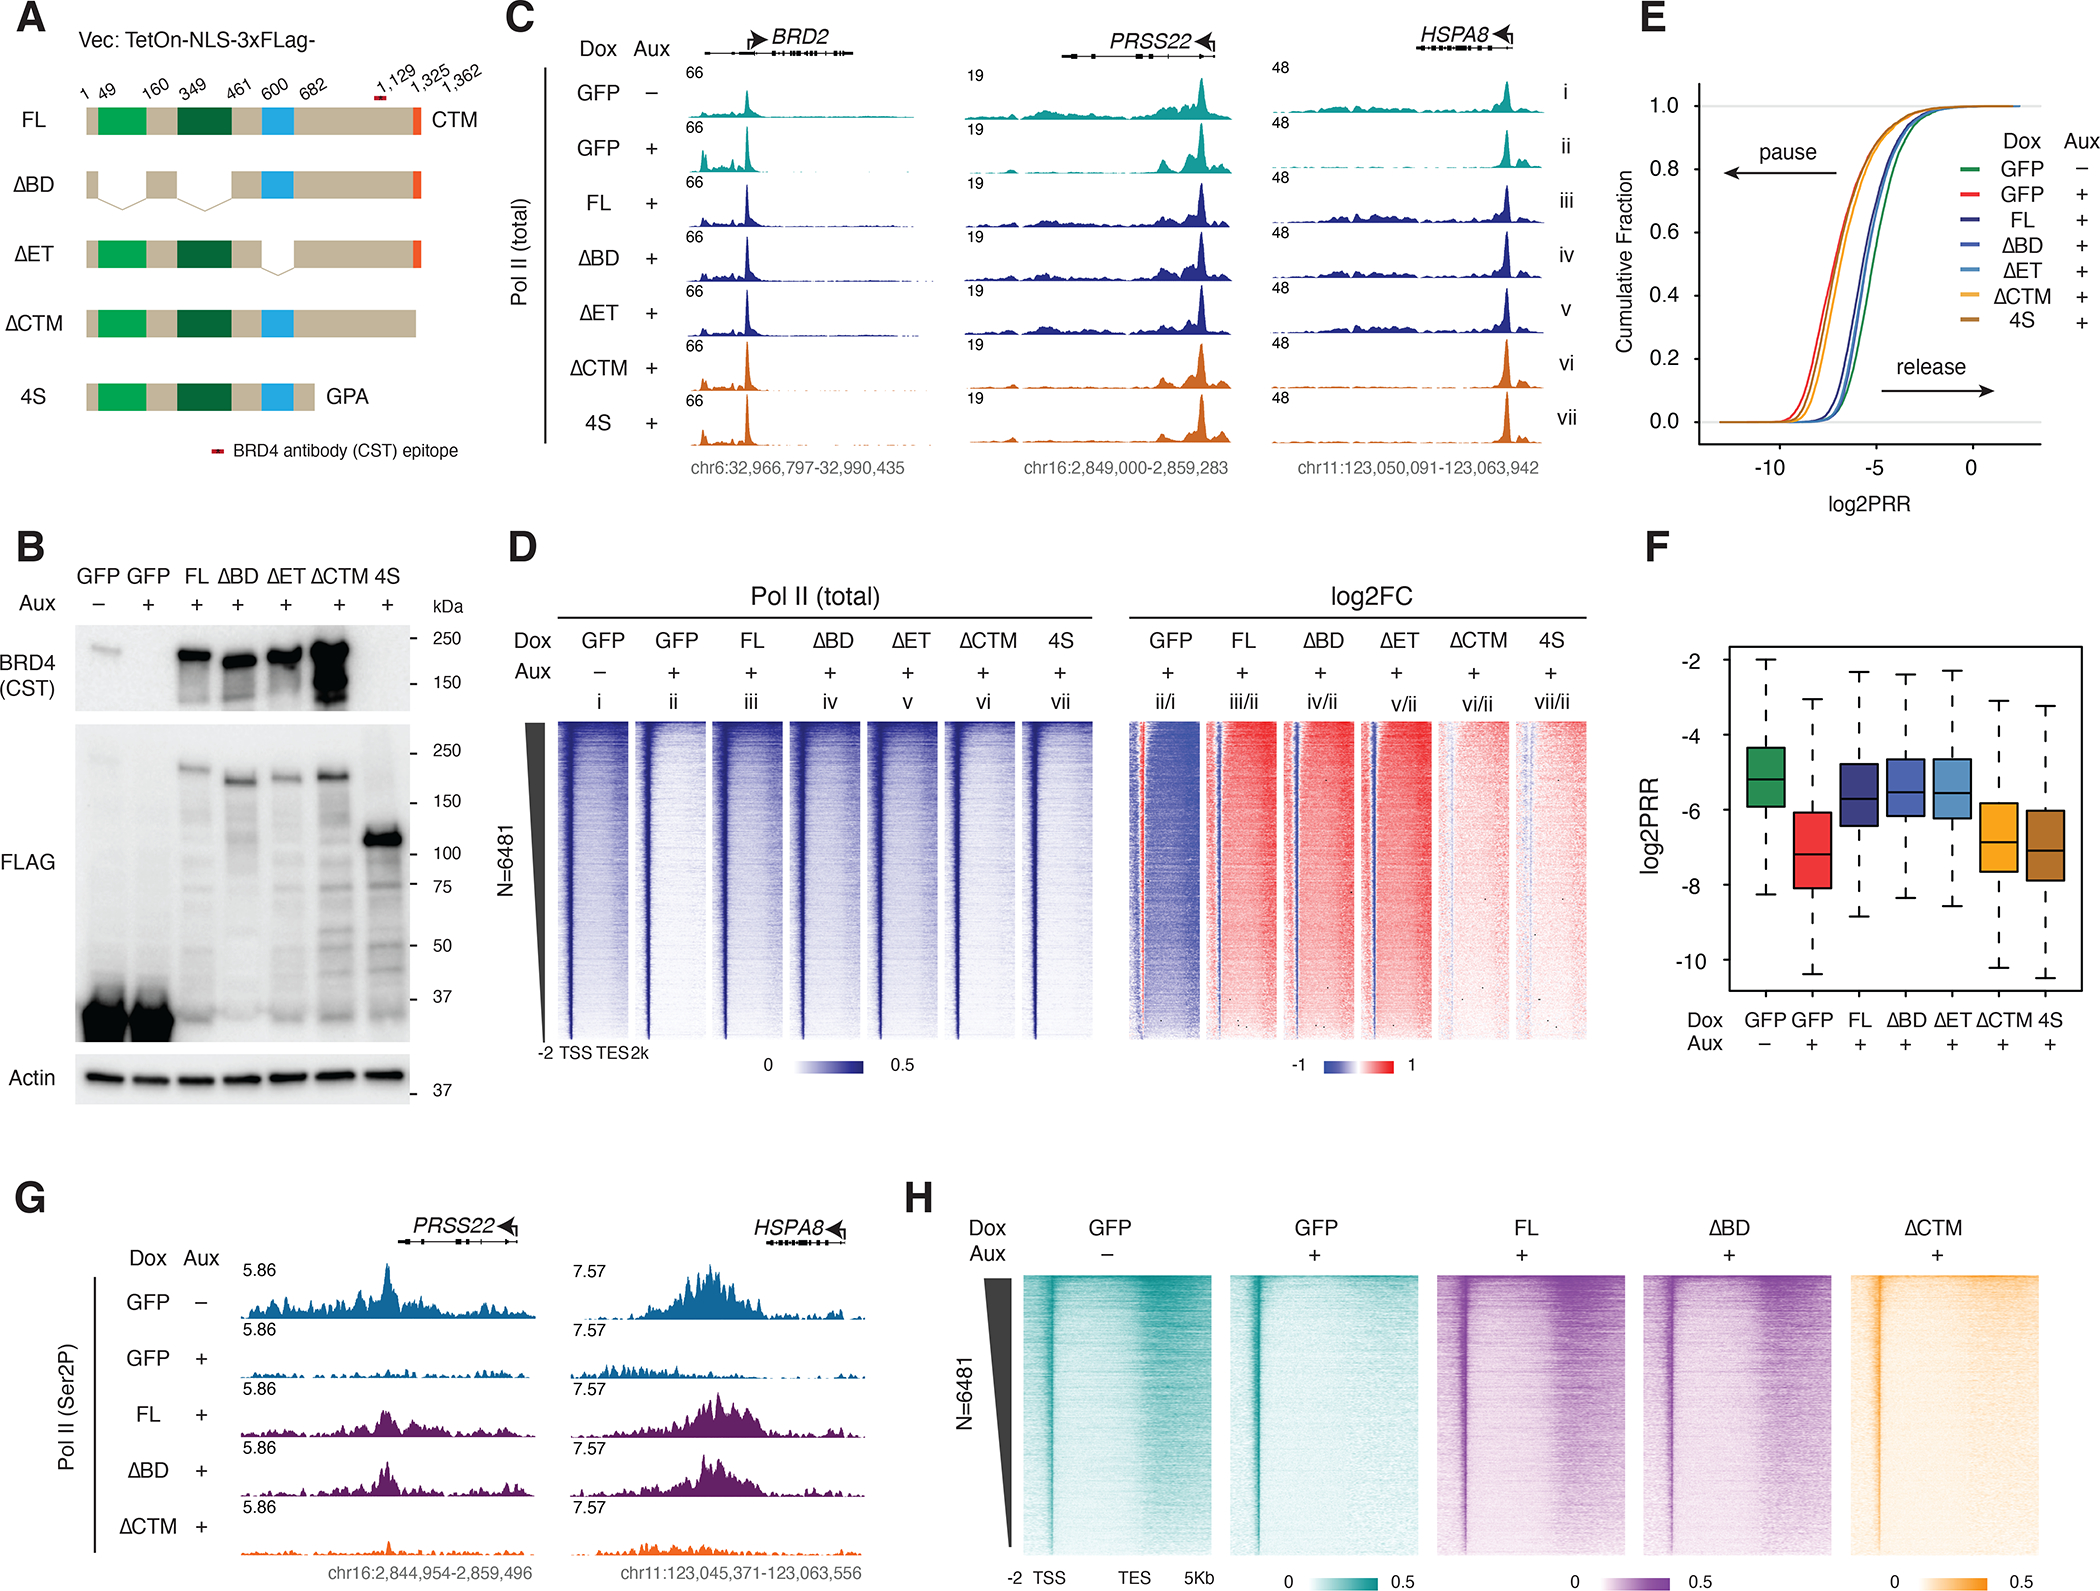
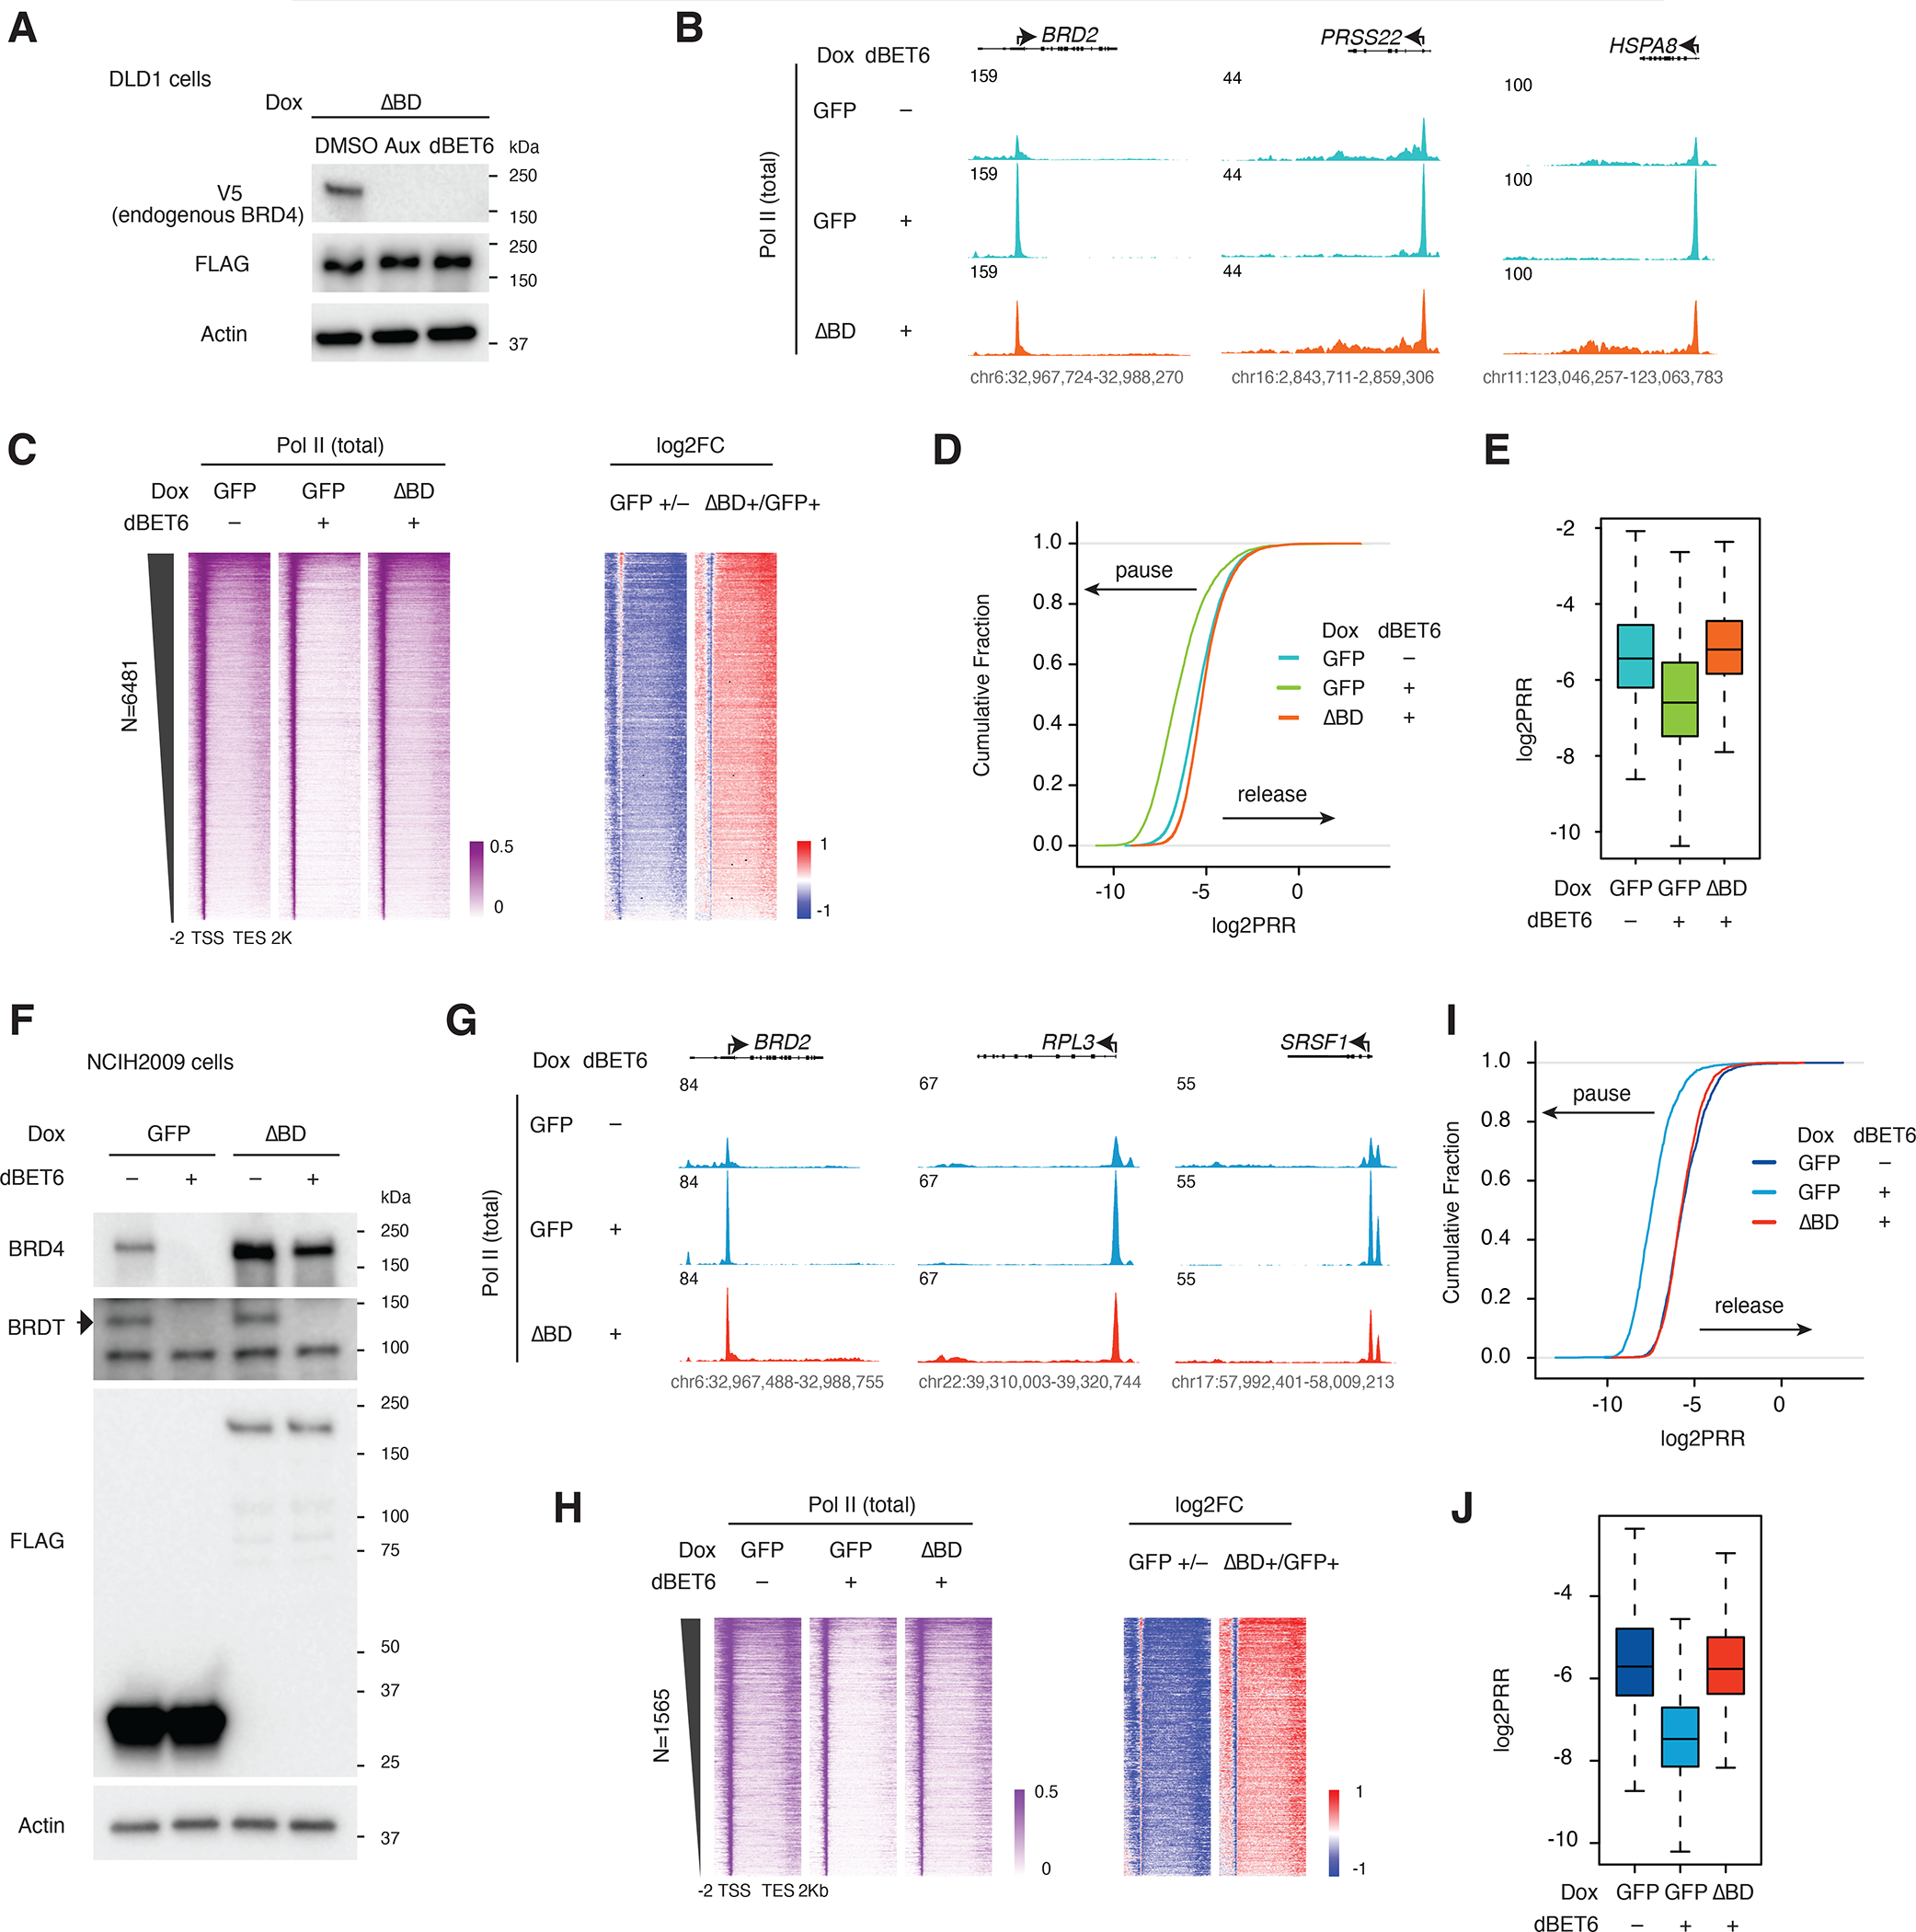
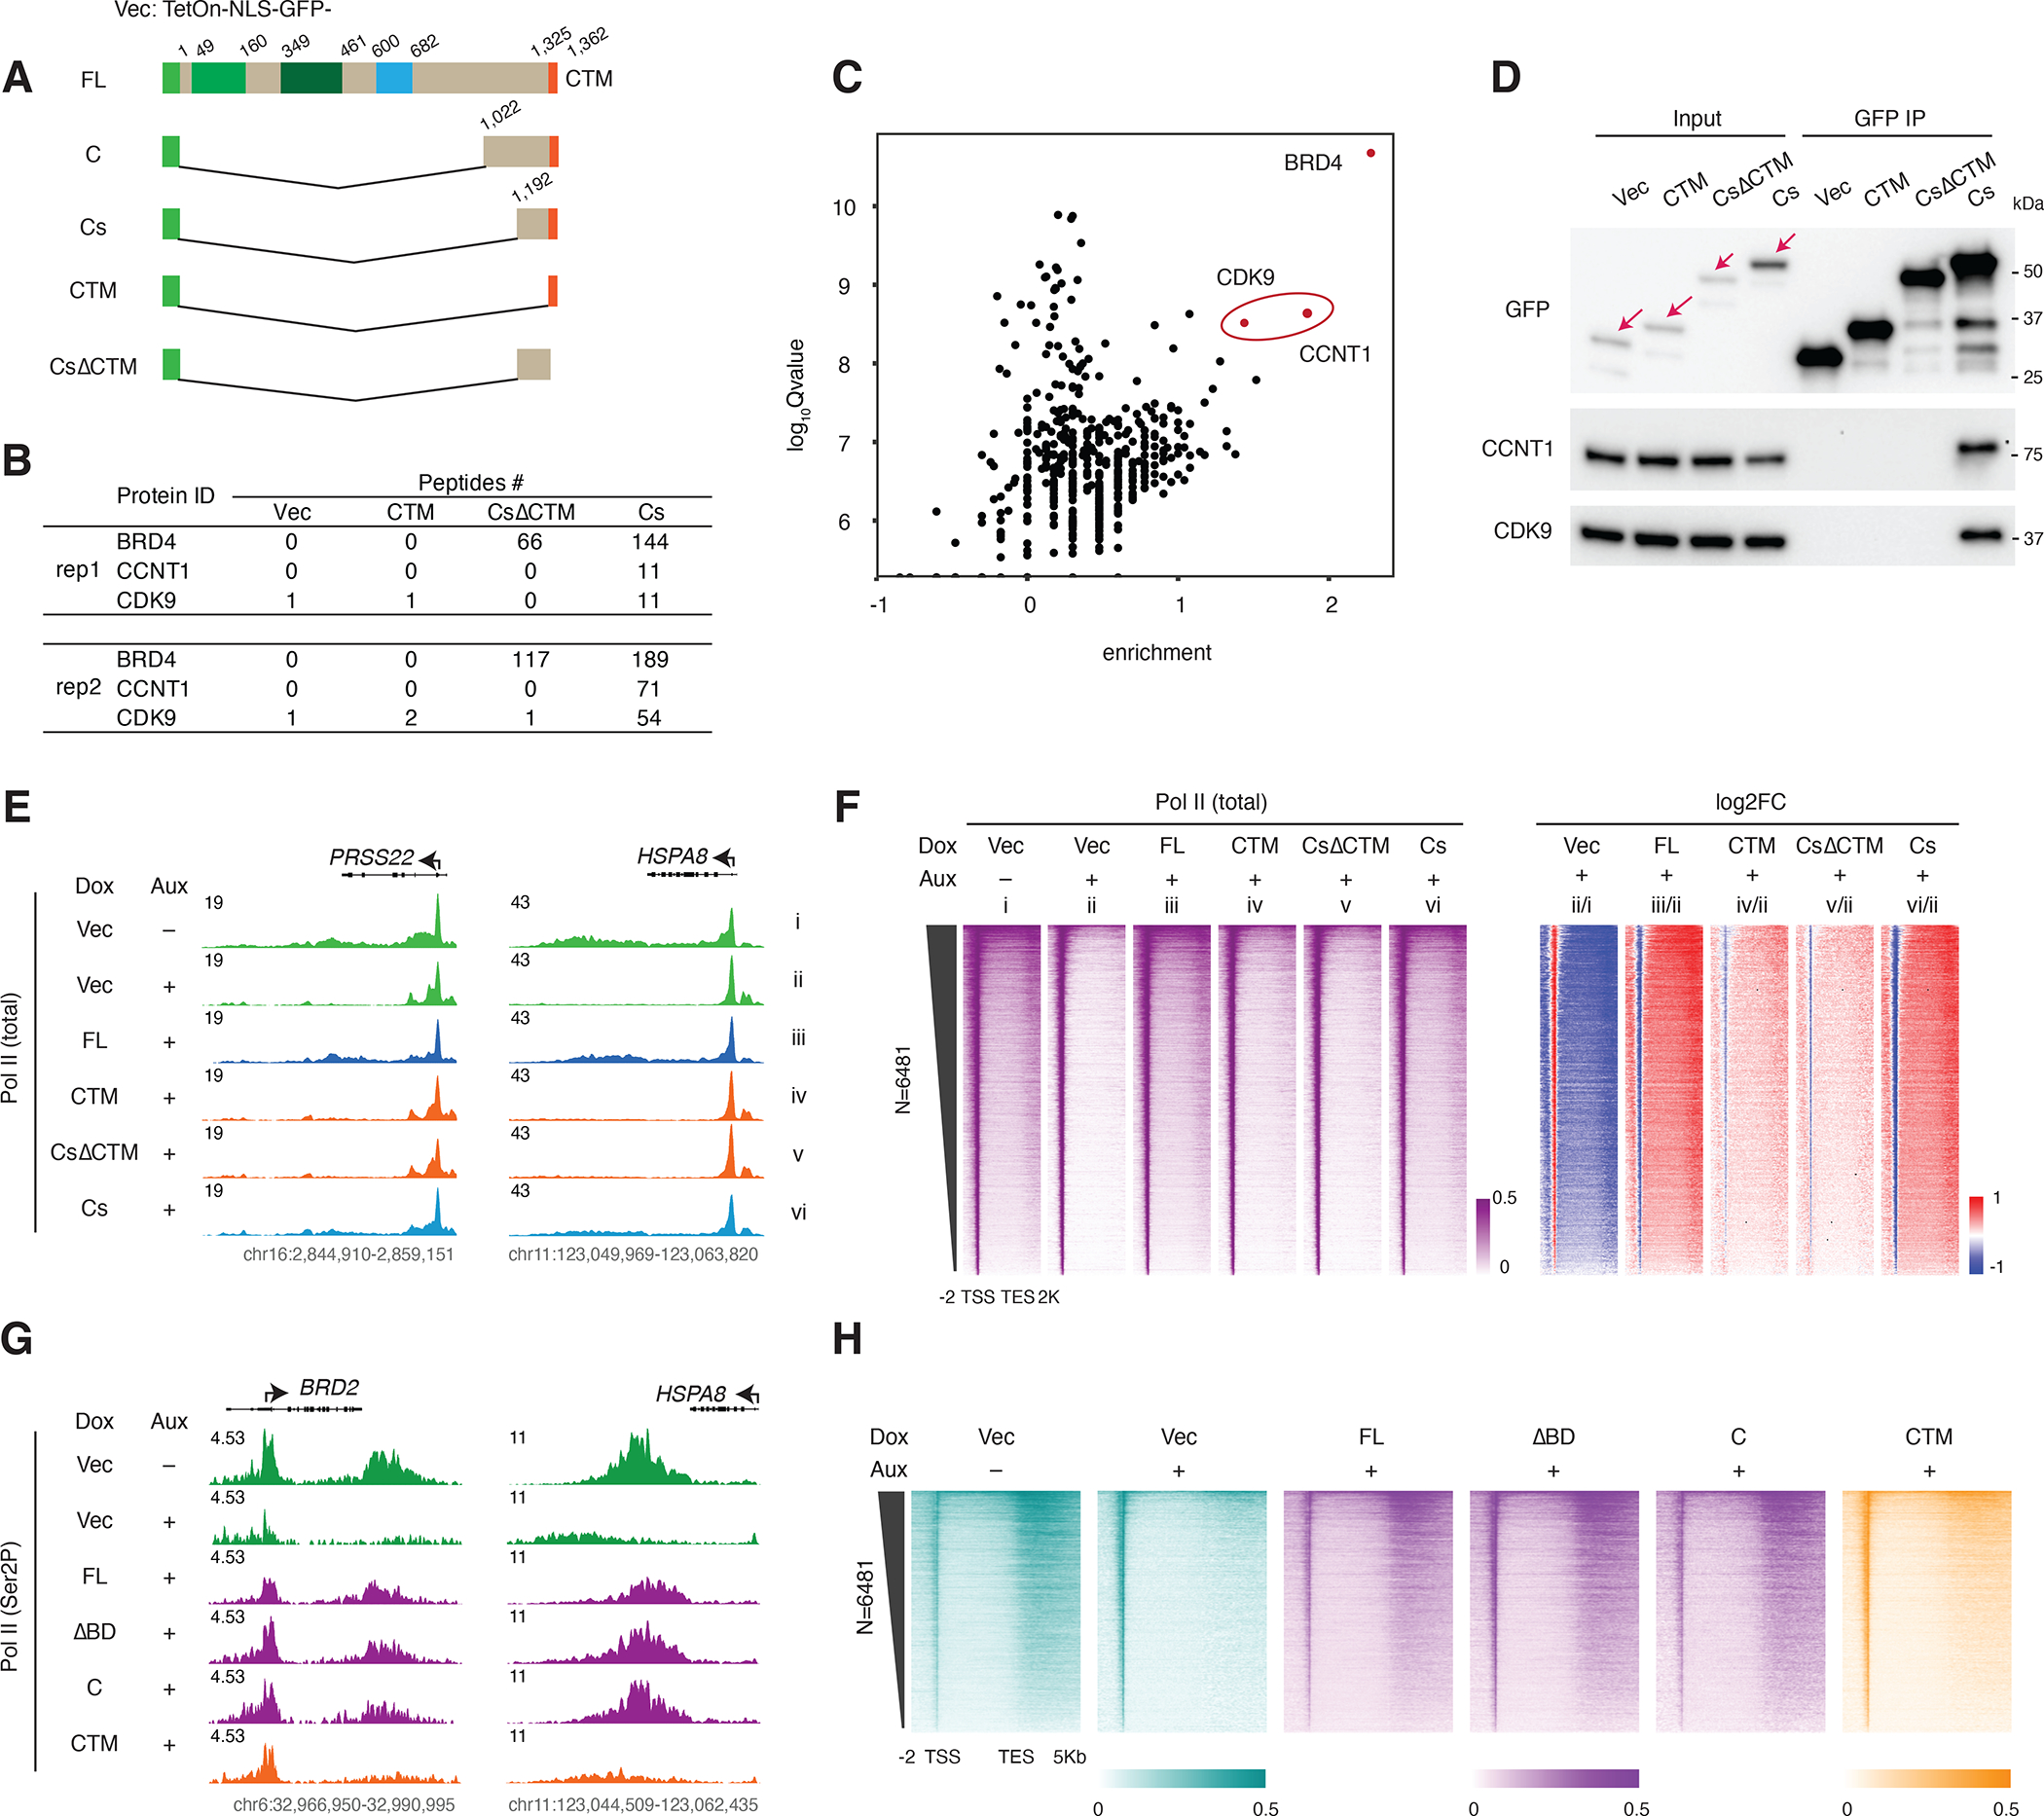
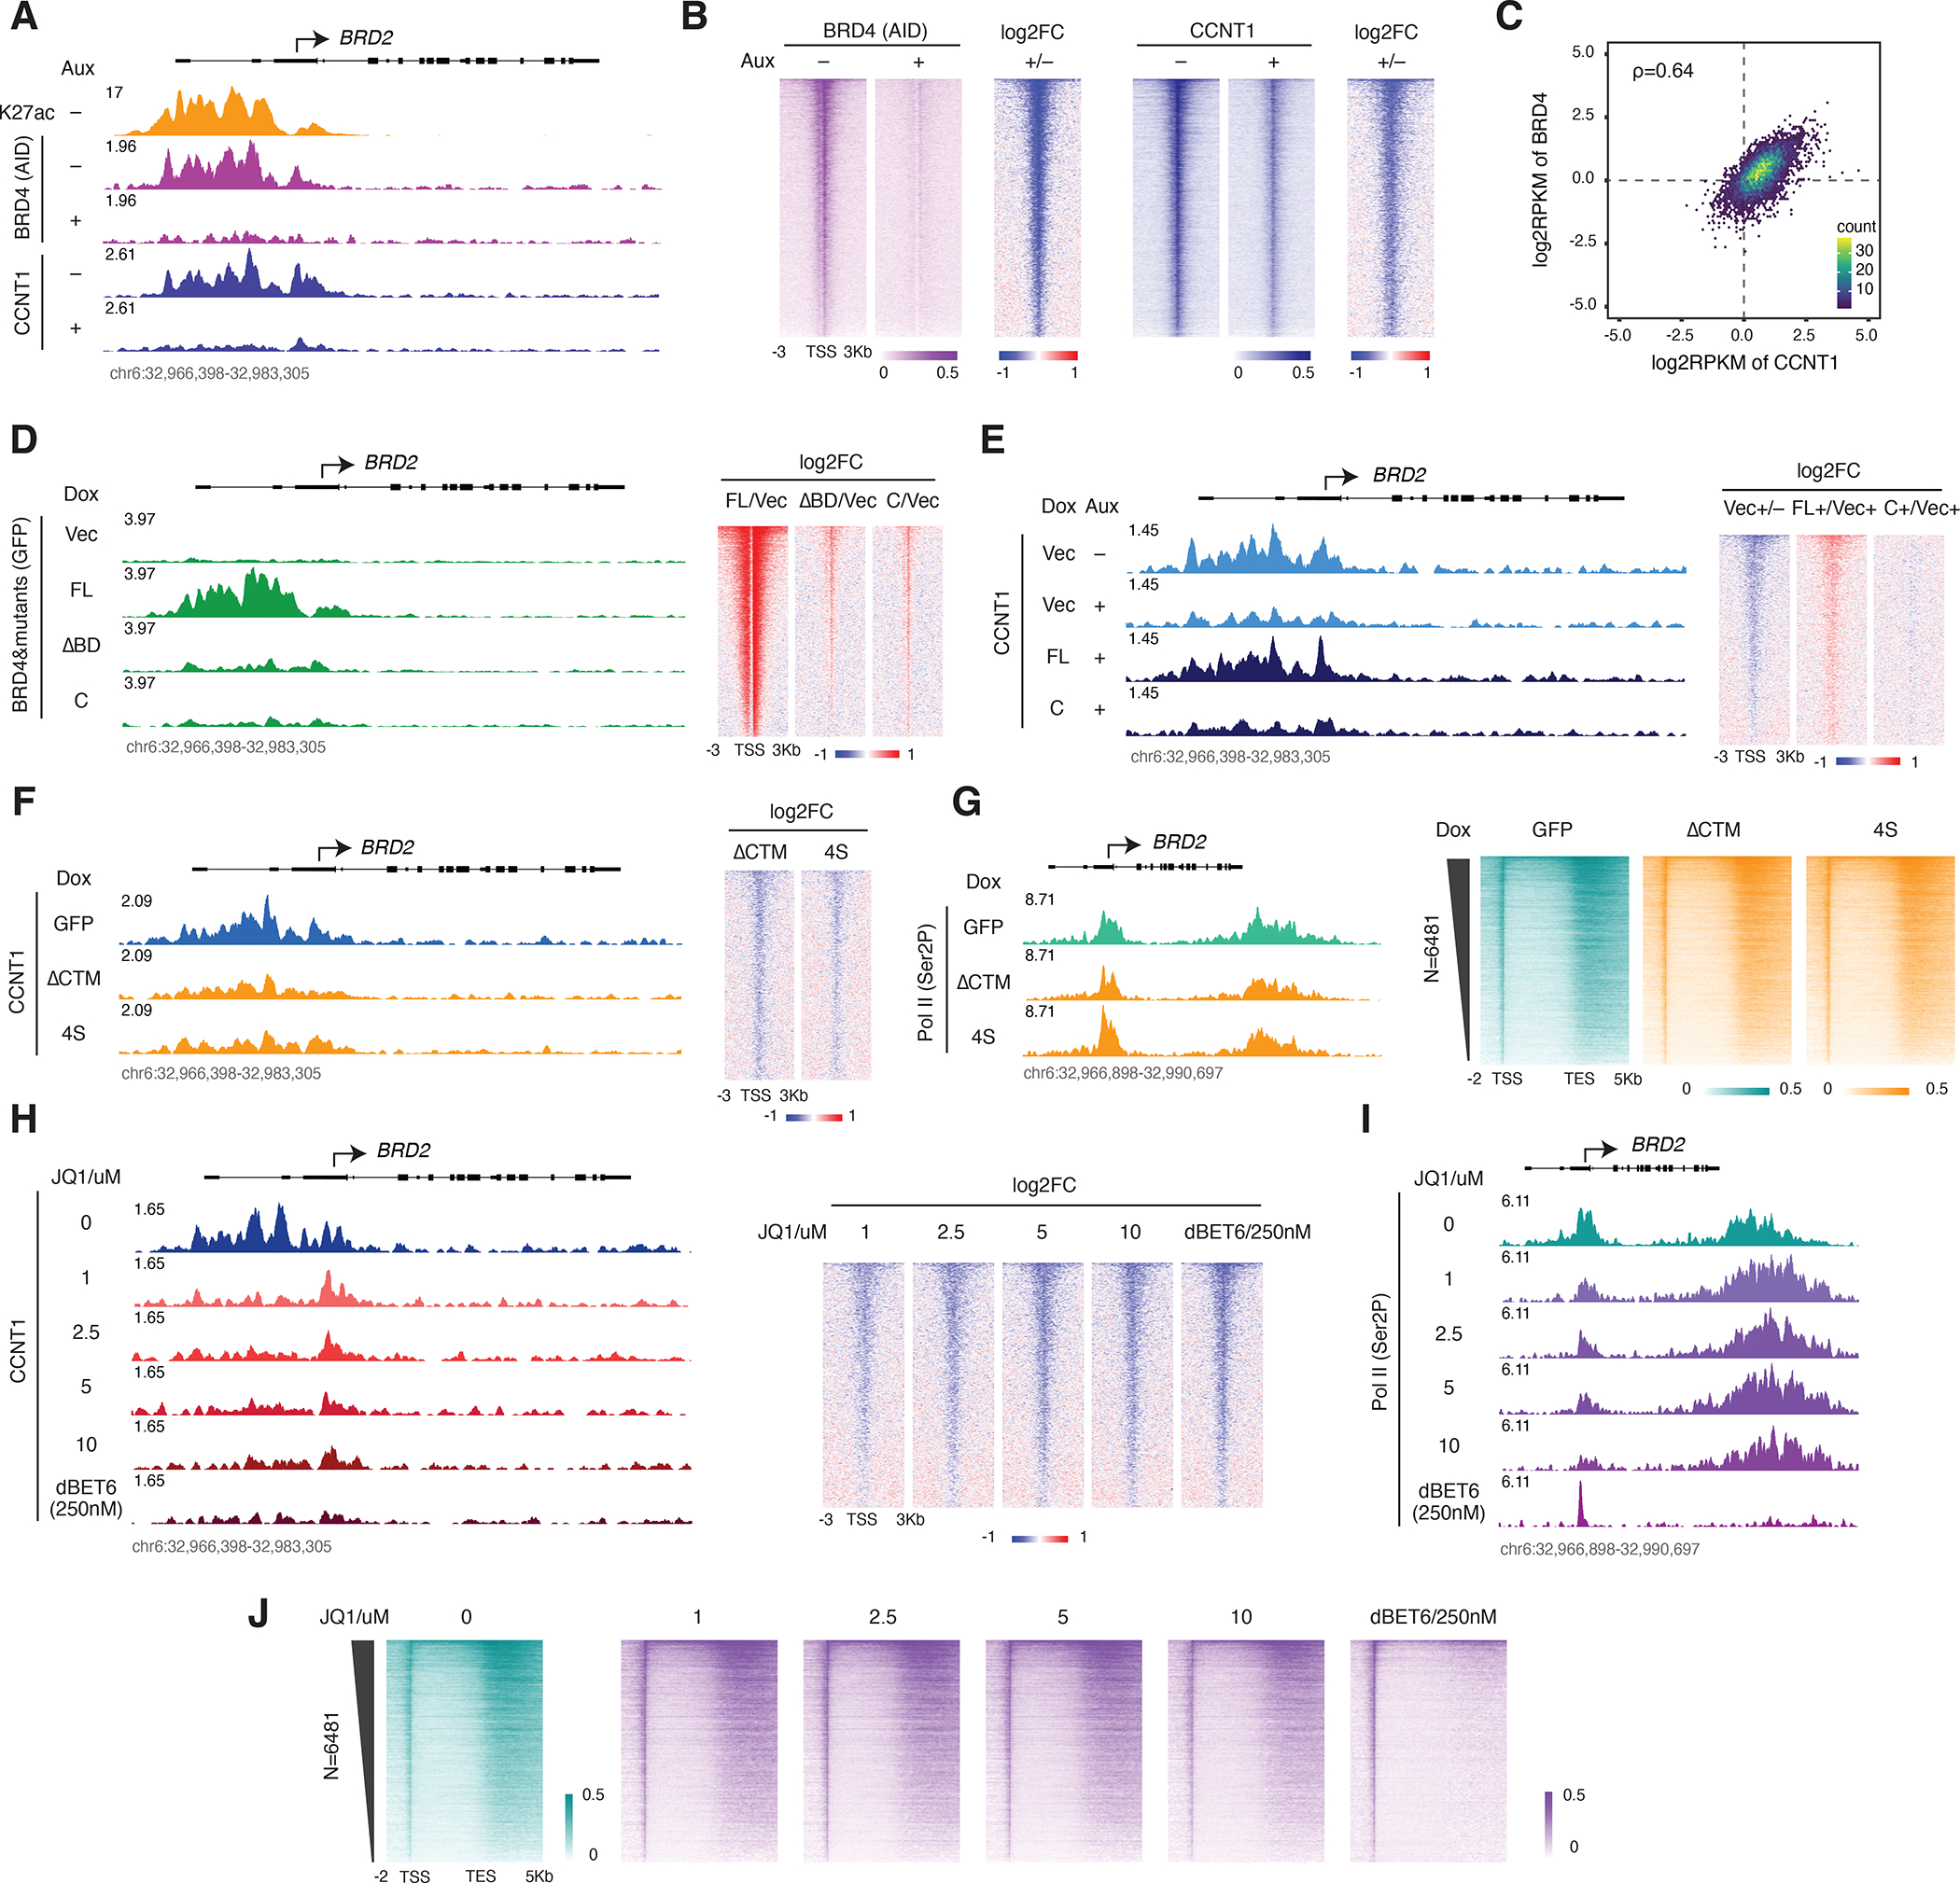
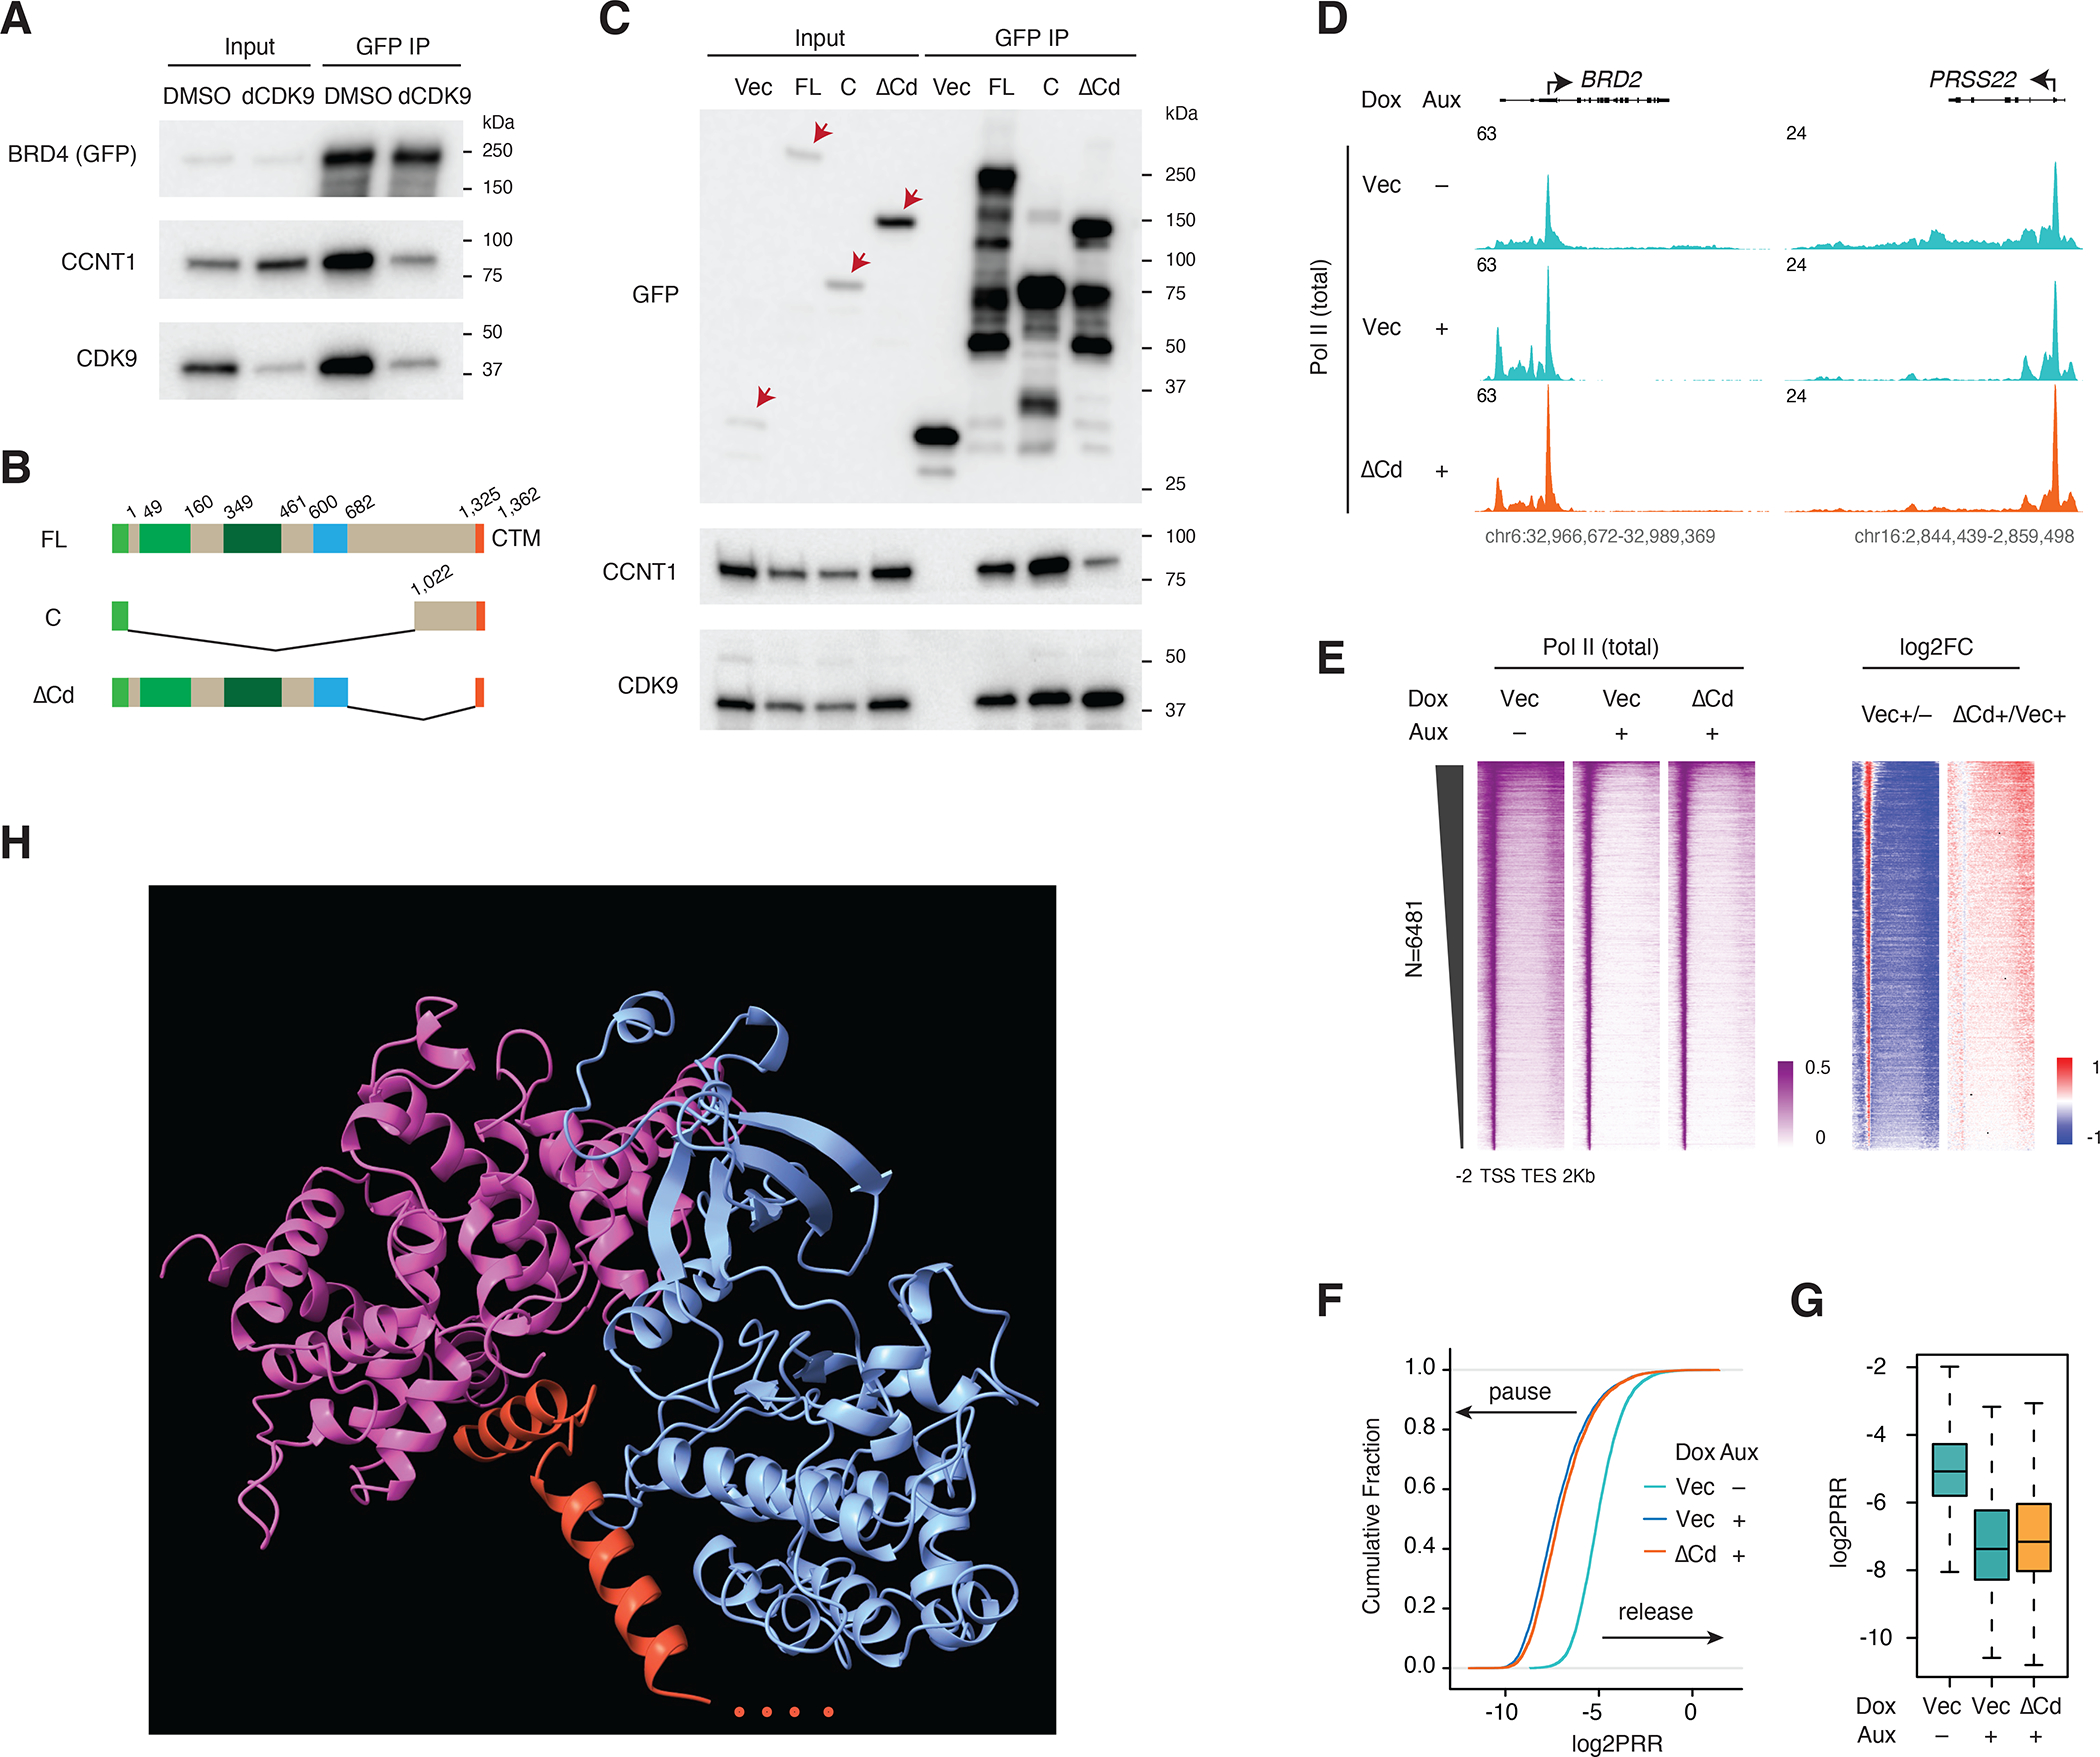
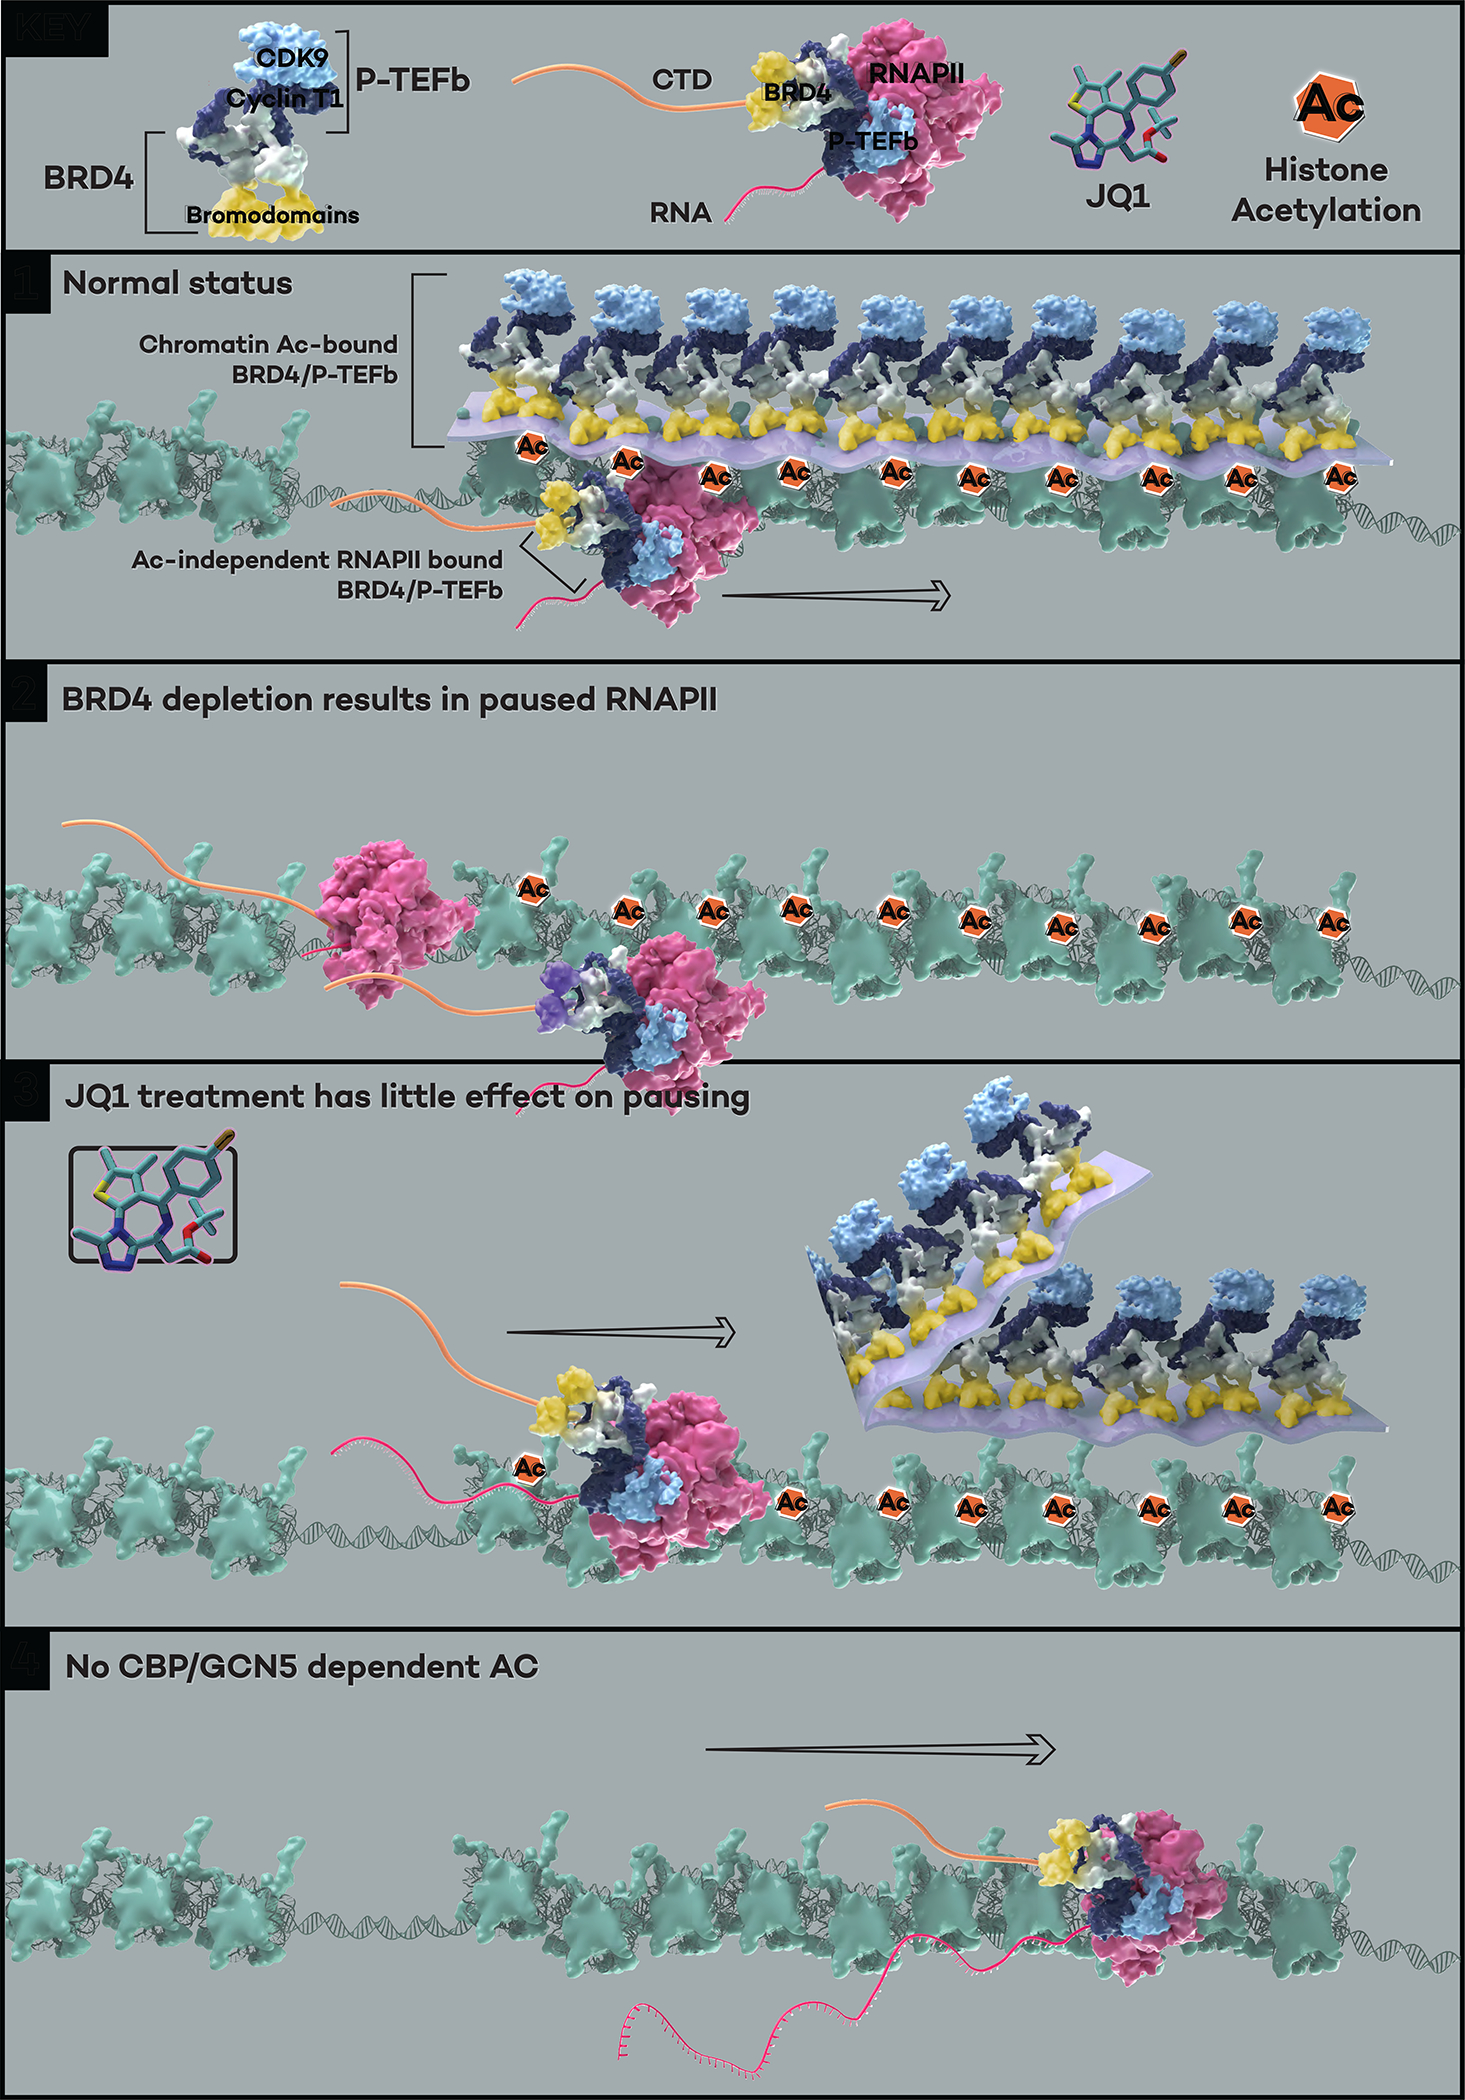
The BET family protein BRD4, which forms the CDK9-containing BRD4-PTEFb complex, is considered to be a master regulator of RNA polymerase II (Pol II) pause release. Because its tandem bromodomains interact with acetylated histone lysine residues, it has long been thought that BRD4 requires these bromodomains for its recruitment to chromatin and transcriptional regulatory function. Here, using rapid depletion and genetic complementation with domain deletion mutants, we demonstrate that BRD4 bromodomains are dispensable for Pol II pause release. A minimal, bromodomain-less C-terminal BRD4 fragment containing the PTEFb-interacting C-terminal motif (CTM) is instead both necessary and sufficient to mediate Pol II pause release in the absence of full-length BRD4. Although BRD4-PTEFb can associate with chromatin through acetyl recognition, our results indicate that a distinct, active BRD4-PTEFb population functions to regulate transcription independently of bromodomain-mediated chromatin association. These findings may enable more effective pharmaceutical modulation of BRD4-PTEFb activity.

Keywords: BRD4; JQ1; PTEFb; Pol II; bromodomains; dBET6; elongation; pause release; rapid depletion.


Conflict of interest statement

Declaration of interests The authors declare no conflict of interests.

Figures

Figure 1.
Figure 1.. Broad Pol II pausing upon BRD4 depletion but not bromodomain inhibition
A. Schematic of the updated BRD4-IAA7 degron line. The F-box protein AtAFB2 was integrated into the C terminus of the BRD4 locus under the control of an independent promoter. Western blot showing the acute depletion of BRD4 by auxin (500 uM) or dBET6 (250 nM) treatment but not JQ1 (1 uM) in the BRD4-IAA7 degron line. Cells were treated with auxin for 2 or 3h, or with JQ1 or dBET6 for 3h. These treatment concentrations/durations are relevant to all of Figure 1. B. Genome browser track examples of total Pol II ChIP-seq signal at the representative genes BRD2, PRSS22 and HSPA8 upon auxin treatment (0, 3 or 5h), JQ1 or dBET6 treatment (3h). C. Heatmap showing the genome-wide Pol II occupancy profile upon auxin treatment and the profile of fold change in Pol II occupancy compared to control, in which the differential between promoter (high occupancy, red) and gene body (low occupancy, blue) indicates paused Pol II. The gene list (N=6481) in this analysis is used throughout the study (except for Figures 3H–J). D. Estimated Cumulative Density Function (ECDF) of pause release ratios (PRR, reported as log2 fold change) for auxin treatment vs untreated control. The PRR is the ratio of Pol II occupancy within gene bodies to its occupancy at promoters. A leftward shift of the curve indicates an increase in the frequency and/or duration of promoter-proximal pausing, while a rightward shift indicates reduced pausing and/or more efficient release into gene bodies. E. Heatmap showing the genome-wide Pol II occupancy profile upon JQ1 or dBET6 treatment and the profile of fold change in occupancy vs control. F. ECDF of the log2PRR upon JQ1 or dBET6 treatment. G. Boxplot of the log2PRR for auxin, JQ1 and dBET6 treatment. H. PCA analysis of the log2PRR for auxin, JQ1 and dBET6 treatment.
Figure 2.
Figure 2.. BRD4 bromodomains are dispensable for Pol II pause release
A. Schematic of the FLAG-tagged, Dox-inducible BRD4 mutant constructs, relevant to all of Figure 2 (vector: TetOn-NLS-3xFLAG). The location of the epitope for the commercial BRD4 antibody (CST) is indicated. B. Western blot showing BRD4 mutant construct expression in the same conditions used for subsequent rescue experiments: auxin-treated (3h) BRD4-IAA7 cells, 2d after Dox treatment (50nM). Blot was probed for BRD4 using antibodies against a C-terminal epitope (see A) and the N-terminal FLAG tags. C. Track examples showing the total Pol II ChIP-seq signal at the BRD2, PRSS22 and HSPA8 loci for the rescue experiment, in which auxin-induced endogenous BRD4 depletion is complemented by Dox-induced mutant construct expression. D. Heatmaps showing the genome-wide Pol II occupancy and fold change in occupancy for mutant constructs vs GFP control in the rescue experiment. E. ECDF comparison of log2PRR in the rescue experiment showing ΔCTM and BRD4S mutant constructs clustered with auxin-treated (BRD4 depleted) GFP control, while FL, ΔBD and ΔET constructs are clustered with the untreated GFP control. F. Boxplot comparison of log2PRR in the rescue experiment. G. Track examples of the Pol II Ser2P ChIP-seq signal at the PRSS22 and HSPA8 loci, showing loss of Pol II Ser2P occupancy due to auxin-induced endogenous BRD4 depletion that is rescued by Dox-induced expression of the FL or ΔBD but not ΔCTM mutant constructs. H. Heatmaps showing the genome-wide Ser2P occupancy under the same rescue experiment conditions.
Figure 3.
Figure 3.. Bromodomain dispensability conserved across cell lines
A. Western blot showing degradation of endogenous BRD4 (V5) but not the bromodomain-less BRD4 mutant (FLAG) upon auxin or dBET6 treatment in the BRD4-IAA7 DLD1 degron line. B. Track examples of the total Pol II ChIP-seq signal at the BRD2, PRSS22 and HSPA8 loci after dBET6 treatment and rescue by bromodomain-less BRD4 in DLD-1 cells. C. Heatmap showing the genome-wide Pol II occupancy and fold change in occupancy for the bromodomain-less mutant construct vs GFP control after dBET6 treatment in DLD-1. D. ECDF of the log2PRR from the total Pol II ChIP-seq for the dBET6 rescue experiment in DLD-1. E. Boxplot of the log2PRR from the total Pol II ChIP-seq for the dBET6 rescue experiment in DLD-1. F. Western blot showing the depletion of endogenous BRD4 and BRDT, but not the bromodomain-less mutant, by dBET6 treatment (3h) in NCIH2009 cells. G. Track examples of the total Pol II ChIP-seq signal upon dBET6 treatment (3h) and rescue by bromodomain-less BRD4 in NCIH2009 cells. H. Heatmap showing the Pol II occupancy profiles and corresponding fold changes across the 1565 genes for which dBET6 causes strong pausing (2-fold reduction of Pol II at gene bodies and 2-fold reduction of PRR), rescued by bromodomain-less BRD4 in NCIH2009. I. ECDF of the log2PRR from the Pol II ChIP-seq for the dBET6 rescue experiment in NCIH2009 (N=1565). J. Boxplot of the log2PRR from the Pol II ChIP-seq for the dBET6 rescue experiment in NCIH2009 (N=1565).
Figure 4.
Figure 4.. BRD4 C-terminal fragment interacts with PTEFb and rescues Pol II pause release
A. Schematic of the GFP-tagged FL BRD4 and BRD4 C-terminus constructs (vector: TetOn-NLS-GFP). Cs: short C terminus. B. GFP IP-MS results showing peptide counts for the bait (BRD4) and PTEFb complex components (CCNT1 and CDK9) in two replicates after Dox (50nM) induced expression of Vector, CTM, CsΔCTM or Cs mutant constructs for 2 days. Note: the 0 bait peptide count for the CTM construct is probably due to impaired peptide alignment, as the CTM construct is itself a (GFP-tagged) peptide of only 37 residues. C. Scatter plot showing the log10Qvalue vs the enrichment over Vector (calculated by log10FC of peptide counts +1) for the BRD4-Cs interacting proteins in the second GFP IP-MS replicate. D. Western blot validating the GFP IP-MS result using the elute from the second replicate. E. Track examples for total Pol II ChIP-seq signal at the PRSS22 and HSPA8 gene loci upon auxin treatment and rescue by different GFP-tagged mutants. F. Heatmap showing the genome-wide Pol II occupancy profile and the corresponding fold changes for the GFP-tagged rescue experiment. G. Track examples for Ser2P ChIP-seq signal at the BRD2 and HSPA8 gene loci upon auxin treatment and rescue by different GFP-tagged mutants. H. Heatmap showing the genome-wide Pol II occupancy profile and the corresponding fold changes for the GFP-tagged rescue experiment.
Figure 5.
Figure 5.. Identification of a distinct BRD4-PTEFb population: active but not histone acetylation-bound
A. Track examples for AID ChIP-seq in the BRD4-AID line and CCNT1 ChIP-seq in the BRD4-IAA7 line with/without auxin treatment (3h). H3K27ac ChIP-seq signal in the BRD4-AID line is shown for comparison. B. Heatmap showing the genome-wide BRD4 and CCNT1 occupancy profile and the corresponding fold change upon auxin treatment for the conditions in A. Genes ranked by BRD4 signal in control. C. Scatter plot showing the relative promoter density of CCNT1 vs BRD4, calculated by the log2RPKM of the ChIP-seq signals at the regions flanking (±1Kb) the Pol II pausing sites. D. Track examples for GFP ChIP-seq signal upon induction of GFP-tagged BRD4-FL or the indicated mutants (left). Heatmap showing the genome-wide fold changes of the GFP-tagged BRD4 mutants relative to the vector (right). The endogenous BRD4 was depleted by auxin treatment (3h) in all samples. Genes are ranked by GFP signal in the GFP-BRD4-FL condition. E. Track examples for CCNT1 ChIP-seq signal upon endogenous BRD4 depletion and rescue with indicated GFP-tagged mutants (left). Heatmap showing the genome-wide CCNT1 fold changes (right). Genes are ranked by CCNT1 signal in the untreated vector control. F. Track examples for the CCNT1 ChIP-seq signal upon induction of the FLAG-tagged, CTM-less BRD4 mutants by Dox treatment for 2 days (left). Heatmap showing the genome-wide profile of fold changes in CCNT1 occupancy (right). Genes are ranked by CCNT1 signal in the GFP control. G. Track examples for the Ser2P ChIP-seq from the same samples in F (left). Heatmap showing the corresponding genome-wide Ser2P occupancy profile (right). H. Track examples for the CCNT1 ChIP-seq in a series concentration of JQ1 and 250nM dBET6 treatment for 3h in the BRD4-IAA7 cells (left). Heatmap showing the corresponding genome-wide CCNT1 fold changes relative to DMSO treatment (right). Genes ranked by CCNT1 signal in the DMSO control. I. Track examples for the Ser2P ChIP-seq from the same JQ1 or dBET6-treated samples in H. J. Heatmap showing the corresponding genome-wide Ser2P occupancy profile.
Figure 6.
Figure 6.. The BRD4 C-terminus stabilizes CyclinT1 in the BRD4-PTEFb complex
A. Western blot of GFP IP showing the PTEFb complex components associated with BRD4 upon dCDK9 (2.5uM) treatment for 3h. GFP-tagged BRD4 -FL was induced by Dox treatment for 2 days. B. Schematic of the GFP-tagged constructs: BRD4-FL, BRD4-C and BRD4-ΔCd (deletion of the C-terminal disordered region). C. Western blot of GFP IP showing PTEFb complex components associated with BRD4 and its C terminal mutants. GFP-tagged BRD4-FL and mutant constructs were induced by Dox treatment for 2 days. Endogenous BRD4 was depleted in all samples by auxin treatment (3h) prior to IP. D. Track examples for the total Pol II ChIP-seq signal upon BRD4 depletion and rescue by BRD4-ΔCd. E. Heatmap showing the genome-wide Pol II occupancy and the corresponding fold changes for the rescue experiment in D. F. ECDF showing the log2PRR for the Pol II ChIP-seq for the rescue experiment in D. G. Boxplot showing the log2PRR for the Pol II ChIP-seq for the rescue experiment in D. H. AlphaFold-predicted structure for CTM of BRD4 and the PTEFb complex (344 CDK9 N-terminal residues, 293 N-terminal CCNT1 residues and 37 C-terminal BRD4 residues were used for the computational prediction.
Figure 7.
Figure 7.. The model for transcriptional regulation by a distinct layer of histone acetylation-unbound BRD4-PTEFb complex
Under normal cellular conditions, the majority of BRD4 molecules are associated with chromatin through binding to acetylated histone tails, and the PTEFb complex is recruited by its interaction with the C terminal of BRD4 to form the acetylation-bound “layer” of BRD4-PTEFb. A small portion of the remaining BRD4-PTEFb complex interacts with the Pol II CTD regardless of histone acetylation, forming a critical layer of BRD4-PTEFb that phosphorylates the Ser2 and Ser5 positions of the CTD heptapeptide repeats (Panel 1). BRD4 depletion achieved either by auxin in the BRD4 degron cells or dBET6 treatment results in genome-wide Pol II pausing (Panel 2). The acetylation-bound BRD4-PTEFb layer is displaced from the chromatin when cells are treated with the bromodomain inhibitor JQ1, but the acetylation-independent layer of BRD4-PTEFb can still function to release Pol II without histone recognition-mediated chromatin association (Panel 3). In the absence of acetylation (e.g., H3K27ac, H3K9ac, and H3K18ac deposited by CBP/GCN5), the acetylation-independent, Pol II-bound BRD4-PTEFb complex retains the ability in releasing Pol II (Panel 4).

References

    1. Core L, and Adelman K (2019). Promoter-proximal pausing of RNA polymerase II: A nexus of gene regulation. Genes Dev 33, 960–982. 10.1101/gad.325142.119. - DOI - PMC - PubMed
    1. Chen FX, Smith ER, and Shilatifard A (2018). Born to run: Control of transcription elongation by RNA polymerase II. Nat Rev Mol Cell Biol 19, 464–478. 10.1038/s41580-018-0010-5. - DOI - PubMed
    1. Adelman K, and Lis JT (2012). Promoter-proximal pausing of RNA polymerase II: emerging roles in metazoans. Nat Rev Genet 13, 720–731. 10.1038/nrg3293. - DOI - PMC - PubMed
    1. Price DH (2000). P-TEFb, a Cyclin-Dependent Kinase Controlling Elongation by RNA Polymerase II. - PMC - PubMed
    1. Peterlin BM, and Price DH (2006). Controlling the Elongation Phase of Transcription with P-TEFb. Mol Cell 23, 297–305. 10.1016/j.molcel.2006.06.014. - DOI - PubMed

Publication types

MeSH terms