. 2023 Sep 20;111(18):2899-2917.e6.
doi: 10.1016/j.neuron.2023.06.006. Epub 2023 Jul 12.

Toggling between food-seeking and self-preservation behaviors via hypothalamic response networks

Affiliations

Toggling between food-seeking and self-preservation behaviors via hypothalamic response networks

Isabel de Araujo Salgado et al. Neuron. .

Abstract

Motivated behaviors are often studied in isolation to assess labeled lines of neural connections underlying innate actions. However, in nature, multiple systems compete for expression of goal-directed behaviors via complex neural networks. Here, we examined flexible survival decisions in animals tasked with food seeking under predation threat. We found that predator exposure rapidly induced physiological, neuronal, and behavioral adaptations in mice highlighted by reduced food seeking and consumption contingent on current threat level. Diminishing conflict via internal state or external environment perturbations shifted feeding strategies. Predator introduction and/or selective manipulation of danger-responsive cholecystokinin (Cck) cells of the dorsal premammilary nucleus (PMd) suppressed hunger-sensitive Agouti-related peptide (AgRP) neurons, providing a mechanism for threat-evoked hypophagia. Increased caloric need enhanced food seeking under duress through AgRP pathways to the bed nucleus of the stria terminalis (BNST) and/or lateral hypothalamus (LH). Our results suggest oscillating interactions between systems underlying self-preservation and food seeking to promote optimal behavior.

Keywords: calcium imaging; cell-specific perturbation; chemogenetics; choice; conflict behavior; feeding; foraging; in vivo neural activity recordings; optogenetics; self-preservation.


Conflict of interest statement

Declaration of interests The authors declare no competing interests.

Figures

Figure 1.
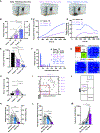
Figure 1.. Rat predator stimulus evokes physiological, behavioral, and neuronal changes in mice.
A. Graphic of cage where mice are presented with a (Top) stuffed rat or (Bottom) rat predator. B-D. Rat predator exposure increased (B) fecal output, (C) time spent immobile and (D) blood corticosterone levels compared to a stuffed rat (n=10). E. (Top) Brain schematic of fiber photometry surgery whereby Crh-iresCre animals were unilaterally injected with Cre-dependent GCaMP6s virus in the PVH and unilaterally implanted with an optical fiber over the PVH. (Bottom) Representative image of GCaMP6s expression in PVHCrh neurons. F. Average photometry traces under stuffed rat and rat predator conditions. G. Withinsubject quantification of PVHCrh population response to stuffed rat and rat predator exposure (n=5). H-K. Rat predator exposure increased (H) MAP, (I) HR and (J) Tb but had no effect on (K) physical activity compared to a stuffed rat (n=6). In all figures, *p < 0.05, **p < 0.01, ***p < 0.001 bars and error bars represent the mean ± SEM.
Figure 2.
Figure 2.. Rat predator exposure reduces food-seeking and consumption in hungry mice.
A. Graphic of cage used to evaluate behavior equipped with Feeding Experimental Device (FED), hide wall and water bottle. Adjoining cage is empty, containing a stuffed rat, TMT, or a rat predator. B. Raster plots of secondto-second food retrieval events during Trial and Post Phases (separated by black dotted line) across conditions. C-J. Rat predator exposure robustly (C) attenuates total food intake, (D) increases latency to retrieve the first pellet and blunts both (E-F) the rate of feeding and (G-J) inter-pellet interval between pellet retrieval and consumption (n=10). In all figures, *p < 0.05, **p < 0.01, ***p < 0.001 bars and error bars represent the mean ± SEM.
Figure 3.
Figure 3.. Diminishing conflict alters feeding behavior.
A. Graphic of cage used to evaluate behavior whereby the FED is located in either the Threat Zone (TZ) or Safe Zone (SZ). B-F. Safe Zone positioning of the FED escalates (B) total food intake and (C-D) rate of feeding while reducing (E) the latency to initiate feeding and (F) inter-pellet interval between pellet retrieval and consumption (n=8). G. Cage position schematic and average heat maps signifying the spatial position of mice across conditions. H. Hungry mice tasked with food-seeking in the Threat Zone spend a greater amount of time in the Threat Zone quadrant compared to the other conditions (n=8). I-J. Rat cage position schematic highlighting the rat snout location during individual pellet retrieval from the FED located in the Threat Zone for each mouse that consumed food. Red square signifies quadrant nearest to the FED occupied by the rat 43% of the entire trial time across experiments. Notably, only 14% of all pellets consumed by mice are done when the rat occupies this quadrant. (J-M) Positioning of the rat nearest to the FED (J) diminishes (K) total food intake and (L) time spent in the FED/Threat Zone while increasing (M) the latency to initiate feeding compared to positioning of the rat farthest from the FED or an empty adjacent cage (n=10). In all figures, *p < 0.05, **p < 0.01, ***p < 0.001 bars and error bars represent the mean ± SEM.
Figure 4.
Figure 4.. AgRP activity is rapidly blunted during rat predator presentation.
A. Graphic of cage used to assess Fos activity. B-C. Representative (B) images and (C) quantification demonstrating rat predator exposure lowers overlap between NPY and Fos expression in hungry mice compared to a stuffed rat (n=6 stuffed rat, n=8 rat predator). D. (Top) Brain schematic of fiber photometry surgery whereby Agrp-ires-Cre animals were unilaterally injected with Cre-dependent GCaMP6s virus in the ARC and unilaterally implanted with an optical fiber over the ARC. (Bottom) Representative image of GCaMP6s expression in AgRP neurons. E. Graphic of cage used to evaluate AgRP population activity. F. Average photometry traces aligned to 1) introduction of either the stuffed rat or rat predator (dotted line at 10 mins), 2) turning on the feeding device (2nd dotted line at 20 mins), and 3) removal of either the stuffed rat or rat predator (3rd dotted line at 30 mins). G. Corresponding heat maps of each individual animal under these conditions. H. Withinsubject quantification of AgRP population response demonstrating rat predator exposure suppresses AgRP activity compared to a stuffed rat (n=9). I. Within-subject quantification of AgRP population response to food during stuffed rat versus rat predator exposure (n=9). In all figures, *p < 0.05, **p < 0.01, ***p < 0.001 bars and error bars represent the mean ± SEM.
Figure 5.
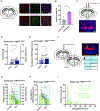
Figure 5.. PMdCck neurons respond to a rat predator and gate feeding behavior under threat.
A. Brain schematic and representative images of Cck-ires-Cre; Ai14-tdTomato animals examining expression of Fos activity in response to a rat predator versus an empty cage in the PMd. B. Quantification showing elevated Fos expression in PMdCck neurons in the rat predator condition compared to an empty cage (n=5 empty cage, n=6 rat predator). C. (Top) Brain schematic of chemogenetic surgery whereby Cck-ires-Cre animals were bilaterally injected with Cre-dependent hM4Di virus in the PMd. (Bottom) Representative image of hM4Di expression in PMdCck neurons. D-E. Silencing of PMdCck neurons in hungry mice increased (D) food intake and (E) time spent in the FED/Threat Zone in the presence of a rat predator compared to withinsubject controls (n=15). F. (Left) Brain schematic of optogenetic surgery whereby Cck-ires-Cre animals were unilaterally injected with Cre-dependent ChR2 virus in the PMd and unlaterally implanted with an optical fiber over the PMd. (Middle) Representative image of ChR2 expression in PMdCck neurons. (Right) Schematic of closed-loop optogenetic arena. G-I. Activation of PMdCck neurons in hungry mice decreased (G) food intake and (H) time spent in the FED/Threat Zone and increased (I) inter-pellet interval between pellet retrieval and consumption compared to within-subject controls. Blue background indicates photoactivation (n=10). In all figures, *p < 0.05, **p < 0.01, ***p < 0.001 bars and error bars represent the mean ± SEM.
Figure 6.
Figure 6.. PMdCck neurons gate feeding behavior through AgRP/Npy inhibition.
A. (Top) Brain schematic of chemogenetic/fiber photometry surgery whereby Cck-ires-Cre; Npy-ires2-FlpO animals were bilaterally injected with a Cre-dependent hM3Dq virus in the PMd, unilaterally injected with a FlpOdependent GCaMP6 virus in the ARC, and unilaterally implanted with an optical fiber over the ARC. (Bottom) Representative image of hM3Dq expression in PMdCck neurons and GCaMP6 expression in AgRP/Npy neurons. B. Average photometry traces aligned to 1) saline or CNO injection (dotted line at 10 mins) and 2) food presentation (2nd dotted line at 30 mins). C. Within-subject quantification of AgRP/Npy population response after saline versus CNO injection showing activation of PMdCck neurons acutely suppresses AgRP/Npy activity (n=9). D. Corresponding heat maps of each individual animal under these conditions. E. Average photometry traces aligned to 1) CNO injection (dotted line at 10 mins), 2) rat predator presentation (2nd dotted line at 30 mins) and 3) food presentation (3rd dotted line at 40 mins). F. Withinsubject quantification of AgRP/Npy population response after CNO injection followed by rat predator presentation showing the suppression of AgRP/Npy activity via PMdCck stimulation is not further reduced by rat predator introduction (n=6). G. (Top) Brain schematic of chemogenetic/fiber photometry surgery whereby Cck-ires-Cre; Npy-ires2-FlpO animals were bilaterally injected with a Cre-dependent hM4Di virus in the PMd, unilaterally injected with a FlpO-dependent GCaMP6 virus in the ARC, and unilaterally implanted with an optical fiber over the ARC. (Bottom) Representative image of hM4Di expression in PMdCck neurons and GCaMP6 expression in AgRP/Npy neurons. H. Average photometry traces aligned to 1) saline or CNO injection (dotted line at 10 mins), 2) rat predator presentation (2nd dotted line at 30 mins) and 3) food presentation (dotted line at 40 mins). I. Within-subject quantification of AgRP/Npy population response after saline/CNO injection followed by rat predator presentation showing PMdCck inhibition does not affect the rat predator-evoked suppression of AgRP/Npy activity (n=6). In all figures, *p < 0.05, **p < 0.01, ***p < 0.001 bars and error bars represent the mean ± SEM.
Figure 7.
Figure 7.. Feeding behavior under threat is scalable by internal state and mediated by AgRP neurons.
A. Graphic of cage used to evaluate behavior under varying degrees of physiological and artificial hunger. B. Lengthening period of caloric deprivation escalates food intake in both empty cage and rat predator conditions (n=10). C. (Top) Brain schematic of chemogenetic surgery whereby Agrp-ires-Cre animals were bilaterally injected with Cre-dependent hM4Di virus in the ARC. (Bottom) Representative image of hM4Di expression in AgRP neurons. D. Silencing of AgRP neurons in hungry mice reduces food intake in both empty cage and rat predator conditions (n=7). E. (Top) Brain schematic of optogenetic surgery whereby Agrp-ires-Cre animals were unilaterally injected with Cre-dependent ChR2 virus in the ARC and unlaterally implanted with an optical fiber over the ARC. (Bottom) Representative image of ChR2 expression in AgRP neurons. F-H. Both concurrent and preactivation of AgRP neurons (F) increases food intake, (G) decreases latency to initiate eating, and (H) augments feeding rate comparable to within-subject hungry mice in both empty cage and rat predator conditions (n=10). I-L. Rat predator exposure robustly blunts inter-pellet interval between pellet retrieval and consumption compared to empty cage condition under both physiological and artificial hunger. M. Brain schematic of optogenetic surgery whereby Agrp-ires-Cre animals were unilaterally injected with Cre-dependent ChR2 virus in the ARC and unlaterally implanted with an optical fiber over the BNST, PVH, LH or PVT. N. Activation of AgRP terminal fields in the BNST, LH, PVH and PVT promote food intake in the empty cage condition but only AgRP projections to the BNST and LH stimulate food intake during rat predator exposure (n=9 AgRP→BNST, n=8 AgRP→LH, n=7 AgRP→PVH, n=6 AgRP→PVT). In all figures, *p < 0.05, **p < 0.01, ***p < 0.001 bars and error bars represent the mean ± SEM.

References

    1. Flavell SW, Gogolla N, Lovett-Barron M, and Zelikowsky M (2022). The emergence and influence of internal states. Neuron 110, 2545–2570. 10.1016/j.neuron.2022.04.030. - DOI - PMC - PubMed
    1. Grillner S, Hellgren J, Ménard A, Saitoh K, and Wikström MA (2005). Mechanisms for selection of basic motor programs--roles for the striatum and pallidum. Trends Neurosci. 28, 364–370. 10.1016/j.tins.2005.05.004. - DOI - PubMed
    1. Toates FM (1981). The control of ingestive behaviour by internal and external stimuli--a theoretical review. Appetite 2, 35–50. 10.1016/s0195-6663(81)80035-9. - DOI - PubMed
    1. Levine DN (2007). Sherrington’s “The Integrative action of the nervous system”: a centennial appraisal. J. Neurol. Sci 253, 1–6. 10.1016/j.jns.2006.12.002. - DOI - PubMed
    1. Lima SL, and Bednekoff PA (1999). Temporal Variation in Danger Drives Antipredator Behavior: The Predation Risk Allocation Hypothesis. Am. Nat 153, 649–659. 10.1086/303202. - DOI - PubMed

Publication types

Substances

LinkOut - more resources