. 2023 Jul 13;80(8):202.
doi: 10.1007/s00018-023-04850-4.

Sorcin promotes migration in cancer and regulates the EGF-dependent EGFR signaling pathways

Affiliations

Sorcin promotes migration in cancer and regulates the EGF-dependent EGFR signaling pathways

Claudia Tito et al. Cell Mol Life Sci. .

Abstract

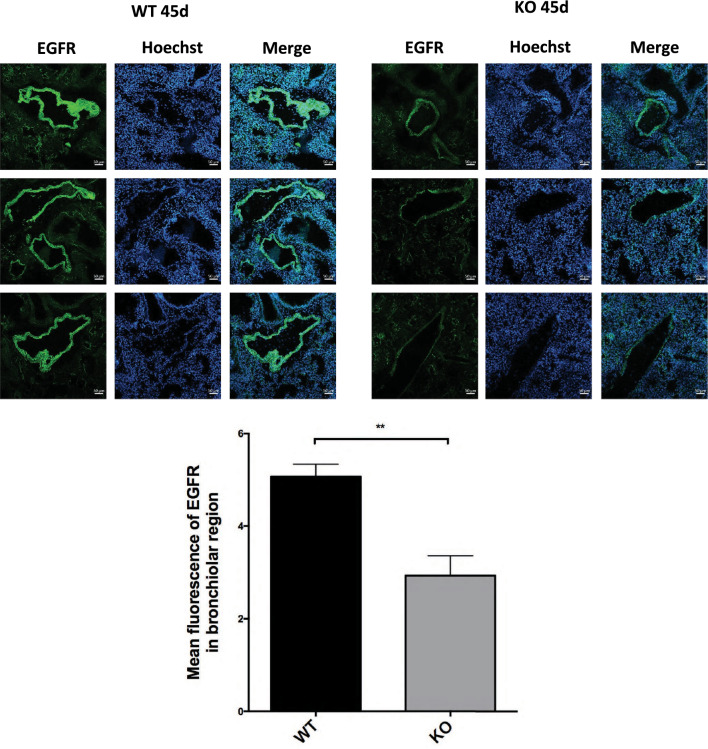
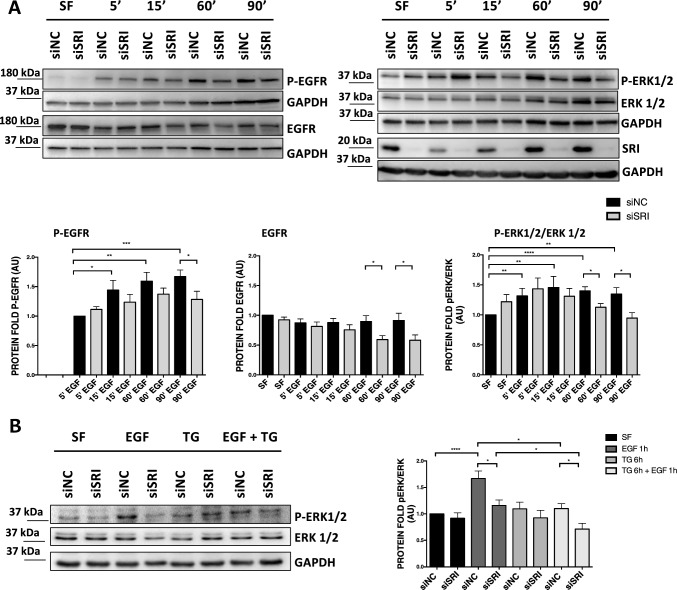
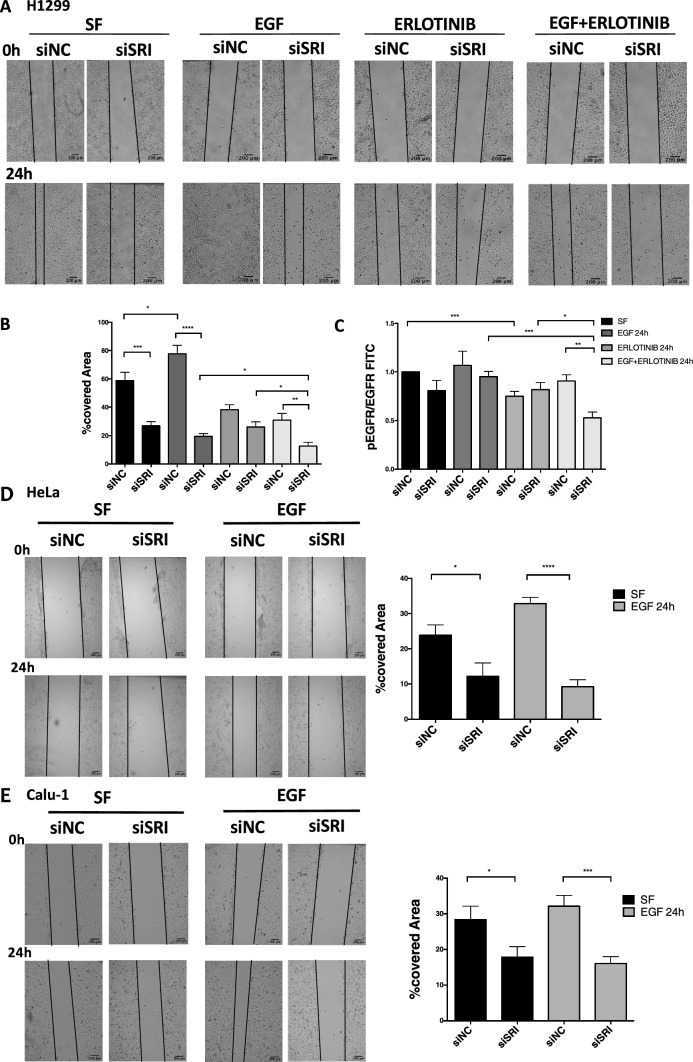
The epidermal growth factor receptor (EGFR) is one of the main tumor drivers and is an important therapeutic target for many cancers. Calcium is important in EGFR signaling pathways. Sorcin is one of the most important calcium sensor proteins, overexpressed in many tumors, that promotes cell proliferation, migration, invasion, epithelial-to-mesenchymal transition, malignant progression and resistance to chemotherapeutic drugs. The present work elucidates a functional mechanism that links calcium homeostasis to EGFR signaling in cancer. Sorcin and EGFR expression are significantly correlated and associated with reduced overall survival in cancer patients. Mechanistically, Sorcin directly binds EGFR protein in a calcium-dependent fashion and regulates calcium (dys)homeostasis linked to EGF-dependent EGFR signaling. Moreover, Sorcin controls EGFR proteostasis and signaling and increases its phosphorylation, leading to increased EGF-dependent migration and invasion. Of note, silencing of Sorcin cooperates with EGFR inhibitors in the regulation of migration, highlighting calcium signaling pathway as an exploitable target to enhance the effectiveness of EGFR-targeting therapies.

Keywords: Calcium; Cancer; EGF; EGFR; Epithelial-to-mesenchymal transition; Invasion; Migration; Signaling; Sorcin.


Conflict of interest statement

The authors declare that they have no competing interests.

Figures

Fig. 1
Fig. 1
Sorcin and EGFR copy number alterations and expression are correlated in the TCGA PanCancer study. A Oncoprint visualization of Sorcin (SRI) and EGFR genetic alterations in the PanCancer TCGA study [57] considering 2583 patients. Evaluation of co-occurrence is shown in the bottom table. B SRI mRNA expression in the groups of tumors characterized by different SRI copy number status, as indicated from the color code in right legend. C Same plot as in (B), but showing as described by the color code the distribution of EGFR copy number. D Pearson's correlation analysis of EGFR and SRI mRNA expression in the PanCancer TCGA study. E Kaplan–Meier analysis of the impact of EGFR/SRI signature expression (RNAseq) on overall survival in the indicated tumor types: high level of expression of SRI and EGFR, considered as a signature (red), compared to low expression (black)
Fig. 2
Fig. 2
Sorcin knock-out reduces EGFR in the bronchiolar region of mice lungs. Confocal microscopy staining in lung tissues of adult (6 weeks old) C57/BL6 WT and KO Sorcin mice to evaluate the expression of EGFR protein (green). Scale bars, 50 µm. Quantification analysis of protein fluorescence intensity by ImageJ software plugin in the bronchiolar region. Error bars indicate means ± SEM. **p < 0.01 as determined by Student’s t test [analysis was performed in 10 lung’s section per 4 mice per group (C57/BL6 WT versus KO Sorcin mice)]
Fig. 3
Fig. 3
Role of Sorcin protein in the EGFR signaling pathway upon EGF stimulation. A H1299 cells were silenced for SRI protein (siSRI) for 48 h, starved for 2 h in serum-free medium (SF) and then treated or not with low doses of EGF (5 ng/mL) at the indicated time points. Western blot analysis showed Sorcin downregulation and total EGFR, EGFR and ERK 1/2 phosphorylation levels upon Sorcin silencing (siSRI) and EGF stimulation. Densitometry analysis is shown in the right graphs. Error bars indicate means ± SEM. *p < 0.05, **p < 0.01, ***p < 0.001, ****p < 0.0001 as determined by Student’s t test (n = 4). B H1299 cells were silenced for Sorcin (siSRI) for 48 h, then treated with thapsigargin (TG) [an inhibitor of sarco/endoplasmic reticulum Ca2+ ATPase (SERCA)] for 6 h and then with EGF for 1 h, after 2 h of starvation in serum-free medium (SF). Western blot analysis of p-ERK1/2 and ERK1/2 expression. Densitometry analysis is shown in the lower graph. Error bars indicate means ± SEM. *p < 0.05, ****p < 0.0001 as determined by Student’s t test (n = 3)
Fig. 4
Fig. 4
Involvement of Sorcin in the regulation of invasion and EMT program in H1299, HeLa and Calu-1 upon EGF stimulation. A Invasion was evaluated through Matrigel-coated transwell assay in H1299 cells cultured in serum-free medium (SF) (left panels) or in the presence of EGF (right panels) in control experiments (siNC, top panels) and upon silencing of Sorcin (siSRI, bottom panels). Crystal violet staining was measured at 590-nm absorbance. Error bars indicate means ± SEM. *p < 0.05 and **p < 0.01 as determined by Student’s t test (n = 3). B–D Western blot analysis of EMT proteins N-cadherin, Snai1 and Slug, upon 48 h of Sorcin silencing (siSRI), 2 h of starvation in serum-free medium (SF) and 24 h of EGF stimulation in H1299 (B), HeLa (C) and Calu-1 (D) cells. Densitometry analysis is shown in lower graphs. Error bars indicate means ± SEM. *p < 0.05, **p < 0.01 and ****p < 0.0001 as determined by Student’s t test (n = 3)
Fig. 5
Fig. 5
Role of Sorcin in cell migration after EGF and/or Erlotinib treatment. A Wound-healing assay in H1299 cells cultured in serum-free medium (SF) or in the presence of EGF and erlotinib, in control experiments (siNC) and upon silencing of Sorcin (siSRI). Images were acquired at 0 h and 24 h after each single and combined treatment. B Quantification of wound-healing assay calculated as percentage of wound closure: ((At0 – At1)/ At0) × 100), where At0 is the initial wound area and At1 is the wound area n hours after the initial scratch. Error bars indicate means ± SEM. *p < 0.05, **p < 0.01, ***p < 0.001 and ****p < 0.0001 as determined by Student’s t test (n = 3). Scale bars, 200 µm. C Flow cytometric analysis showed expression of total and phosphorylated EGFR upon Sorcin silencing and 24 h of EGF and/or erlotinib treatment. Error bars indicate means ± SEM. *p < 0.05, **p < 0.01, and ***p < 0.001 as determined by Student’s t test (n = 3). D–E Wound-healing assay in HeLa (D) and Calu-1 (E) cells cultured in serum-free medium (SF) or in the presence of EGF, upon silencing of Sorcin (siSRI). Images were acquired at 0 h and 24 h after EGF treatment (1 ng/mL). Quantification of wound-healing assay calculated as percentage of wound closure: ((At0At1)/At0) × 100), where At0 is the initial wound area and At1 is the wound area n hours after the initial scratch. Error bars indicate means ± SEM. *p < 0.05, ***p < 0.001 and ****p < 0.0001 as determined by Student’s t test (n = 3). Scale bars, 200 µm
Fig. 6
Fig. 6
Role of Sorcin in cell migration after EGF and IGF treatment. Wound-healing assay in H1299 cells cultured in serum-free medium (SF) or in the presence of EGF and IGF, in control experiments (siNC) and upon silencing of Sorcin (siSRI). Images were acquired at 0 h and 24 h after each single treatment. Quantification of wound-healing assay calculated as percentage of wound closure: ((At0At1)/ At0) × 100), where At0 is the initial wound area and At1 is the wound area n hours after the initial scratch. Error bars indicate means ± SEM. **p < 0.01, ***p < 0.001 and ****p < 0.0001 as determined by Student’s t test (n = 3). Scale bars, 200 µm
Fig. 7
Fig. 7
Sorcin binds EGFR and alters EGFR-dependent calcium signaling. A Western blot analysis of H1299 cells silenced for Sorcin (siSRI) for 48 h, treated with cycloheximide (CHX) for 6 h to inhibit EGFR synthesis and then treated with EGF for 1 h, after 2 h of starvation in serum-free medium (SF). Densitometry analysis is shown in the right graph. Error bars indicate means ± SEM. *p < 0.05 as determined by Student’s t test (n = 3). B SPR experiments showing the binding of wt Sorcin (left) and Sorcin W105G (right) to immobilized C-terminal intracellular domain of EGFR. Sorcin was injected at the following concentrations: 312 nM, 625 nM, 1.25 μM, 2.5 μM, 5 μM and 10 μM, at a constant flow (nominal flow rate = 30 μl/min), in the presence of CaCl2 at 100 μM concentration; kinetic evaluation of the sensorgrams was obtained using the SensiQ Qdat program and full fitting with 1 site (Langmuir interaction). EGFR binds wt Sorcin directly and with high affinity (KD = 2.9 μM), while the affinity of EGFR for Sorcin W105G mutant is an order of magnitude lower (KD = 21 μM). CF Luminescence-based Ca2+ measurement using an organelle-targeted aequorin probe specific for the cytoplasm (cytAEQ) showing cytosolic Ca2+ transients of H1299 or HeLa cells transfected with either a non-specific control siRNA or a specific siRNA against Sorcin measured after their exposure to stimuli. Time-dependent luminescence measurements (top) and cytosolic Ca2+ measurements (bottom) were obtained. Error bars indicate means ± SEM. *p < 0.05; **p < 0.01; ****p < 0.0001, as determined by Student’s t test. C Measure of cytosolic Ca2+ transients of H1299 cells transfected with either a non-specific control siRNA (SCR) or a specific siRNA against Sorcin measured after their exposure to 100 ng/mL EGF. D Measure of cytosolic Ca2+ transients of H1299 cells transfected with either a non-specific control siRNA or a specific siRNA against Sorcin measured after their exposure to 100 μM Histamine. E Measure of cytosolic Ca2+ transients of H1299 cells transfected with either a non-specific control siRNA or a specific siRNA against Sorcin measured after their exposure to EGF in the presence of 2 mM EGTA, to prevent the influx of extracellular calcium, and 20 μM CPA, to inhibit SERCA pumps and the reuptake of calcium in the ER. F Measure of cytosolic Ca2+ transients of HeLa cells transfected with either a non-specific control siRNA or a specific siRNA against Sorcin, measured after their exposure to 100 ng/mL EGF

Similar articles

Cited by

References

    1. Caldieri G, Barbieri E, Nappo G, Raimondi A, Bonora M, Conte A, et al. Reticulon 3-dependent ER-PM contact sites control EGFR nonclathrin endocytosis. Science. 2017;356(6338):617–624. doi: 10.1126/science.aah6152. - DOI - PMC - PubMed
    1. da Santos ES, Nogueira KAB, Fernandes LCC, Martins JRP, Reis AVF, de Neto JBV, et al. EGFR targeting for cancer therapy: pharmacology and immunoconjugates with drugs and nanoparticles. Int J Pharma. 2021;592:120082. doi: 10.1016/j.ijpharm.2020.120082. - DOI - PubMed
    1. Avraham R, Yarden Y. Feedback regulation of EGFR signalling: decision making by early and delayed loops. Nat Rev Mol Cell Biol. 2011;12(2):104–117. doi: 10.1038/nrm3048. - DOI - PubMed
    1. Tomas A, Futter CE, Eden ER. EGF receptor trafficking: consequences for signaling and cancer. Trends Cell Biol. 2014;24(1):26–34. doi: 10.1016/j.tcb.2013.11.002. - DOI - PMC - PubMed
    1. Lindsey S, Langhans SA. Epidermal growth factor signaling in transformed cells. Int Rev Cell Mol Biol. 2015;314:1–41. doi: 10.1016/bs.ircmb.2014.10.001. - DOI - PMC - PubMed