. 2023 Jul 13;42(1):167.
doi: 10.1186/s13046-023-02737-7.

CD271 activation prevents low to high-risk progression of cutaneous squamous cell carcinoma and improves therapy outcomes

Affiliations

CD271 activation prevents low to high-risk progression of cutaneous squamous cell carcinoma and improves therapy outcomes

Marika Quadri et al. J Exp Clin Cancer Res. .

Abstract

Background: Cutaneous squamous cell carcinoma (cSCC) is the second most prevalent form of skin cancer, showing a rapid increasing incidence worldwide. Although most cSCC can be cured by surgery, a sizeable number of cases are diagnosed at advanced stages, with local invasion and distant metastatic lesions. In the skin, neurotrophins (NTs) and their receptors (CD271 and Trk) form a complex network regulating epidermal homeostasis. Recently, several works suggested a significant implication of NT receptors in cancer. However, CD271 functions in epithelial tumors are controversial and its precise role in cSCC is still to be defined.

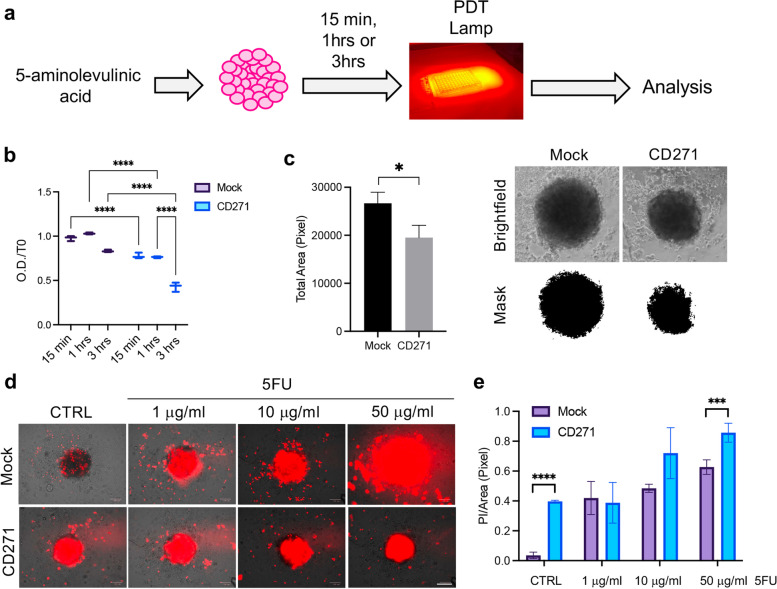
Methods: Spheroids from cSCC patients with low-risk (In situ or Well-Differentiated cSCC) or high-risk tumors (Moderately/Poorly Differentiated cSCC), were established to explore histological features, proliferation, invasion abilities, and molecular pathways modulated in response to CD271 overexpression or activation in vitro. The effect of CD271 activities on the response to therapeutics was also investigated. The impact on the metastatic process and inflammation was explored in vivo and in vitro, by using zebrafish xenograft and 2D/3D models.

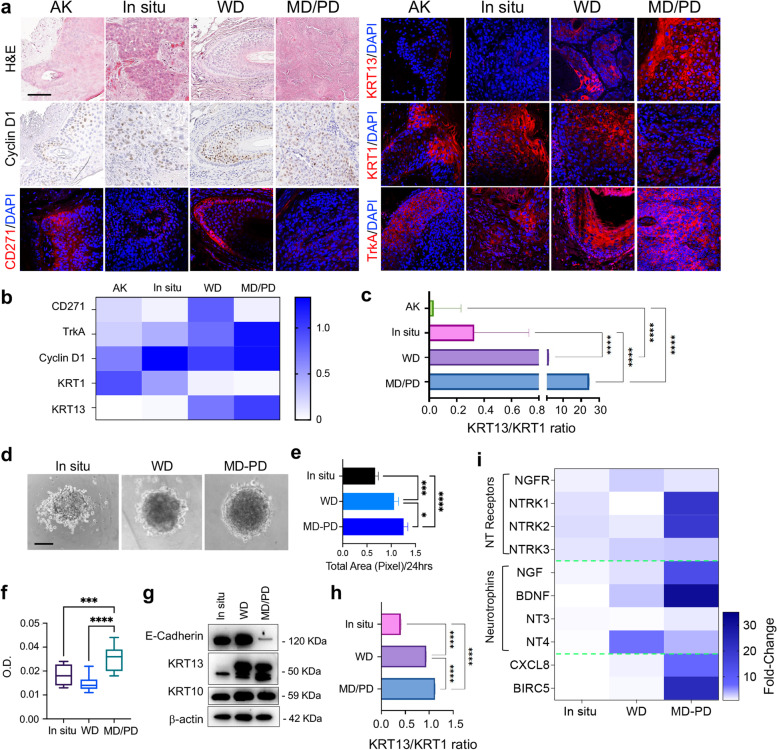
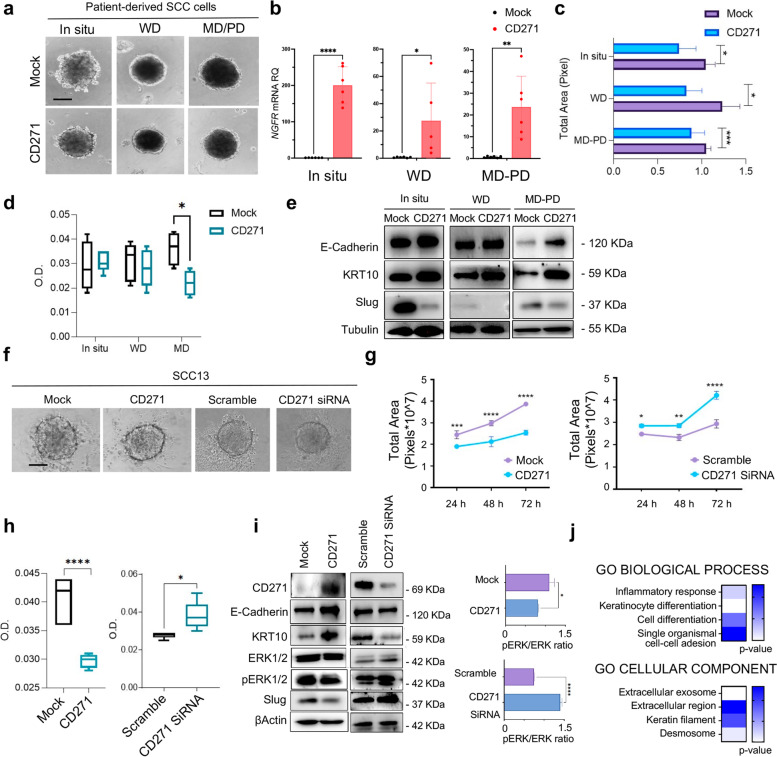
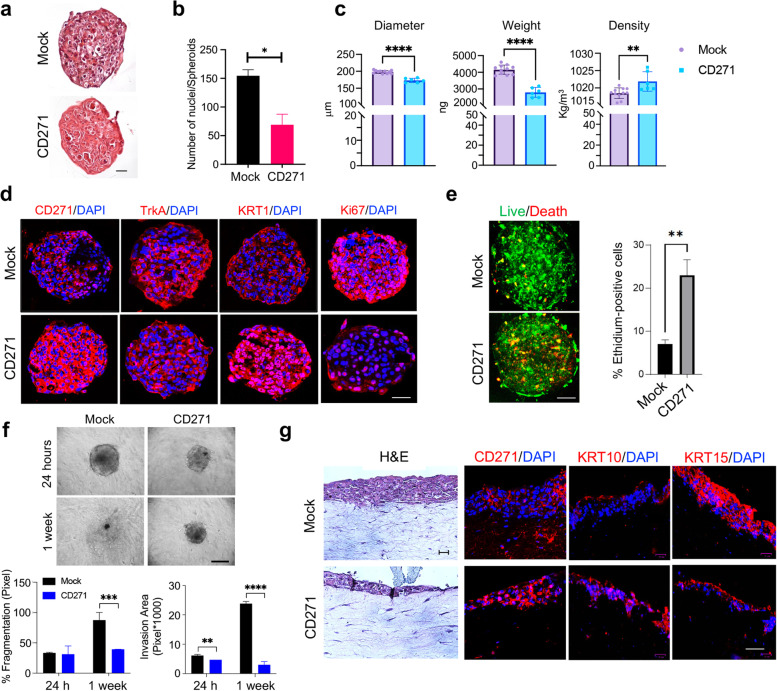
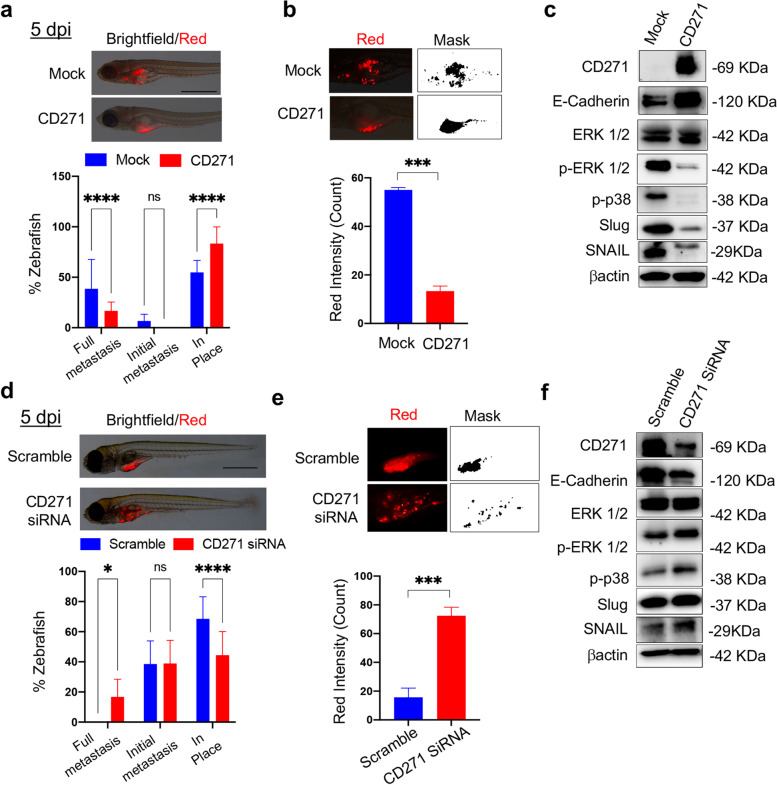
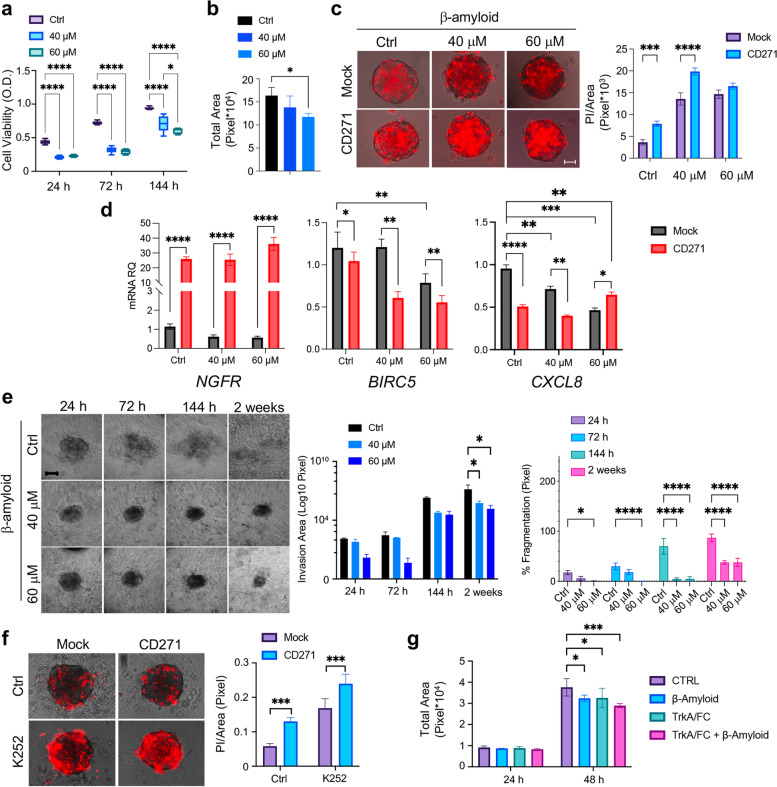
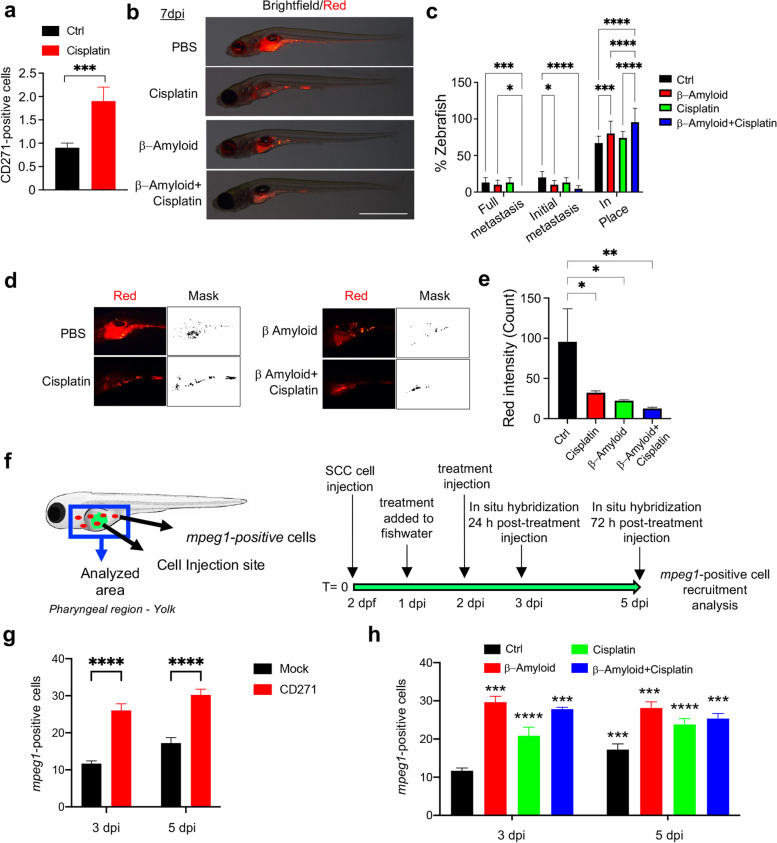
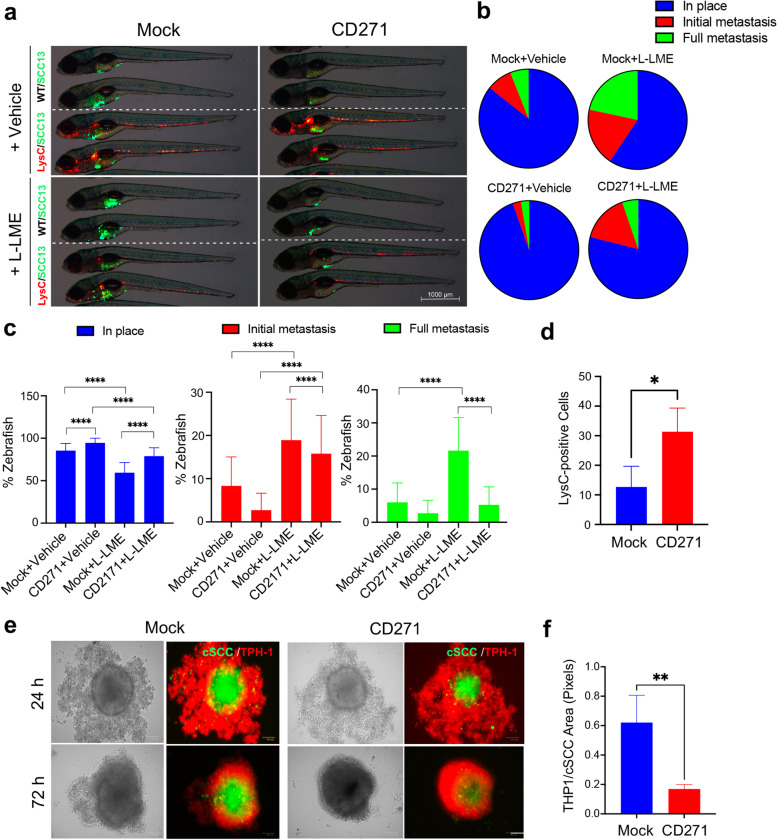
Results: Our data proved that CD271 is upregulated in Well-Differentiated tumors as compared to the more aggressive Moderately/Poorly Differentiated cSCC, both in vivo and in vitro. We demonstrated that CD271 activities reduce proliferation and malignancy marker expression in patient-derived cSCC spheroids at each tumor grade, by increasing neoplastic cell differentiation. CD271 overexpression significantly increases cSCC spheroid mass density, while it reduces their weight and diameter, and promotes a major fold-enrichment in differentiation and keratinization genes. Moreover, both CD271 overexpression and activation decrease cSCC cell invasiveness in vitro. A significant inhibition of the metastatic process by CD271 was observed in a newly established zebrafish cSCC model. We found that the recruitment of leucocytes by CD271-overexpressing cells directly correlates with tumor killing and this finding was further highlighted by monocyte infiltration in a THP-1-SCC13 3D model. Finally, CD271 activity synergizes with Trk receptor inhibition, by reducing spheroid viability, and significantly improves the outcome of photodynamic therapy (PTD) or chemotherapy in spheroids and zebrafish.

Conclusion: Our study provides evidence that CD271 could prevent the switch between low to high-risk cSCC tumors. Because CD271 contributes to maintaining active differentiative paths and favors the response to therapies, it might be a promising target for future pharmaceutical development.

Keywords: 3D models; CD271; Cutaneous squamous cell carcinoma; Trk receptors; Zebrafish.


Conflict of interest statement

The authors declare no conflict of interest. F.M. is the inventor of patent No. 102020000006031.

Figures

Fig. 1
Fig. 1
CD271 expression in cSCC biopsies and spheroids a Hematoxylin and Eosin (H&E) staining of AK, in situ, WD and MD/PD cSCC biopsies. CD271, Cyclin D1, TrkA, KRT1 and KRT13 expression evaluated by immunohistochemistry or immunofluorescence. Scale bar 100 µm. b Immunohistochemistry and immunofluorescence staining scored as follow: 0 (no cells; positivity to 20% of cells positivity), 0.1–0.75 (30–50% of cells positivity; 1–1.5 (60% to 100% of cells positivity). c Graphical representation of the KRT13/KRT1 intensity ratio. d Representative pictures of in situ, WD, and MD/PD spheroids. Scale bar = 100 μm. e Spheroid total area measured by ImageJ software and f spheroid viability evaluated by MTT assay. g Expression of E-cadherin, KRT13, and KRT10 evaluated in patient-derived spheroids by western blotting. β-actin was used as control. h Graphical representation of KRT13 and KRT10 relative protein expression ratio. i NTs and NTRs mRNA expression evaluated in patient-derived spheroids by qPCR. Heatmap created by Prism Graph pad software. β-actin was used as a housekeeping gene. For all experiments, the results are shown as mean ± SD of three independent experiments. Statistical analysis was performed using the two-way ANOVA. *0.01 < p < 0.05, ***0.0001 < p < 0.001, ****p < 0.0001
Fig. 2
Fig. 2
CD271 modulation affects cSCC spheroid phenotype a Representative picture of in situ, WD, or MD/PD patient-derived CD271-transduced or mock spheroids. Scale bar = 100 μm b CD271 expression by qPCR. β-actin was used as housekeeping gene. c Spheroid total area measured by ImageJ software. d Spheroid viability evaluated by MTT assay. e E-cadherin, KRT10, and Slug expression evaluated in patient-derived spheroids by western blotting. Tubulin was used as loading control. f Representative picture of SCC13 spheroids treated as described. Scale bar = 100 μm g Spheroid total area measured by ImageJ software. h Spheroid viability evaluated by MTT assay. i CD271, E-cadherin, KRT10, ERK1/2, pERK1/2, and Slug expression evaluated in CD271-overexpressing or silenced SCC13 spheroids by western blotting. pERK1/2/ERK1/2 expression ratio analyzed by ImageJ software. β-actin was used as loading control. j GO Biological Process term fold-Enrichment of RNA-seq data of CD271-transduced SCC13 spheroids vs mock determined by PANTHER Tools (a triplicate for n = 80 mock or CD271 spheroids). For all experiments, the results are shown as mean ± SD of three independent experiments. Statistical analysis was performed using the two-way ANOVA or multiparametric T-test. *0.01 < p < 0.05, **0.001 < p < 0.01, ***0.0001 < p < 0.001, ****p < 0.0001
Fig. 3
Fig. 3
CD271 overexpression promotes cSCC differentiation a CD271 and mock spheroids were fixed with 4% PFA and embedded in paraffin. Spheroid histology was evaluated by Hematoxylin and Eosin (H&E) staining (scale bar = 50 μm) and b the number of nuclei was measured by ImageJ software. c Density, Weight, and Diameter of SCC13-Spheroids measured by W8™. A minimum of 10 single spheroids was analyzed for each test condition and values were extrapolated from at least 10 repetitions. d The expression of CD271, TrkA, KRT1 and Ki67 were evaluated in mock vs CD271-overexpressing SCC13-spheroids by immunofluorescence. Nuclei were stained with DAPI. e Left panel: Viability and apoptosis were measured in CD271 vs mock spheroids by LIVE/DEAD® assay (Calcein: Green, Ethidium Bromide Red). Right panel: percentage of Ethidium Bromide positive cells determined by ImageJ software analysis of micrographs. Scale bar = 50 μm f CD271 and mock spheroids implanted into collagen I and dermal fibroblast matrix and monitored for 2 weeks (scale bar = 100 μm). % of fragmentation and invasion area was determined by ImageJ software analysis. g H&E and CD271, KRT10, and KRT15 expression evaluated by immunofluorescence of mock and CD271-overexpressing SCC13-derived skin reconstruct. Nuclei were stained with DAPI. Statistical analysis was performed using the two-way ANOVA and multiparametric T-test. *0.01 < p < 0.05, **0.001 < p < 0.01, ***0.0001 < p < 0.001, ****p < 0.0001. Scale bar = 50 µm
Fig.4
Fig.4
CD271 expression abolishes cSCC metastasis in zebrafish a Above panel: Zebrafish injected with mock or CD271-overexpressing fluorescent stained SCC13 cells (red; about 50 cells/embryo) at 5 dpi (day post-injection). Scale bar = 500 µm. Bottom panel: Metastases were quantified and classified as Full metastases, Initial metastases, and In place. b Above panel: Representative detail of fluorescent cSCC cells (red) and ImageJ mask. Bottom panel: Quantification of the red fluorescent intensity of cell mass in zebrafish by ImageJ software. c Expression of CD271, E-Cadherin, ERK1/2, pERK1/2, p-p38, Slug and Snail in cell injected into zebrafish. βactin was used as loading control. d Above panel: Zebrafish injected with scramble or CD271-silenced fluorescent stained SCC13 cells (red; about 50 cells/embryo) at 5 dpi (day post-injection). Scale bar = 500 µm. Bottom panel: Metastasis quantification as in (a). e Above panel: Representative detail of fluorescent cSCC cells in red and ImageJ mask. Bottom panel: quantification of the red fluorescent intensity of cell mass in zebrafish by ImageJ software. f Expression of CD271, E-Cadherin, ERK1/2, pERK1/2, p-p38, Slug and Snail in cell injected into zebrafish. βactin was used as loading control. Results are shown as the mean percentage of three independent experiments and a minimum of 20 injected zebrafish for each condition was used. Statistical analysis was performed using the two-way ANOVA and multiparametric T-test. *0.01 < p < 0.05, ***0.0001 < p < 0.001, ****p < 0.0001
Fig. 5
Fig. 5
CD271 modulation improves PDT or chemotherapy efficiency a Schematic representation of photodynamic therapy (PDT) on SCC spheroids. b Cell viability evaluated at 24 h in mock vs CD271-overexpressing SCC13-derived spheroids treated with PDT for 15 min, 1 h or 3 h (n = 3). c Left panel: Spheroids total area, corresponding to 3 h PDT treatment, evaluated at 24 h. Right panel: representative brightfield images and ImageJ mask of mock and CD271-overexpressing spheroids d Representative images for PI staining (red)/brightfield of mock vs CD271 spheroids after treatment with 5FU (1, 10 and 50 μg/ml) or DMSO (control) at 48 h. Scale bar = 100 μm e Histogram representing PI staining/total spheroid area ratio (for each condition, n = 3). Results are shown as mean ± SD. Statistical analysis was performed using the two-way ANOVA and multiparametric t-test. *0.01 < p < 0.05, ***0.0001 < p < 0.001, ****p < 0.0001
Fig. 6
Fig. 6
Effects of CD271 activation on cSCC spheroid viability and invasion a Cell viability (MTT assay) and b total area of SCC13 spheroids (n≥6) after β-Amyloid (40 μM and 60 μM) treatment as compared to control (PBS). c Left panel: Propidium Iodide (PI) staining (red)/brightfield on mock vs CD271-overexpressing SCC13 spheroids after β-Amyloid treatment as compared to control (PBS) at 48 h. Right: Bar chart representing PI-stained area (Pixel) (n = 3). Scale bar = 50 μm d NGFR, BIRC5 and CXCL8 mRNA levels (n = 8). e Left panel: Representative images of SCC13-derived implanted spheroid treated with β-Amyloid or PBS (control) and monitored for 2 weeks (scale bar = 50 μm). Middle panel: total invasion area. Right panel: percentage of fragmentation. f Left panel: PI staining/brightfield of CD271 and mock SCC13 spheroids treated with K252 (200 nM) or DMSO at 48 h. Right panel: Quantification of the PI staining/Total area ratio. Scale bar = 50 μm g Total area of SCC13 spheroids treated with TrkA/Fc (2 µg/ml), βAmyloid (40 μM) or the combinations TrkA/FC/βAmyloid (n = 3). Results are shown as mean ± SD of three independent experiments. Statistical analysis was performed using the two-way ANOVA and multiparametric T-test. *0.01 < p < 0.05, **0.001 < p < 0.01, ***0.0001 < p < 0.001, ****p < 0.0001
Fig. 7
Fig. 7
CD271 activation increases response to chemotherapy and promotes macrophage recruitment in zebrafish a CD271 expression in SCC13 cells treated with Cisplatin (5μg/mL) vs control by FACS. b Representative images of SCC13 cells (red) injected into zebrafish at 7dpi after treatments as described. Scale bar = 500µm. c cSCC metastasis quantified and classified as Full metastases, Initial metastases, or In place. d-e Quantification of the red fluorescence intensity of tumor mass in zebrafish by ImageJ software and ImageJ mask. f Left images: schematic representation of mpeg1 positive cells (red) in zebrafish injected with mock or CD271-overexpressing cells (green) within the analyzed area (blue). Right images: schematic representation of treatments. g Quantification of mpeg1-positive cells in zebrafish injected with mock or CD271-overexpressing cells and h in zebrafish injected with SCC13 cells after treatments as described, by whole-mount in situ hybridization. PBS was used as a control (n = 3, 3 independent evaluations). Results are shown as the mean percentage of three independent experiments (minimum of 20 injected zebrafish/condition). Statistical analysis was performed using the two-way ANOVA and multiparametric T-test. *0.01 < p < 0.05, **0.001 < p < 0.01, ***0.0001 < p < 0.001, ****p < 0.0001
Fig. 8
Fig. 8
CD271 expression increases the immune cell recruitment in vivo and in vitro a Representative images of mock and CD271-overexpressing SCC13 cells (green) injected into WT (indicated as WT/SCC13 in the figure) or Tg(lysC:DcRed)nz50 (indicated as LysC/SCC13) zebrafish with or without the simultaneous treatment with the L-LME. In the Tg(lysC:DcRed2)nz50 zebrafish, leucocytes possess a red fluorescence. Scale bar = 500 µm. b and c cSCC metastases quantified and classified as Full metastases, Initial metastases, or In place. d Quantification of LysC-positive cells in zebrafish injected with mock or CD271-overexpressing cells e SCC13 cells were stained with Vybrant DIO Cell-Labeling Solution (green) and seeded in a 96-well plate coated with 1,5% of agar. cSCC spheroids were transduced by infection with mock or CD271 viral vectors. After 72 h, THP-1 cells were stained with Vybrant DII Cell-Labeling Solution (red) and co-cultured with cSCC spheroids. Pictures were made after 24 and 72 h from the THP-1 seeding. Scale bar = 100µm. f The invasion area of THP-1 was measured by ImageJ software. Results are shown as the mean percentage of three independent experiments (minimum of 20 injected zebrafish/condition). Statistical analysis was performed using the two-way ANOVA and multiparametric T-test. **0.001 < p < 0.01, ****p < 0.0001

References

    1. Nagarajan P, Asgari MM, Green AC, Guhan SM, Arron ST, Proby CM, et al. Keratinocyte carcinomas: current concepts and future research priorities. Clin Cancer Res. 2019;25(8):2379–2391. doi: 10.1158/1078-0432.CCR-18-1122. - DOI - PMC - PubMed
    1. Leiter U, Keim U, Garbe C. Epidemiology of Skin Cancer: Update 2019. In: Reichrath J, editor. Sunlight, Vitamin D and Skin Cancer. Cham: Springer International Publishing; 2020 [cited 2022 Jan 27]. p. 123–39. (Advances in Experimental Medicine and Biology; vol. 1268). Available from: http://link.springer.com/10.1007/978-3-030-46227-7_6 - DOI - PubMed
    1. Stratigos AJ, Garbe C, Dessinioti C, Lebbe C, Bataille V, Bastholt L, et al. European interdisciplinary guideline on invasive squamous cell carcinoma of the skin: Part 2 Treatment. Eur J Cancer. 2020;128:83–102. doi: 10.1016/j.ejca.2020.01.008. - DOI - PubMed
    1. Farasat S, Yu SS, Neel VA, Nehal KS, Lardaro T, Mihm MC, et al. A new American Joint Committee on Cancer staging system for cutaneous squamous cell carcinoma: creation and rationale for inclusion of tumor (T) characteristics. J Am Acad Dermatol. 2011;64(6):1051–1059. doi: 10.1016/j.jaad.2010.08.033. - DOI - PMC - PubMed
    1. Thompson AK, Kelley BF, Prokop LJ, Murad MH, Baum CL. Risk factors for cutaneous squamous cell carcinoma recurrence, metastasis, and disease-specific death: a systematic review and meta-analysis. JAMA Dermatol. 2016;152(4):419–428. doi: 10.1001/jamadermatol.2015.4994. - DOI - PMC - PubMed