

Stability selection enhances feature selection and enables accurate prediction of gestational age using only five DNA methylation sites
- PMID: 37443060
- PMCID: PMC10339624
- DOI: 10.1186/s13148-023-01528-3
Stability selection enhances feature selection and enables accurate prediction of gestational age using only five DNA methylation sites
Abstract
Background: DNA methylation (DNAm) is robustly associated with chronological age in children and adults, and gestational age (GA) in newborns. This property has enabled the development of several epigenetic clocks that can accurately predict chronological age and GA. However, the lack of overlap in predictive CpGs across different epigenetic clocks remains elusive. Our main aim was therefore to identify and characterize CpGs that are stably predictive of GA.
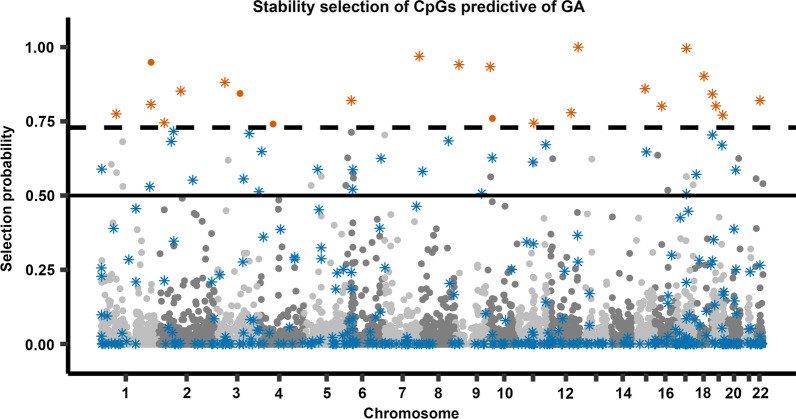
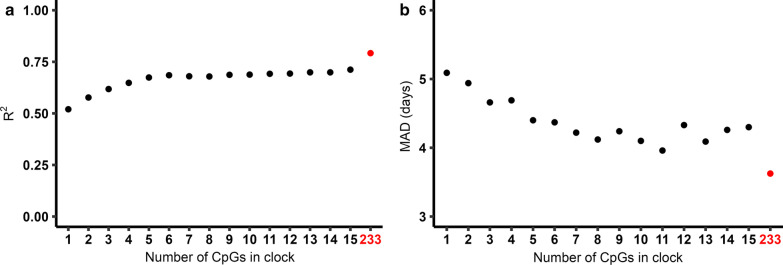
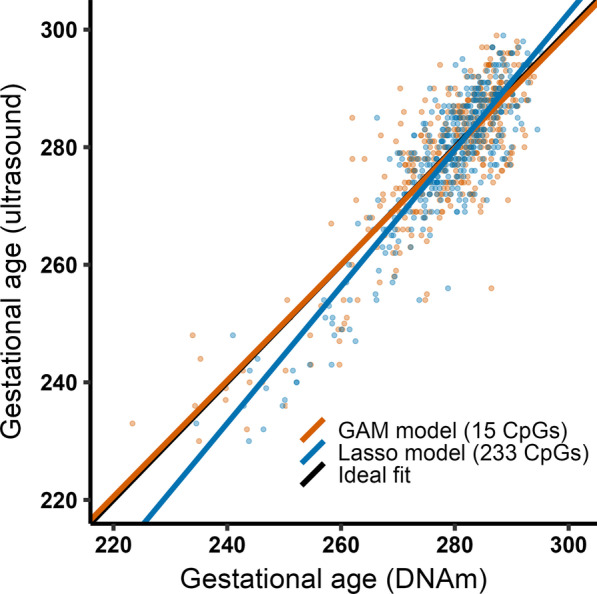
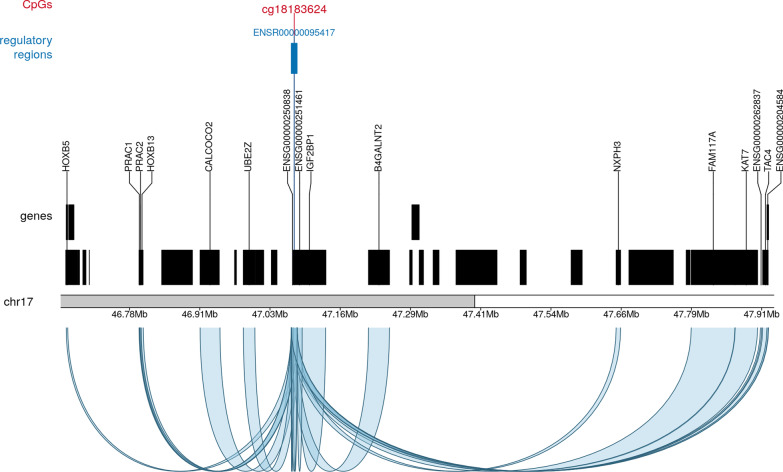
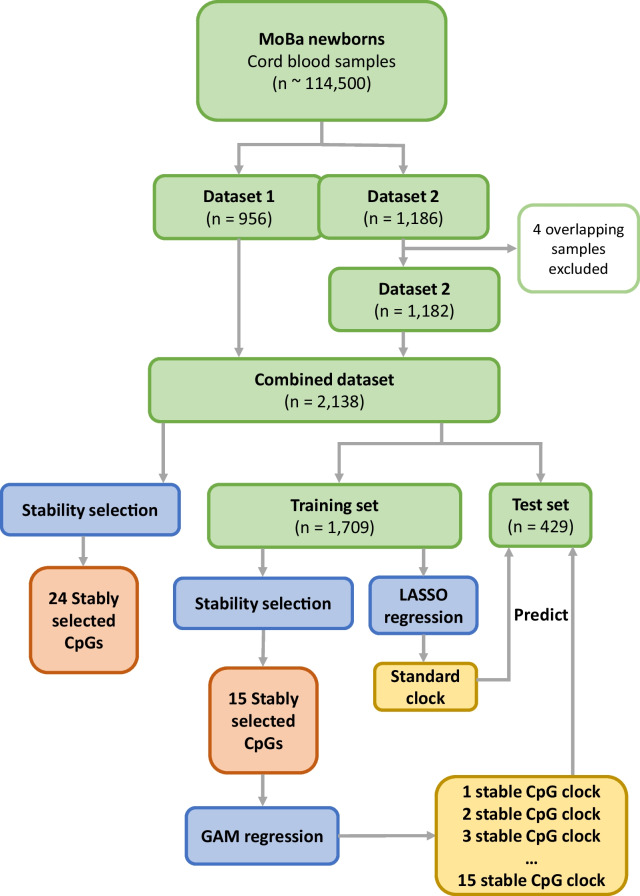
Results: We applied a statistical approach called 'stability selection' to DNAm data from 2138 newborns in the Norwegian Mother, Father, and Child Cohort study. Stability selection combines subsampling with variable selection to restrict the number of false discoveries in the set of selected variables. Twenty-four CpGs were identified as being stably predictive of GA. Intriguingly, only up to 10% of the CpGs in previous GA clocks were found to be stably selected. Based on these results, we used generalized additive model regression to develop a new GA clock consisting of only five CpGs, which showed a similar predictive performance as previous GA clocks (R2 = 0.674, median absolute deviation = 4.4 days). These CpGs were in or near genes and regulatory regions involved in immune responses, metabolism, and developmental processes. Furthermore, accounting for nonlinear associations improved prediction performance in preterm newborns.
Conclusion: We present a methodological framework for feature selection that is broadly applicable to any trait that can be predicted from DNAm data. We demonstrate its utility by identifying CpGs that are highly predictive of GA and present a new and highly performant GA clock based on only five CpGs that is more amenable to a clinical setting.
Keywords: Cord blood; DNA methylation; Epigenetic clock; Epigenetics; Feature selection; Gestational age; Illumina MethylationEPIC BeadChip; MBRN; MoBa; Stability selection.
© 2023. The Author(s).
Conflict of interest statement
The authors declare that they have no competing interests.
Figures


Similar articles
-
An EPIC predictor of gestational age and its application to newborns conceived by assisted reproductive technologies.Clin Epigenetics. 2021 Apr 19;13(1):82. doi: 10.1186/s13148-021-01055-z. Clin Epigenetics. 2021. PMID: 33875015 Free PMC article.
-
Blood-based epigenetic estimators of chronological age in human adults using DNA methylation data from the Illumina MethylationEPIC array.BMC Genomics. 2020 Oct 27;21(1):747. doi: 10.1186/s12864-020-07168-8. BMC Genomics. 2020. PMID: 33109080 Free PMC article.
-
Consistent cord blood DNA methylation signatures of gestational age between South Asian and white European cohorts.Clin Epigenetics. 2024 Jun 6;16(1):74. doi: 10.1186/s13148-024-01684-0. Clin Epigenetics. 2024. PMID: 38840168 Free PMC article.
-
DNA methylation markers of age(ing) in non-model animals.Mol Ecol. 2023 Sep;32(17):4725-4741. doi: 10.1111/mec.17065. Epub 2023 Jul 3. Mol Ecol. 2023. PMID: 37401200 Review.
-
DNA methylation-based age clocks: From age prediction to age reversion.Ageing Res Rev. 2021 Jul;68:101314. doi: 10.1016/j.arr.2021.101314. Epub 2021 Mar 5. Ageing Res Rev. 2021. PMID: 33684551 Review.
Cited by
-
Accuracy of prenatal and postnatal biomarkers for estimating gestational age: a systematic review and meta-analysis.EClinicalMedicine. 2024 Mar 8;70:102498. doi: 10.1016/j.eclinm.2024.102498. eCollection 2024 Apr. EClinicalMedicine. 2024. PMID: 38495518 Free PMC article.
-
Designing Epigenetic Clocks for Wildlife Research.Mol Ecol Resour. 2025 Oct;25(7):e14120. doi: 10.1111/1755-0998.14120. Epub 2025 May 6. Mol Ecol Resour. 2025. PMID: 40326643 Free PMC article. Review.
-
Epigenetic age acceleration, neonatal morbidities, and neurobehavioral profiles in infants born very preterm.Epigenetics. 2023 Dec;18(1):2280738. doi: 10.1080/15592294.2023.2280738. Epub 2023 Nov 20. Epigenetics. 2023. PMID: 37983304 Free PMC article.
-
A SuperLearner-based pipeline for the development of DNA methylation-derived predictors of phenotypic traits.PLoS Comput Biol. 2025 Feb 6;21(2):e1012768. doi: 10.1371/journal.pcbi.1012768. eCollection 2025 Feb. PLoS Comput Biol. 2025. PMID: 39913632 Free PMC article.
-
MinLinMo: a minimalist approach to variable selection and linear model prediction.BMC Bioinformatics. 2024 Dec 18;25(1):380. doi: 10.1186/s12859-024-06000-4. BMC Bioinformatics. 2024. PMID: 39695947 Free PMC article.
References
Publication types
MeSH terms
Grants and funding
LinkOut - more resources
Full Text Sources
