. 2023 Jul 13;14(1):4188.
doi: 10.1038/s41467-023-39946-9.

Genes associated with cognitive ability and HAR show overlapping expression patterns in human cortical neuron types

Affiliations

Genes associated with cognitive ability and HAR show overlapping expression patterns in human cortical neuron types

Stan L W Driessens et al. Nat Commun. .

Abstract

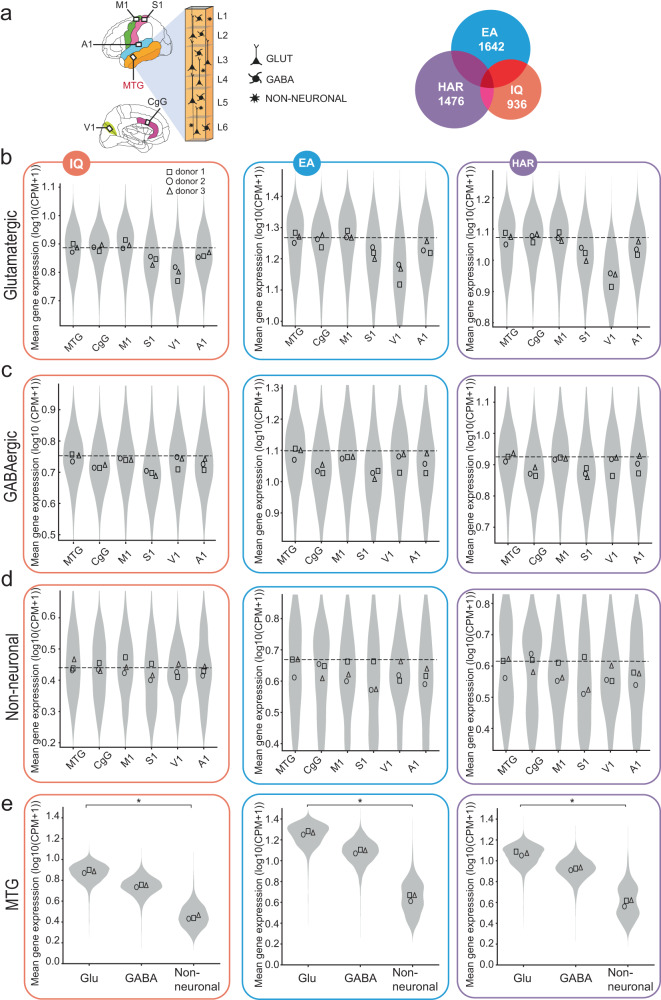
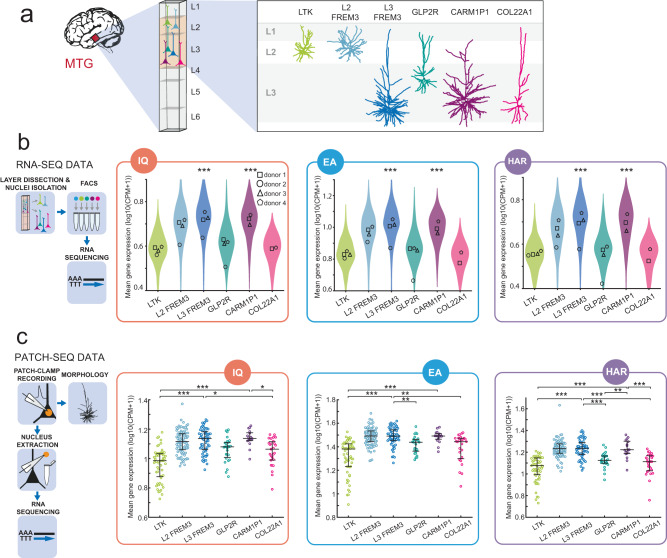
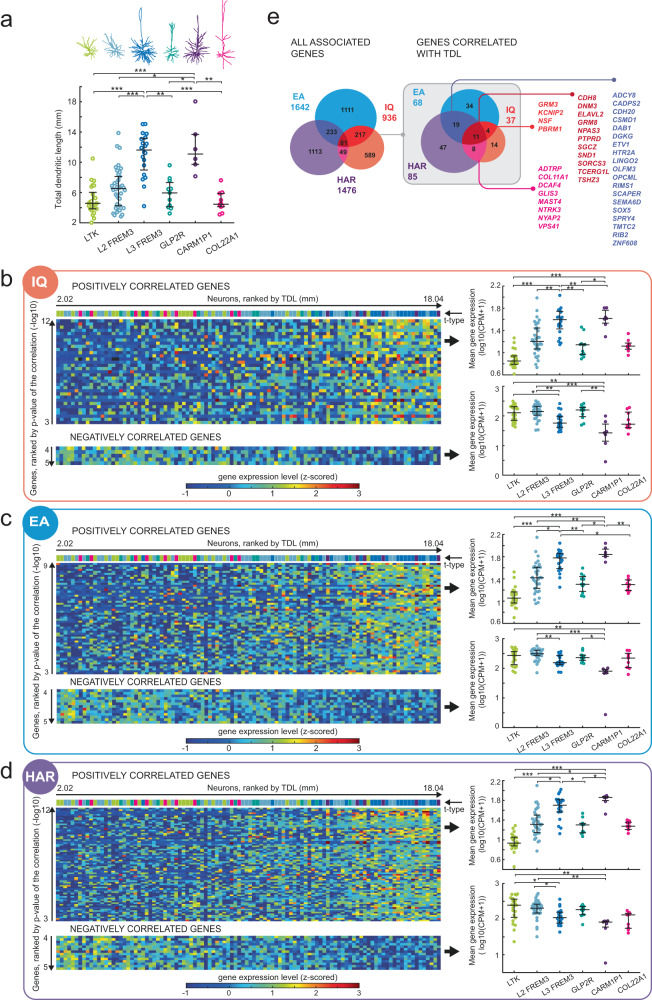
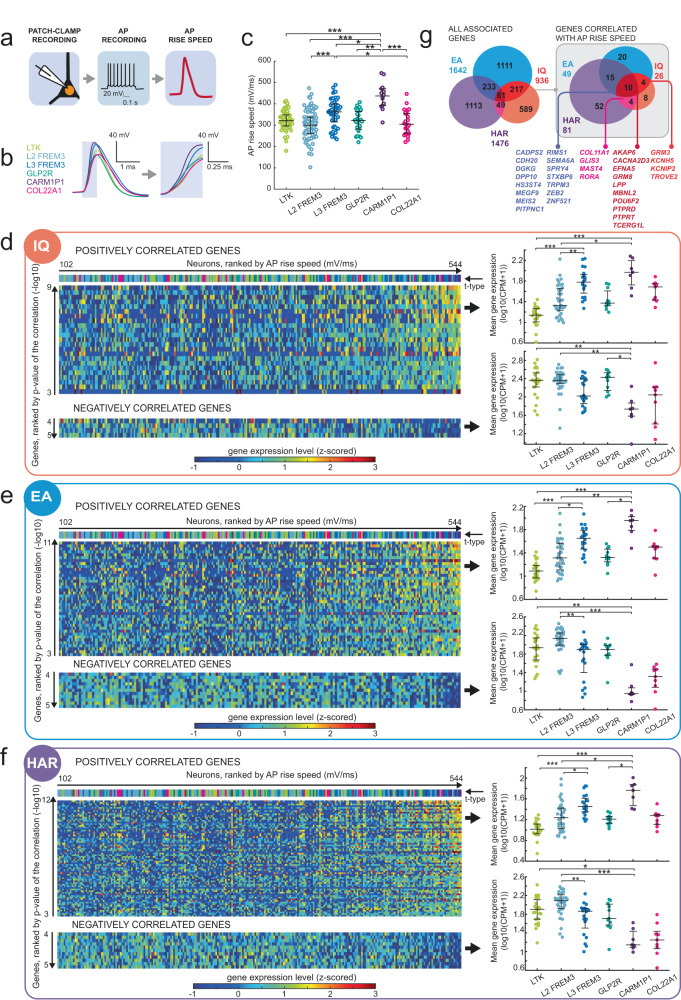
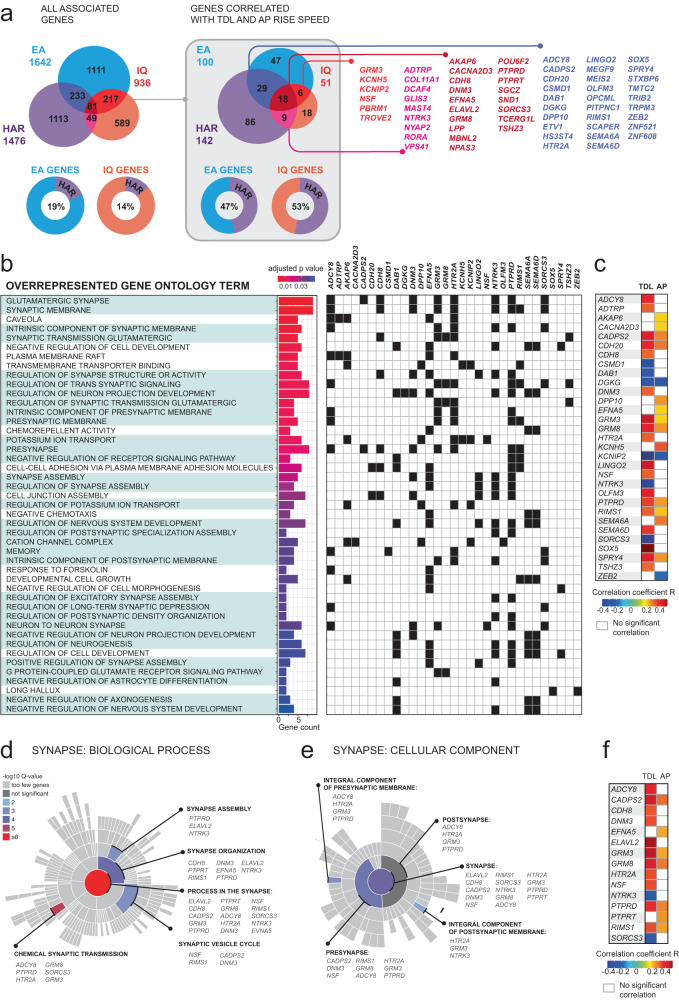
GWAS have identified numerous genes associated with human cognition but their cell type expression profiles in the human brain are unknown. These genes overlap with human accelerated regions (HARs) implicated in human brain evolution and might act on the same biological processes. Here, we investigated whether these gene sets are expressed in adult human cortical neurons, and how their expression relates to neuronal function and structure. We find that these gene sets are preferentially expressed in L3 pyramidal neurons in middle temporal gyrus (MTG). Furthermore, neurons with higher expression had larger total dendritic length (TDL) and faster action potential (AP) kinetics, properties previously linked to intelligence. We identify a subset of genes associated with TDL or AP kinetics with predominantly synaptic functions and high abundance of HARs.


Conflict of interest statement

The authors declare no competing interests.

Figures

Fig. 1
Fig. 1. Genes associated with IQ and EA and HAR are enriched in glutamatergic neuron types.
a Schematic representation of the human brain areas from which the Allen Brain snRNA-seq data were analyzed. Venn diagram shows the number of genes expressed in brain cell types for each gene set: genes associated with IQ, educational attainment (EA) and HAR. Within each gene set, single cell RNA-expression data were averaged across genes for each cell. b Expression profiles of IQ, EA, and HAR gene sets across brain areas in glutamatergic cells across cortical areas. Here and further: IQ, EA and HAR gene set data are displayed in orange, blue and purple frames, respectively. Violins show the distribution of cellular data of all donors, where each data point is the mean gene expression for each gene set per cell (N = 502-10324 cells, K-W test p values are all significant; see Source Data for N for each cell class and area and K-W test p values for each gene set). Symbols within violins show the median gene expression per human donor (two-sided Friedman test glutamatergic types: N = 3 donors; IQ: F = 13.48, p = 0.0009; EA: F = 13.1, p = 0.0018; HAR: F = 13.1, p = 0.0018). Dashed line marks the median gene expression in MTG. c The expression levels in GABAergic and d non-neuronal cells across brain areas (two-sided Friedman test GABA: IQ: F = 10.81, p = 0.0247, EA: F = 8.905, p = 0.0905, HAR: F = 7.381, p = 0.2014; Non-neuronal: IQ: F = 4.524, p = 0.534, EA: F = 4.714, p = 0.5108, HAR: F = 6.619, p = 0.2755). e Expression of IQ, EA, and HAR genes in cell classes within MTG (two-sided Friedman test: N = 3 donors; IQ: F = 6, p = 0.0278; EA: F = 6, p = 0.0278; HAR: F = 6, p = 0.0278). Asterisks indicate the result of a two-sided Friedman test of donor data here and further: *p < 0.05; **p < 0.01; ***p < 0.001. Complete N and statistical results are provided as a Source Data file.
Fig. 2
Fig. 2. Genes associated with IQ and EA and HAR are enriched in L3 FREM3 and CARM1P1 t-types.
a Examples of reconstructed dendritic morphologies of excitatory L2/L3 human t-types from MTG area. b Schematic represents the workflow of RNA-seq data collection. Expression of IQ, EA and HAR gene sets across MTG L2/L3 glutamatergic neuron types. Violins show the distribution of snRNA-seq data for all donors, where each data point is the mean gene expression of each gene set per cell (N (neurons): LTK = 666; L2 FREM3 = 605; L3 FREM3 = 1336; GLP2R = 148; CARM1P1 = 172; COL22A1 = 41; Kruskal–Wallis (KW) test; IQ gene set: P = 1.18 × 10−16; EA gene set: P = 4.6 × 10−18; HAR gene set: P = 2.06 × 10−26. Symbols within violins show the median gene expression per human donor (N = 3; two-sided Friedman test of donor data: IQ gene set: F = 9.714, p = 0.0083; EA gene set: F = 10, p = 0.0014; HAR gene set: F = 9,429, p = 0.0167). Asterisks above t-types indicate that this t-type was significantly different in K-W test post-hoc comparisons to LTK, GLP2R, and COL22A1 t-types and represent the least significant difference. c Schematic represents the collection workflow of Patch-seq data. Plots show mean gene expression levels of IQ, EA and HAR gene sets in glutamatergic t-types collected by Patch-seq. For Patch-seq here and further: data points represent data of individual neurons; color code for the t-types is the same across all figures; black horizontal lines are the median values and vertical lines show the interquartile range (IQR). N (neurons) for each group: LTK = 57; L2 FREM3 = 90; L3 FREM3 = 58; GLP2R = 27; CARM1P1 = 17; COL22A1 = 27. K-W test; IQ gene set: P = 1.2 × 10−16; EA gene set: P = 4.7 × 10−18; HAR gene set: P = 2.1 × 10−26. Asterisks indicate the significance of K-W test post-hoc comparisons for only CARM1P1 and L3 FREM3 types. Plots indicate median (middle line) and 25th and 75th percentiles (whiskers). Complete N and statistical results are provided as a Source Data file.
Fig. 3
Fig. 3. Differential expression of genes associated with IQ and EA and HAR is related to dendrite size.
a Top: examples of reconstructed dendritic morphologies for each neuron t-type. Bottom: Total Dendrite Length (TDL) of neuron t-types. K-W test; p = 5.6 × 10−9; N (neurons): LTK = 25; L2 FREM3 = 38; L3 FREM3 = 20; GLP2R = 11; CARM1P1 = 6; COL22A1 = 10. Plots in ad indicate median (middle line) and 25th and 75th percentiles (whiskers). bd Heatmaps show the expression levels (z-scored log10(CPM + 1)) in color code for each neuron (columns) and each gene (rows) per gene set (B: IQ, C: EA, D: HAR). Neurons are displayed in columns ranked from the smallest (left) to the largest (right) TDL, genes are displayed in rows ranked by the significance of their correlation with TDL (unadjusted p values). Only significantly correlated genes after 5% FDR correction are shown. The t-types are indicated by color-coded bars above the heatmaps, same color code as in a. Expression of positively correlating genes is shown in top heatmap, expression of negatively correlating genes is shown in bottom heatmap. Mean expression of these genes averaged per neuron t-type is shown in the plots in the right panel. Top: K-W tests for positively correlating genes: IQ p = 1.5 × 10−11; EA p = 7.6 × 10−12; HAR p = 3 × 10−12. Asterisks represent p values of post-hoc comparisons for only CARM1P1 and L3 FREM3 types. Bottom: K-W test for negatively correlating genes: IQ p = 1.1 × 10−5; EA p = 9.7 × 10−6; HAR p = 3 × 10−5. N (neurons) are the same as in a. e Overview of the subset of genes that correlated positively or negatively with TDL in the different gene sets. The Venn diagrams represent IQ, EA and HAR gene sets and the number of overlapping genes between gene sets for all associated genes (left) and the subset of genes that were significantly correlated with TDL (right, highlighted in gray). The colored numbers outside the Venn diagrams are the total number of genes in each gene set. Individual gene names of genes overlapping between gene sets are listed to the right. N and statistical results are provided as a Source Data file.
Fig. 4
Fig. 4. Differential expression of HAR and genes associated with IQ and EA is related to AP rise kinetics.
a Schematic representing the AP recording workflow. b Example AP traces of L2/L3 neuron t-types. The highlighted part of the trace represents the rising phase of AP and is shown at higher temporal resolution (right). c Mean AP rise speeds for each neuron t-type are shown for the first AP in the recorded trace. K-W test; p = 2 × 10−9; N (neurons) for each group: LTK = 43; L2 FREM3 = 54; L3 FREM3 = 26; GLP2R = 21; CARM1P1 = 12; COL22A1 = 26. df Heatmaps show the mRNA expression levels (z-scored log10(CPM + 1)) in color code for each neuron (columns) and each gene (rows) for the IQ, EA, and HAR gene sets. Neurons are displayed in columns ranked from the slowest (left) to the fastest (right) AP rise speed, genes are displayed in rows ranked by the significance of their correlation with AP rise speed (unadjusted p values). Only significantly correlating genes after 5% FDR correction are shown. The t-types are indicated by color-coded bars above the heatmaps, same color code as in b, c. Top heatmaps: positively correlating genes. Bottom heatmaps; negatively correlating genes. Right plots: Mean expression of these genes averaged per neuron type. Positively correlating genes: K-W tests: IQ p = 2.4 × 10−10; EA p = 1.3 × 10−9; HAR p = 4.8 × 10−9. Asterisks represent p values of post-hoc comparisons: *p < 0.05; **p < 0.01; ***p < 0.001. Negatively correlating genes: K-W test: IQ p = 1.3 × 10−4; EA p = 6.5 × 10−9; HAR p = 2.7 × 10−8. N (neurons) are the same as in c. Plots in ad indicate median (middle line) and 25th and 75th percentiles (whiskers). g Expression levels of a subset of genes correlated significantly with AP rise speed. The Venn diagrams represent IQ, EA and HAR gene sets and the number of overlapping genes between gene sets for all associated genes (left) and the subset of genes that were significantly correlated with AP rise speed (right, highlighted in gray). The colored numbers outside the Venn diagrams are the total number of genes in each gene set. Complete N and statistical results are provided as a Source Data file.
Fig. 5
Fig. 5. TDL- and AP-correlated genes are involved in synaptic processes.
a IQ, EA and HAR gene sets and the number of overlapping genes between them are shown for the full sets (left) and for the genes that were significantly correlated with TDL or AP rise speed (right). Lower panels: The percentage of overlapping genes between IQ and HAR and EA and HAR gene sets; one-sided Fisher test, IQ genes: p = 2.8 × 10−10; EA genes: p = 1.1 × 10−9. b Over-represented gene ontology (GO) terms in which a selection of genes from the gene set of interest are significantly enriched at 5% FDR. GO terms related to synaptic function and structure are highlighted in green. The bar plot shows the number of genes annotated against each GO term and the significance of overrepresentation in color code (p value adjusted for 5% FDR, one-sided Fisher exact test). The gene names of over-represented genes are shown in the table (right) and marked black if they are overrepresented in each GO term. c Over-represented genes from b are listed and the correlation coefficients of their expression levels with TDL and/or AP rise speed are shown in color code. d Over-representation analysis for only synaptic GO terms compared to a background set of brain expressed genes. The over-represented Biological Processes in d and Cellular Components in e are visualized as “sunburst plots.” The top-level GO terms “process in the synapse,” and “synapse” respectively, are represented by a circle in the center of the sunburst, terms on the second and subsequent hierarchical levels are shown from the center outwards. Each over-represented term is color-coded: the color code shows the q value (p value of one-sided Fisher test adjusted for 1% FDR), the overrepresented genes are listed for each term. f Over-represented genes from d, e are listed and the correlation coefficients of their expression levels with TDL and/or AP rise speed are shown in color code. Source data are provided as a Source Data file.

References

    1. Herculano-Houzel S. The remarkable, yet not extraordinary, human brain as a scaled-up primate brain and its associated cost. Proc. Natl Acad. Sci. USA. 2012;109:10661–10668. doi: 10.1073/pnas.1201895109. - DOI - PMC - PubMed
    1. DeFelipe J, Alonso-Nanclares L, Arellano JI. Microstructure of the neocortex: comparative aspects. J. Neurocytol. 2002;31:299–316. doi: 10.1023/A:1024130211265. - DOI - PubMed
    1. Jansen PR, et al. Genome-wide meta-analysis of brain volume identifies genomic loci and genes shared with intelligence. Nat. Commun. 2020;11:5606. doi: 10.1038/s41467-020-19378-5. - DOI - PMC - PubMed
    1. Hulshoff Pol HE, et al. Genetic contributions to human brain morphology and intelligence. J. Neurosci. 2006;26:10235–10242. doi: 10.1523/JNEUROSCI.1312-06.2006. - DOI - PMC - PubMed
    1. Savage JE, et al. Genome-wide association meta-analysis in 269,867 individuals identifies new genetic and functional links to intelligence. Nat. Genet. 2018;50:912–919. doi: 10.1038/s41588-018-0152-6. - DOI - PMC - PubMed

Publication types