. 2023 Jul 14;8(1):271.
doi: 10.1038/s41392-023-01478-5.

BICC1 drives pancreatic cancer progression by inducing VEGF-independent angiogenesis

Affiliations

BICC1 drives pancreatic cancer progression by inducing VEGF-independent angiogenesis

Chongbiao Huang et al. Signal Transduct Target Ther. .

Erratum in

Abstract

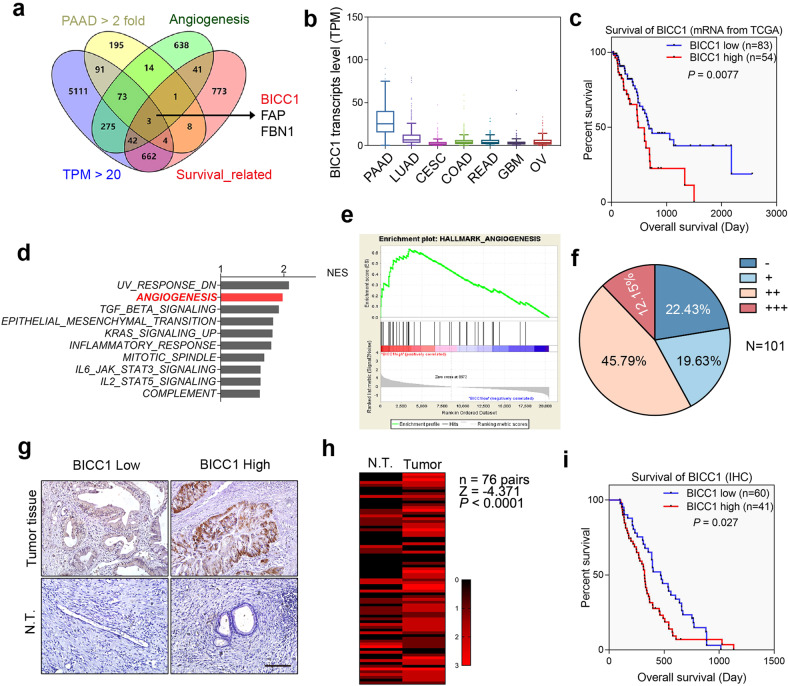
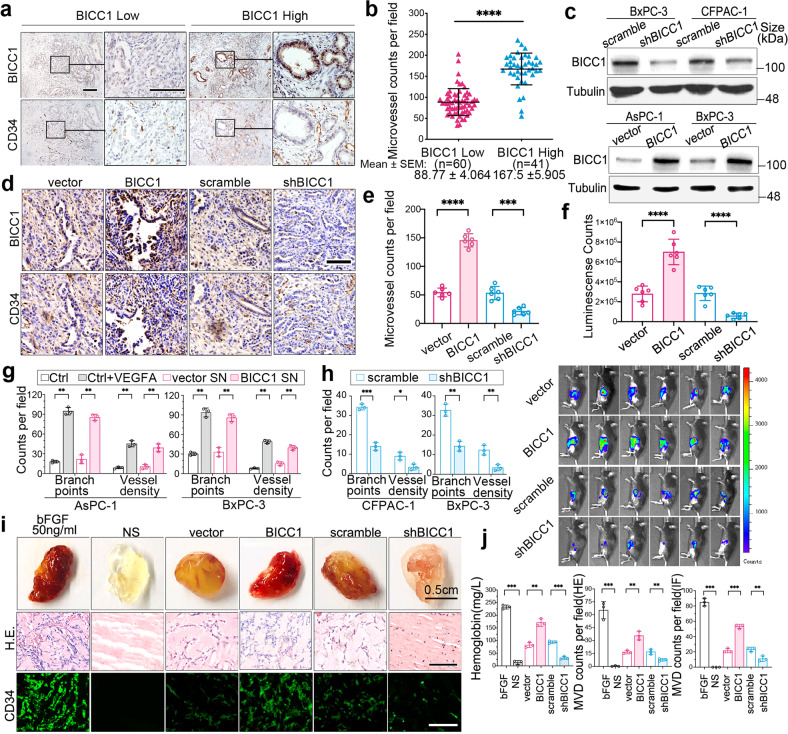
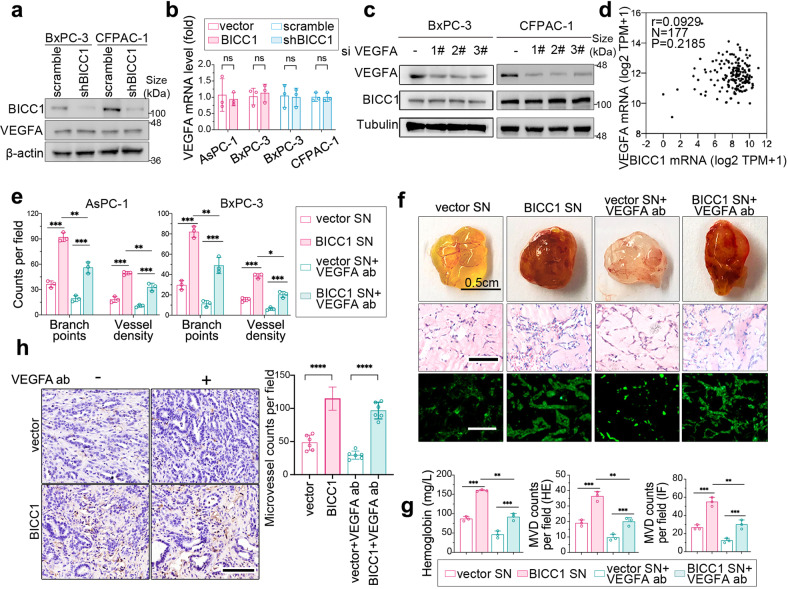
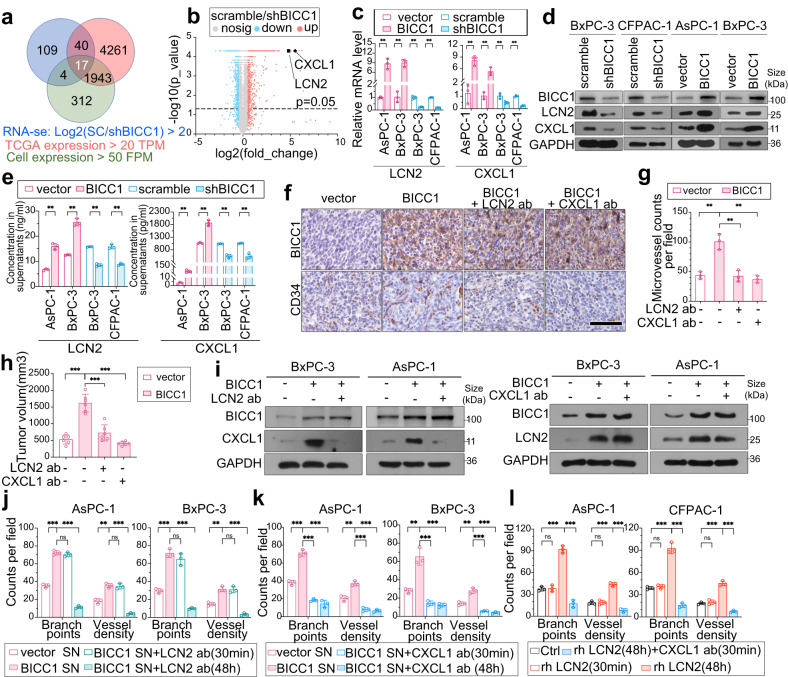
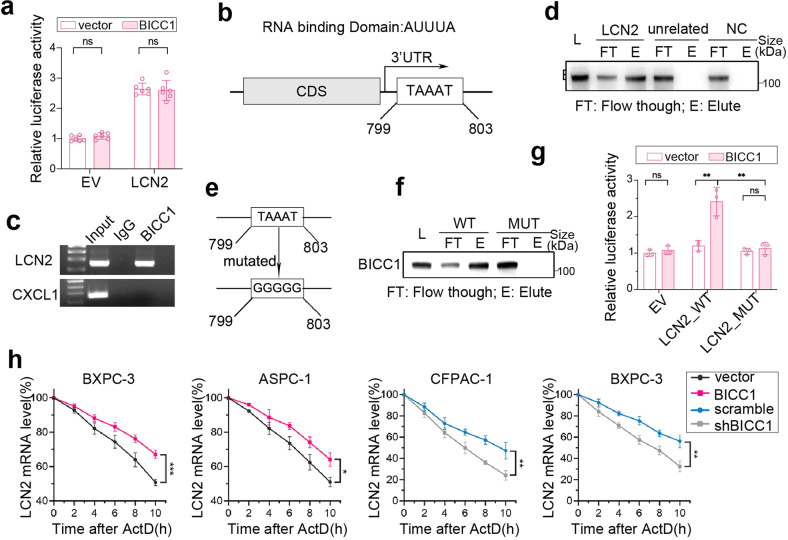
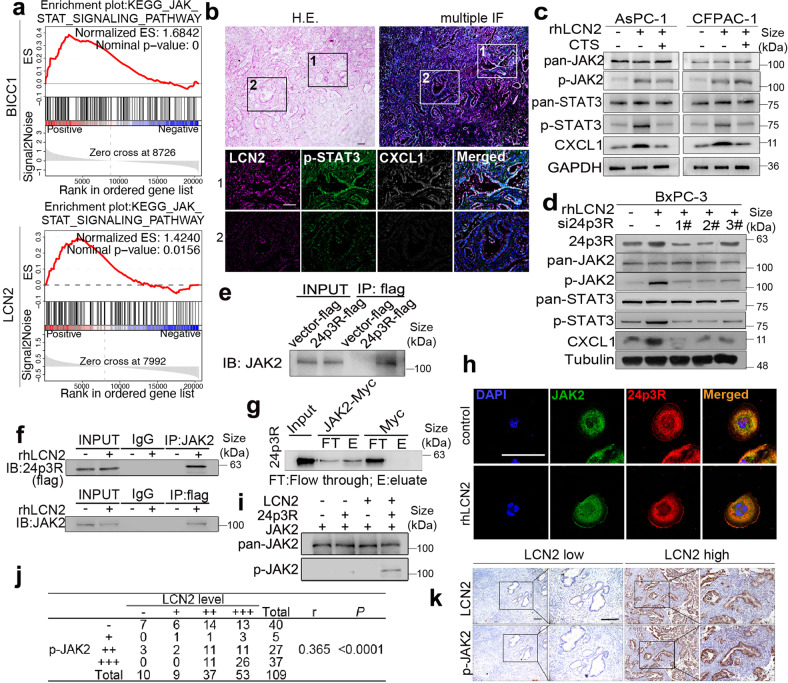
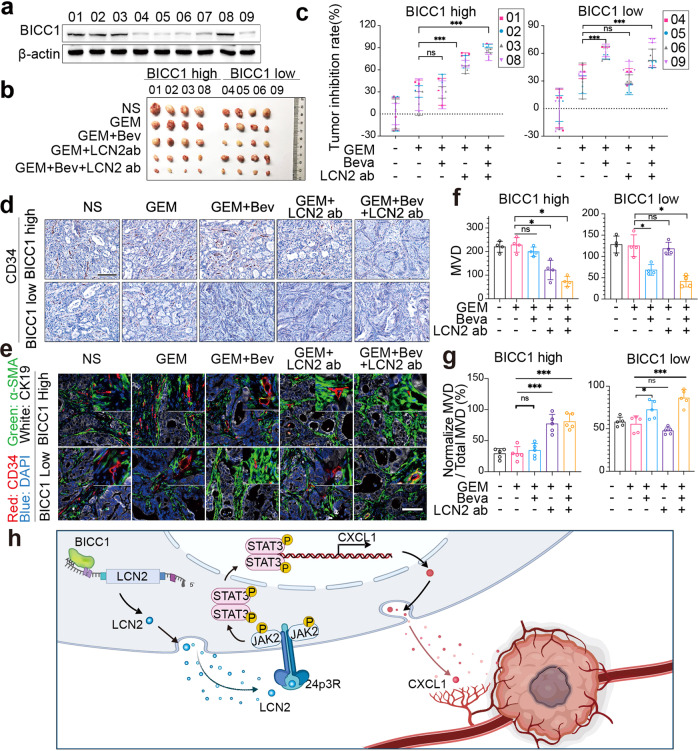
VEGF inhibitors are one of the most successful antiangiogenic drugs in the treatment of many solid tumors. Nevertheless, pancreatic adenocarcinoma (PAAD) cells can reinstate tumor angiogenesis via activation of VEGF-independent pathways, thereby conferring resistance to VEGF inhibitors. Bioinformatic analysis showed that BICC1 was one of the top genes involved in the specific angiogenesis process of PAAD. The analysis of our own cohort confirmed that BICC1 was overexpressed in human PAAD tissues and was correlated to increased microvessel density and tumor growth, and worse prognosis. In cells and mice with xenograft tumors, BICC1 facilitated angiogenesis in pancreatic cancer in a VEGF-independent manner. Mechanistically, as an RNA binding protein, BICC1 bounds to the 3'UTR of Lipocalin-2 (LCN2) mRNA and post-transcriptionally up-regulated LCN2 expression in PAAD cells. When its level is elevated, LCN2 binds to its receptor 24p3R, which directly phosphorylates JAK2 and activates JAK2/STAT3 signal, leading to increased production of an angiogenic factor CXCL1. Blocking of the BICC1/LCN2 signalling reduced the microvessel density and tumor volume of PAAD cell grafts in mice, and increased the tumor suppressive effect of gemcitabine. In conclusion, BICC1 plays a pivotal role in the process of VEGF-independent angiogenesis in pancreatic cancer, leading to resistance to VEGF inhibitors. BICC1/LCN2 signaling may serve as a promising anti-angiogenic therapeutic target for pancreatic cancer patients.


Conflict of interest statement

The authors declare no competing interests.

Figures

Fig. 1
Fig. 1
BICC1 is a candidate gene that mediates tumor angiogenesis in PAAD. a The RNA sequencing data of PAAD, LUAD, CESC, COAD, READ, GBM, and OV in TCGA were analyzed. The Venn diagram illustrates the strategy for the screening of the candidate genes involved in the unique pro-angiogenic process of PAAD. b The transcripts levels of BICC1 in PAAD, LUAD, CESC, COAD, READ, GBM, and OV. c Patients with PAAD in the TCGA database were stratified into BICC1 low (≤430 FPKM) and BICC1 high (>430 FPKM) groups and their overall survival was compared between the two groups using Kaplan–Meier analysis. p-value is from the log-rank test. d A list of the top 10 gene sets enriched in patients with BICC1 high expression in the GSEA analysis. e The enrichment plot of the Hallmark_angiogenesis gene set in the GSEA analysis. f–i Sections of PAAD tissues were analyzed for the expression levels of BICC1 in tumor tissues and the corresponding adjacent nontumor (NT) tissues. f The distribution of BICC1 IHC scores among 101 PAAD tissues. g Representative images for low (− and +) and high (++ and +++) BICC1 staining in PAAD tissues. h The differential expression of BICC1 in 76 pairs of tumor tissues and the corresponding adjacent non-tumor (NT) tissues is shown in a heatmap. p-value is from Wilcoxon signed rank tests. i Kaplan–Meier analysis of the overall survival of PAAD patients with high or low BICC1 levels. p-value is from the log-rank test. scale bars, 100 μm
Fig. 2
Fig. 2
BICC1 promotes tumor angiogenesis in PAAD. a Representative images of immunohistochemistry (IHC) staining for BICC1 and CD34 in human PAAD tissues. b Quantification of MVD in BICC1 high and low groups based on IHC results in (a). c The indicated PAAD cells were transduced with lentiviruses to overexpress or knock down BICC1. Western blotting was performed to verify the BICC1 expression in these cell lines. d–f KPC cells were orthotopically transplanted to the pancreas of C57BL/6 mice to develop tumors. IHC staining for CD34 was performed to determine the MVD in tumor tissues. Representative images of IHC staining for BICC1 and CD34 (d), MVD (e), and tumor volume measured by Bioluminescence imaging f of the indicated group are shown. g and h Supernatants from indicated cells were used as the CM in the tube formation assays. The tube density and the branch points per field are presented; recombinant VEGFA (50 ng/mL) was used as a positive control. i and j Matrigel plug supplemented with CM or mouse basic fibroblast growth factor (50 ng/ml) were subcutaneously injected into the middle line of the back in C57BL/6 mice. Representative images of HE-stained and CD34 immunofluorescence-stained sections are shown (i). Hemoglobin content and MVD in each group were analyzed (j). Data are presented as mean ± SD; *p < 0.05, **p < 0.01,***p < 0.001 in unpaired t-test; scale bars, 100 μm
Fig. 3
Fig. 3
BICC1 facilitates tumor angiogenesis in a VEGF-independent manner. a and b Western blotting (a) and RT-PCR assays (b) were performed to verify the regulatory effects of BICC1 on VEGFA in the indicated cell lines. c, BXPC-3 cells and CFPAC-1 cells were transiently transfected with interference short RNAs targeting VEGFA for 48 h and subjected to Western blotting assays. d Pearson’s correlation analysis of the mRNA levels of BICC1 and VEGFA in 177 PAAD patients from the TCGA database. e Supernatants from indicated cells supplemented with or without an anti-VEGFA neutralizing antibody (100 ng/mL) were used as CM in the tube formation assays. The tube density and the branch points per field were quantified. f and g Matrigel plugs incubated with CM supplemented with IgG or the anti-VEGFA neutralizing antibody were subcutaneously injected into the middle line of the back in C57/BL6 mice. Representative images of Matrigel plugs, and those stained with HE or immunofluorescence stained for CD34 are shown (f). The hemoglobin concentration and MVD of the Matrigel plugs were calculated (g). h KPC cells were orthotopically transplanted to the pancreas of C57BL/6 mice to develop tumors. Mice were treated with the anti-VEGFA antibody (25 mg/kg, twice a week). Representative images of tumor sections stained with IHC or immunofluorescence stained for BICC1 and CD34, and quantifications of MVD in each group are shown. Data are presented as mean ± SD; **p < 0.01, ***p < 0.001, *p < 0.05 in unpaired t-test; scale bars, 100 μm
Fig. 4
Fig. 4
LCN2 and CXCL1 are indispensable for BICC1-induced tumor angiogenesis. a and b Genome-wide mRNA sequencing was performed to compare the expression profiles between CFPAC-1 cells with or without BICC1 knockdown. The Venn diagram illustrates the screening strategy (a). The genes significantly altered by BICC1 knockdown (|log2FC > 2|) are presented in a volcano plot (b). c–e The indicated cells were subjected to Western blotting (c), RT-PCR assays (d), and ELISA (e) to verify the regulatory effects of BICC1 on LCN2 and CXCL1. f–h Pan02 cells with or without BICC1 overexpression were orthotopically transplanted to the pancreas of C57BL/6 mice to develop tumors. Representative images of IHC staining for CD34 and BICC1 (f), and quantifications of MVD (g), and tumor volume (h) are shown. i Indicated cells were treated with or without an anti-LCN2 (2 μg/mL) or anti-CXCL1 (5 μg /mL) neutralizing antibody for 48 h and subjected to Western blotting. j–l Indicated cells were treated with or without an anti-LCN2 (2 μg/mL) or anti-CXCL1 (5 μg/mL) neutralizing antibody for 30 min or 48 h, supernatants from indicated cells were used as the CM in the tube formation assays. i AsPC-1 and CFPAC-1 were treaded with recombinant LCN2 protein (100 ng/mL) and anti-CXCL1 (5 μg/mL) neutralizing antibody for the indicated time and then used as CM in the tube formation assays. The tube density and the branch points per field were quantified. Shown are mean ± SD; *p < 0.05, **p < 0.01, ***p < 0.001 in unpaired t-test. Scale bars, 100 μm
Fig. 5
Fig. 5
BICC1 increases the stability of LCN2 mRNA. a HEK293T cells were transduced with either vector control or pLV-BICC1 in conjunction with the luciferase reporter pGL3-empty vector, pGL3-LCN2-promoter. Results are expressed as fold induction relative to that of corresponding cells transfected with the control vector after normalization of firefly luciferase activity to Renilla luciferase activity. b The 3’UTR sequence of human LCN2, containing one identified BICC1-binding motif. c RNA binding protein immunoprecipitation assay. RNAs were immunoprecipitated from BxPC-3 cells with an anti-BICC1 antibody and analyzed by qRT-PCR. d RNA pull-down assay. BxPC-3 cell lysates were incubated with magnetic beads bound to LCN2 3´-UTR RNA. The captured proteins were determined by Western blotting assay (L, lysate load; FT, flow-through; E, eluate). e A schematic diagram showing mutation of the BICC1-binding motif in LCN2 3’UTR from “TAAAT” to “GGGGG”. f RNA pull-down analysis of BXPC-3 cells. The lysates were incubated with wild-type or mutant LCN2 3´-UTR RNAs. g Luciferase analysis of 293T cells. 293T cells transfected with pLV-BICC1 or control vector (pLV-vector) were co-transfected with MT06-LCN2-3’UTR containing wild type (WT) or mutant (MUT) BICC1-binding site or MT06-empty vectors (MT06-Control). Forty-eight hours later, cells were subjected to dual luciferase analysis. h The indicated cells were treated with Actinomycin D for the indicated time periods and then the mRNA levels of LCN2 were detected by qRT-PCR assays, and analyzed by repeated measures analysis of variance (ANOVA). Data are shown as mean ± SD; N.S. not significant, **p < 0.01 in unpaired t-test
Fig. 6
Fig. 6
LCN2 promotes CXCL1 expression by activating the JAK-STAT3 signal pathway. a The mRNA sequencing profiles of PAAD patients in the TCGA database were analyzed. Gene set enrichment analysis was performed according to BICC1 and LCN2 levels. Shown are the enriched JAK-STAT3 signal pathway. b Mul-color immunofluorescence staining for LCN2, CXCL1, p-STAT3, and DAPI were performed in sections of human PAAD tissues. Representative images were shown. c Western bloting was performed in indicated cells treated with or without recombinant LCN2 (rhLCN2, 100 ng/mL) and CTS (Cryptotanshinone, a p-STAT3 (Tyr705) inhibitor) for 30 min and 24 h, for the detection of phosphorylated (-p) JAK2/STAT3 and CXCL1, respectively. d The indicated cells were transfected with small interfering RNAs targeting the receptor of LCN2 (LCN2R, also known as 24p3R) for 48 h, treated with or without rhLCN2 and subjected to Western blotting assays. f and g The whole cell lysate (e) and membrane fractions (f) of the indicated cells were subjected to co-immunoprecipitation and Western blotting to analyze the binding of JAK2 and 24p3R. g Myc-tagged JAK2 was expressed, purified, and then linked to magnetic beads via the Myc tag. The beads were incubated with purified recombinant 24p3R protein. The levels of 24p3R in the flow through and bound to the beads were detected by Western blotting. h PAAD cells were treated with or without rhLCN2 (100 ng/mL, 1 h), and subjected to immunofluorescence staining to detect the subcellular localization of JAK2 and 24p3R. i Recombinant LCN2 protein (40 μg/mL), 23p3R protein (40 μg/mL), and JAK2 protein (200 μg/mL) were incubated for 30 min in kinase reaction buffer. The phosphorylated (-p) JAK2 level in the reaction was analyzed by Western blotting. j and k Representative IHC staining images of consecutive sections of PAAD tissues with high and low levels for LCN2 and p-JAK2. The correlation between LCN2 and p-JAK2 IHC scores was analyzed by Spearman’s correlation test in 109 human PAAD tissues. Scale bars, 100 μm
Fig. 7
Fig. 7
An anti-LCN2 neutralizing antibody showed promising anti-tumor efficacy in mice. a EpCAM+ tumor cells from the nine PDX tissues were sorted by flow cytometry, cell lysates were isolated, and then subjected to Western blotting to detect BICC1 expression. b-c, Nod-SCID mice were subcutaneously transplanted with indicated PDX tissues and treated intravenously with 15 mg/kg of gemcitabine (GEM) alone, or together with 10 mg/kg of Bevacizumab (Bev) or 25 mg/kg of anti-LCN2 neutralizing antibody (anti-LCN2), or both every 3 days starting on day 7 after transplantation. PDX tumors were collected and imaged at the endpoints (b). Tumor inhibition rate of each treatment was analyzed by normalizing the tumor volumes to the vehicle group of the same PDX (c). d and e Immunohistochemical staining of CD34 (d) and mul-color immunofluorescence staining of CD34, α-SMA (a marker of pericytes), Cytokeratin 19 (CK19, a maker of pancreatic duct tumor cells) and DAPI (e) in PDX tumor tissues. f and g Quantification of microvessel density (f) and the percentage of normalized blood vessels (g) in each group. h A schematic diagram illustrating BICC1-mediated VEGF-independent tumor angiogenesis in PAAD, created in BioRender.com. Shown are mean ± SD; *p < 0.05 in unpaired t-test. Scale bars, 100 μm

Similar articles

Cited by

References

    1. Leung DW, et al. Vascular endothelial growth factor is a secreted angiogenic mitogen. Science. 1989;246:1306–1309. - PubMed
    1. Carpino G, et al. Thrombospondin 1 and 2 along with PEDF inhibit angiogenesis and promote lymphangiogenesis in intrahepatic cholangiocarcinoma. J. Hepatol. 2021;75:1377–1386. - PubMed
    1. Rivera LB, Bergers G. Intertwined regulation of angiogenesis and immunity by myeloid cells. Trends Immunol. 2015;36:240–249. - PMC - PubMed
    1. Folkman J. Tumor angiogenesis: therapeutic implications. N. Engl. J. Med. 1971;285:1182–1186. - PubMed
    1. Bergers G, Benjamin LE. Tumorigenesis and the angiogenic switch. Nat. Rev. Cancer. 2003;3:401–410. - PubMed

Substances