. 2023 Jul 13;22(1):110.
doi: 10.1186/s12943-023-01815-w.

BID expression determines the apoptotic fate of cancer cells after abrogation of the spindle assembly checkpoint by AURKB or TTK inhibitors

Affiliations

BID expression determines the apoptotic fate of cancer cells after abrogation of the spindle assembly checkpoint by AURKB or TTK inhibitors

Jordi Bertran-Alamillo et al. Mol Cancer. .

Abstract

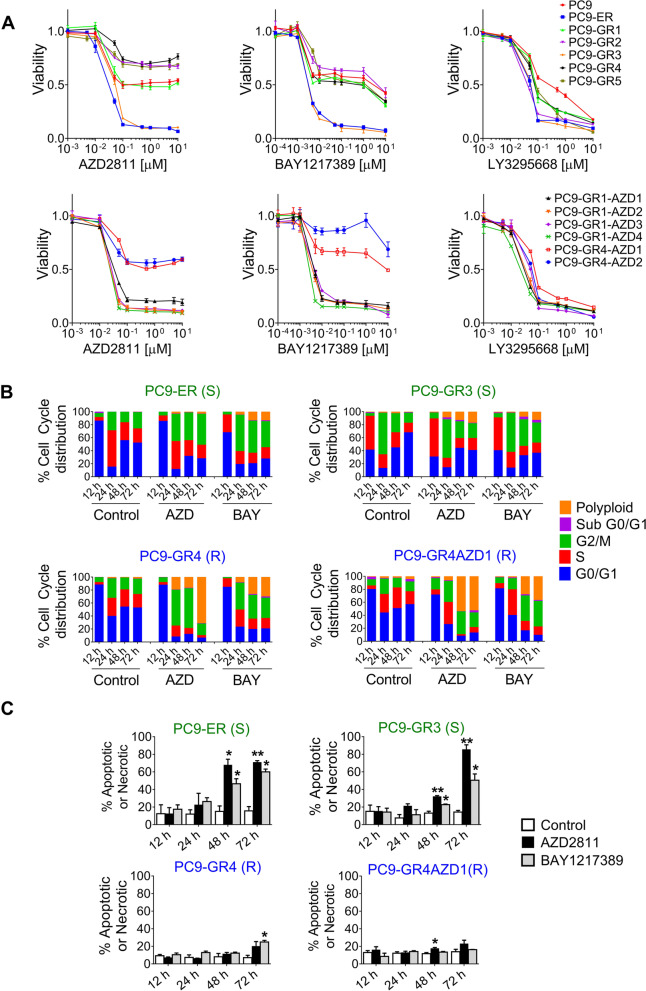
Background: Drugs targeting the spindle assembly checkpoint (SAC), such as inhibitors of Aurora kinase B (AURKB) and dual specific protein kinase TTK, are in different stages of clinical development. However, cell response to SAC abrogation is poorly understood and there are no markers for patient selection.

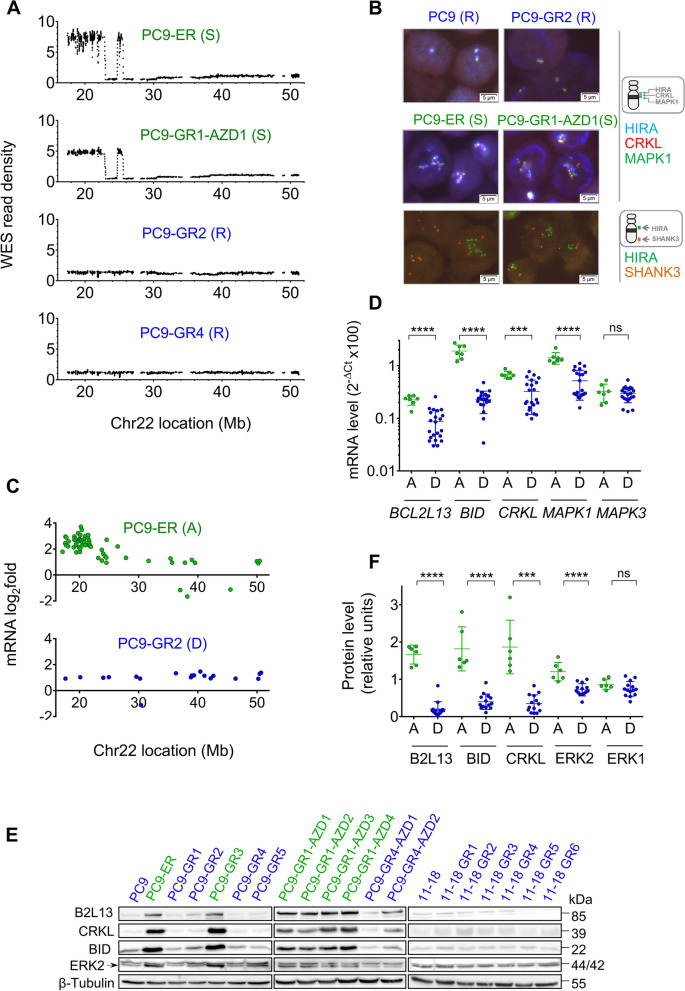
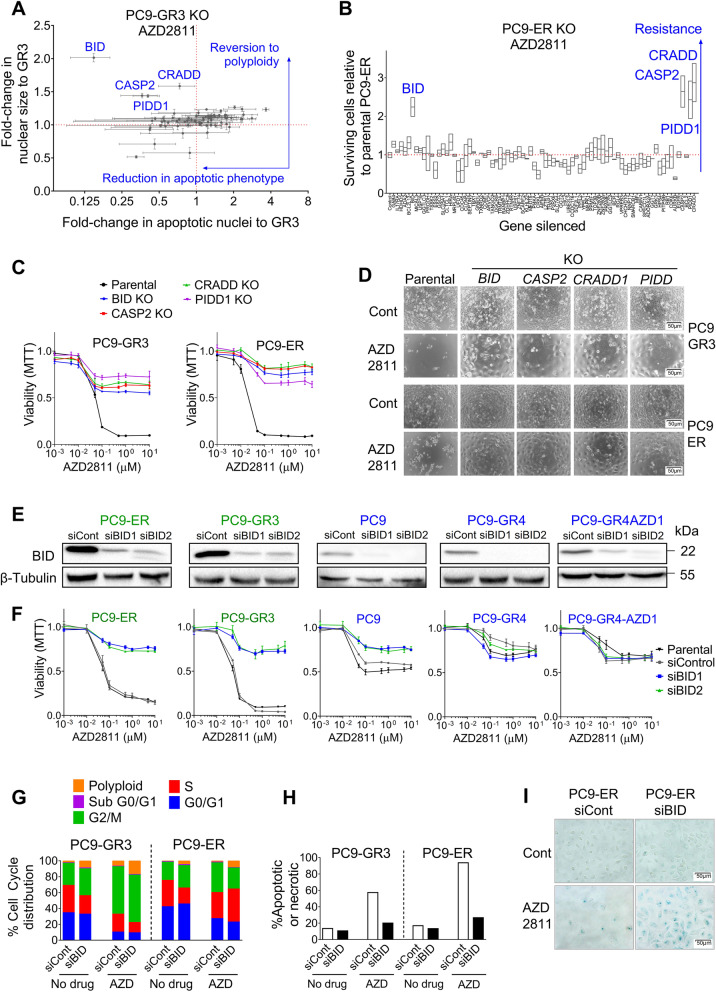
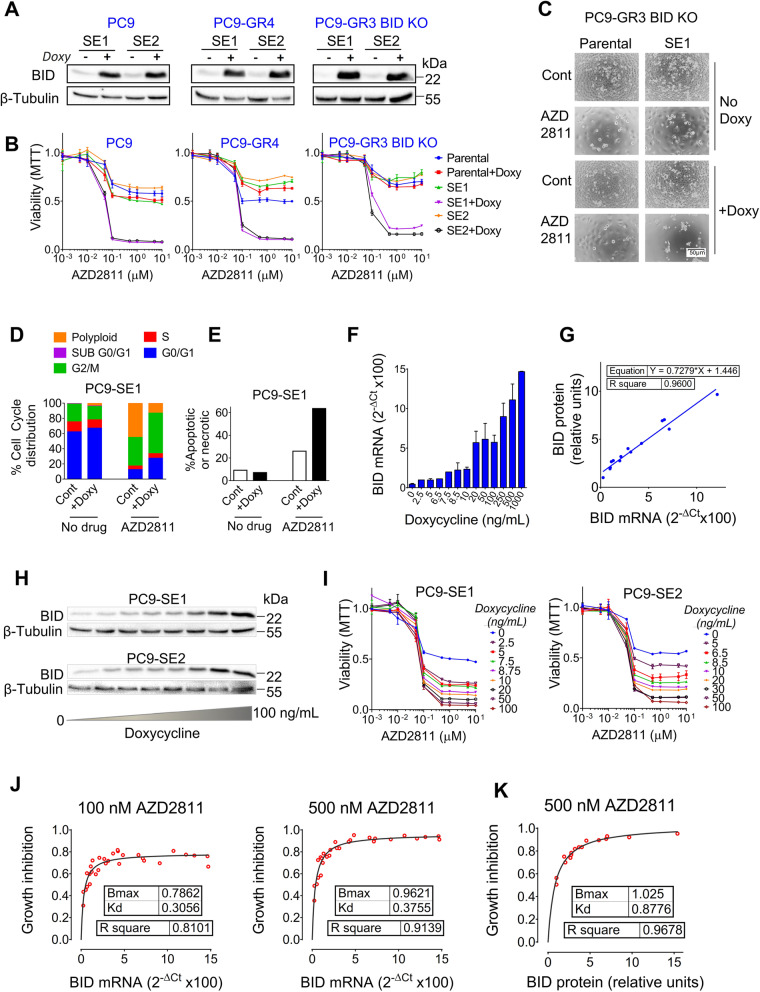
Methods: A panel of 53 tumor cell lines of different origins was used. The effects of drugs were analyzed by MTT and flow cytometry. Copy number status was determined by FISH and Q-PCR; mRNA expression by nCounter and RT-Q-PCR and protein expression by Western blotting. CRISPR-Cas9 technology was used for gene knock-out (KO) and a doxycycline-inducible pTRIPZ vector for ectopic expression. Finally, in vivo experiments were performed by implanting cultured cells or fragments of tumors into immunodeficient mice.

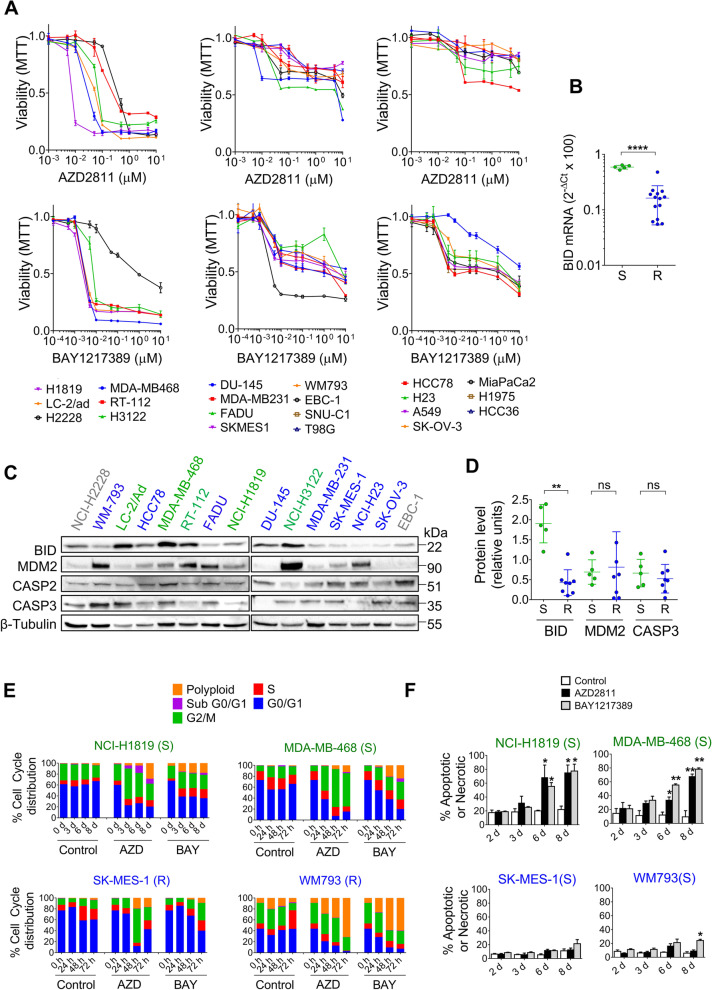
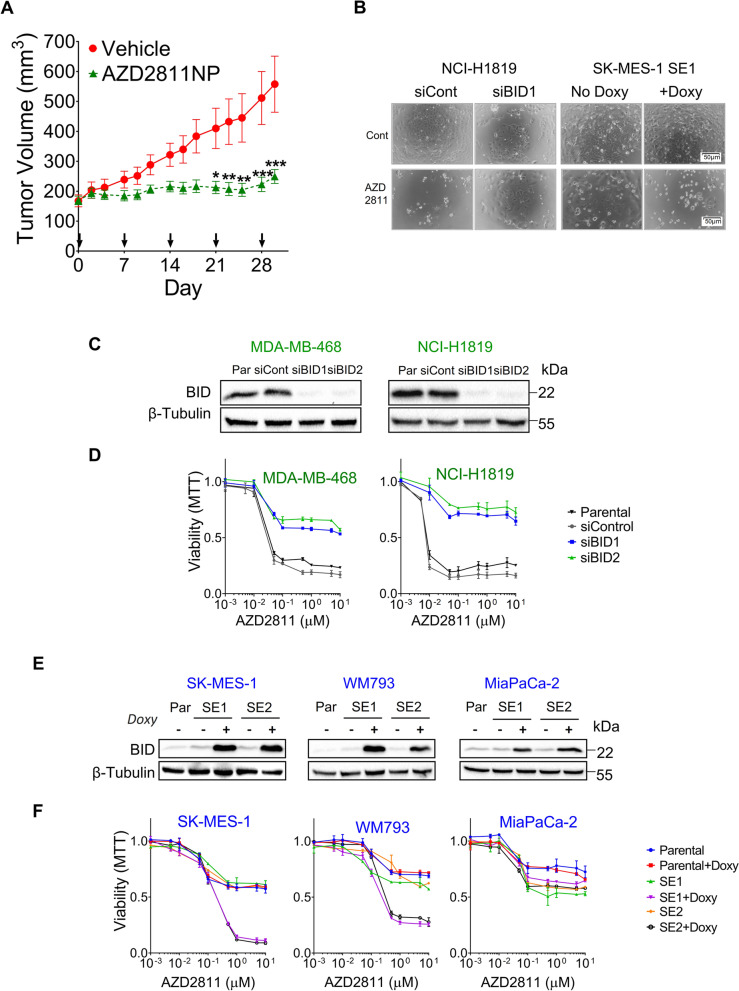
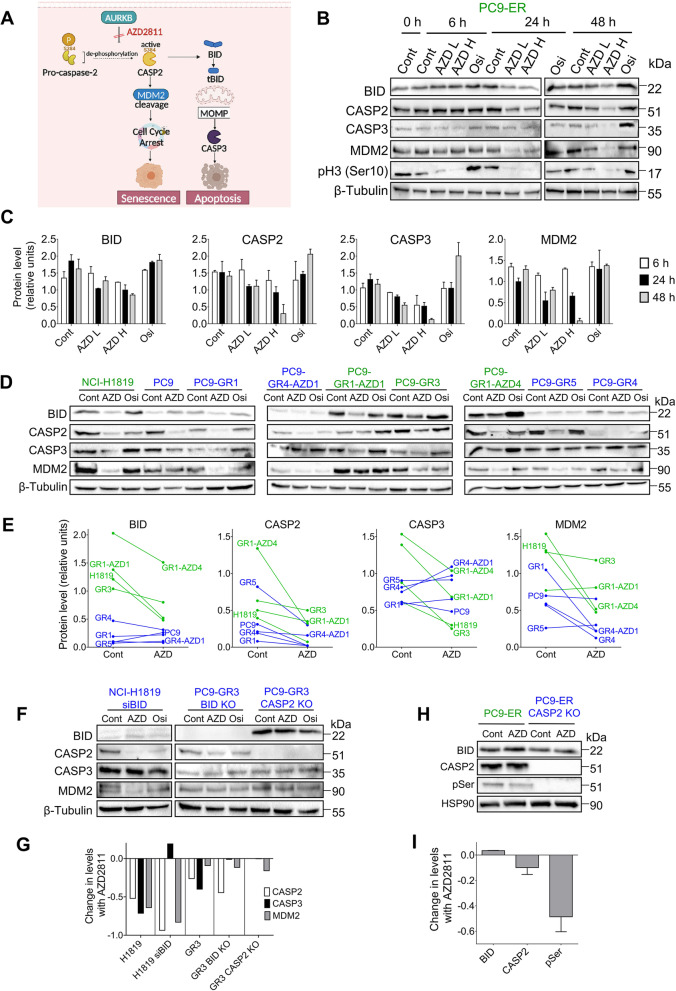
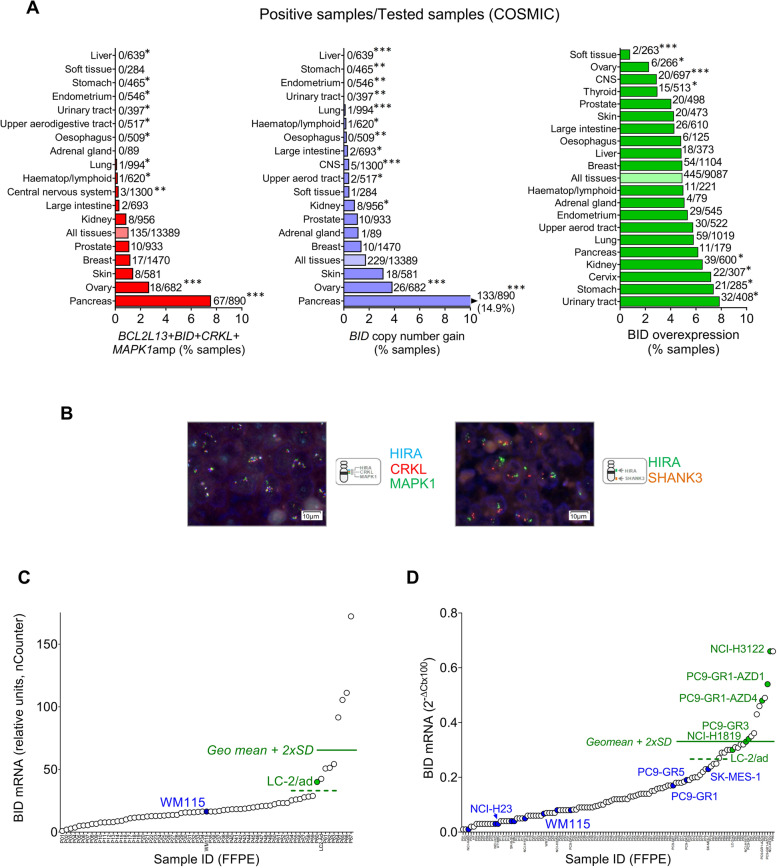
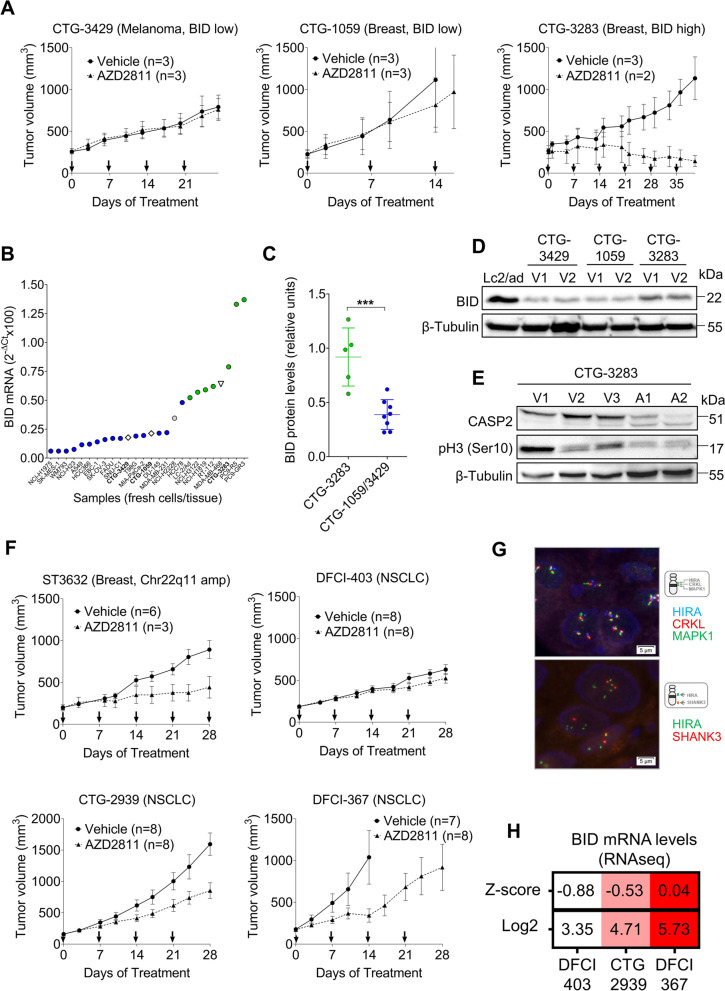
Results: Tumor cells and patient-derived xenografts (PDXs) sensitive to AURKB and TTK inhibitors consistently showed high expression levels of BH3-interacting domain death agonist (BID), while cell lines and PDXs with low BID were uniformly resistant. Gene silencing rendered BID-overexpressing cells insensitive to SAC abrogation while ectopic BID expression in BID-low cells significantly increased sensitivity. SAC abrogation induced activation of CASP-2, leading to cleavage of CASP-3 and extensive cell death only in presence of high levels of BID. Finally, a prevalence study revealed high BID mRNA in 6% of human solid tumors.

Conclusions: The fate of tumor cells after SAC abrogation is driven by an AURKB/ CASP-2 signaling mechanism, regulated by BID levels. Our results pave the way to clinically explore SAC-targeting drugs in tumors with high BID expression.

Keywords: AURKB inhibitor; Abrogation; BID; Biomarker; CASP-2; Cell cycle; Spindle assembly checkpoint (SAC); TTK inhibitor; Tumor.


Conflict of interest statement

I.S. has received fees for consultancy or advisory roles from Roche, Novartis, Boehringer Ingelheim and Takeda. N.R. has received fees for consultancy or advisory roles from Merck Sharp & Dohme Corp, Bristol-Myers Squibb and Pfizer. A.A.H. has received fees for consultancy or advisory roles from Bristol-Myers Squibb, Roche, Merck Sharp & Dohme Corp and Lilly. J.T., S.T., R.W., N.F., G.G., M.X., P.S., J.S., G.F., A.G., U.P. and J.U. are current or former AstraZeneca employees and shareholders. M.A.M.V. has received research funding from Astra Zeneca, In3Bio and Merck Healthcare KGaA. The rest of the authors declare no competing interests.

Figures

Fig. 1
Fig. 1
SAC abrogation has different effects in EGFR TKI resistant clones. A Dose-response plots to AZD2811 (left), BAY1217389 (middle) and LY3295668 (right panels) of EGFR TKI-resistant clones derived from the PC9 cell line. Values shown are means ± SD of three independent experiments. In each experiment, every concentration of drug was tested in six wells (n = 6). B Cell cycle analysis of PC9-ER, PC9-GR3, PC9-GR4 and PC-GR4AZD1 clones. Cells were serum-starved for 24 h, FBS (10%) and AZD2811 (150 nM) or BAY1217389 (50 nM) were added, and cultures submitted to PI staining at the indicated times. S (green) and R (blue), clones sensitive and resistant to SAC abrogation. C Percentage of apoptotic/necrotic cells in PC9-ER, PC9-GR4, PC9-GR4 and PC-GR4AZD1 cultures. Cells were treated with AZD2811 (150 nM) or BAY1217389 (50 nM) and cultures submitted to annexin V/propidium iodide staining at the indicated times. Bars indicate mean ± SEM of two independent experiments. **p<0.01, *p<0.05 (Student’s t test). S (green) and R (blue), clones sensitive and resistant to SAC abrogation
Fig. 2
Fig. 2
Sensitivity to SAC abrogation in EGFR TKI resistant clones is associated with Chr22q11 amplification and upregulation of Chr22q11 genes. A Chromosome 22 WES read density maps of four representative PC9-derived clones, sensitive (S, green) and resistant (R, blue) to SAC abrogation by AURKBi and TTKi. Data were normalized using the parental cell lines. B FISH analysis of representative PC9-derived clones sensitive (S, green) and resistant (R, blue) to SAC abrogation. Probes for the three Chr22q11 genes HIRA, CRKL and MAPK1 (upper and middle panels) or for HIRA and the Chr22 telomeric gene SHANK3 (lower panels) were used. C Chr22 genes significantly up- or down-regulated by Whole Transcriptome Sequencing (WTS) in two representative PC9-derived clones with Chr22q11 amplification (A, green) or diploid (D, blue). Data were normalized against parental PC9 as explained in Supplementary Methods. D mRNA levels of four Chr22q11 genes (BCL2L13, BID, CRKL and MAPK1) in PC9 and 11-18 derived clones, classified according to Chr22q11 status; amplified (A), green vs. diploid (D), blue. RT-Q-PCR was used for mRNA quantification, data were normalized against beta-actin. A fifth gene not in Chr22 (MAPK3) was included as a control. Each point represents a clone, lines indicate mean ± SD. ****p<0.0001, ***p<0.001; ns, not significant (Student’s t test). E Western blotting analysis of four proteins coded by Chr22q11 genes in PC9 and 11-18-derived clones. B2L13 is the protein codified by the BCL2L13 gene. Erk2 (codified by MAPK1) corresponds to the lower band of the doublet and is indicated by an arrow, the upper band is Erk1 (codified by MAPK3). Green, clones with Chr22q11 amplification, sensitive to AURKBi and TTKi; blue, clones diploid for Chr22q11, resistant to both drugs. F Levels of four Chr22q11-codified proteins (B2L13, BID, CRKL and Erk1) in PC9 and 11-18 derived clones, quantified from the Western blotting image presented in (H). The intensity of the bands was normalized using β-tubulin. Clones are classified according to Chr22q11 status; A, amplified, green vs. D, diploid, blue. The Erk1 protein, not codified by a Chr22 gene, was included as a control. Each point represents a clone, lines indicate mean ± SD. ***p<0.001, **p<0.01, *p<0.05; ns, not significant (Student’s t test)
Fig. 3
Fig. 3
BID expression drives sensitivity to SAC abrogation in cells with Chr22q11 amplification. A PC9-GR3 cells (AURKBi/TTKi sensitive) were electroporated with a CAS9-gRNA ribonucleoprotein knock-out (KO) CRISPR library targeting genes located in Chr22q11 (Table S11). Resulting clones were treated with AZD2811 and submitted to a functional assay to determine apoptosis and polyploidy, as described in Methods. Values shown are means and range (n=2). B PC9-ER cells (AURKBi/TTKi sensitive) stably expressing Cas9 were lipofected with the same CRISPR library; the resulting clones were treated with AZD2811 and cell viability determined by MTT at 72 h. Viability data were normalized against the viability observed for PC9-ER Cas9 parental cells treated with AZD2811. A value >1 indicates that a lipofected clone is more resistant to the compound than the parental PC9-ER cells. Values shown are means and range (n=2). C Dose-response curves for AZD2811 of PC9-GR3 and PC9-ER cells CRISPR-KO for selected genes. Cells numbers were determined by MTT at 72 h. Values shown are means ± SD of ≥2 independent experiments. In each experiment, every concentration of drug was tested in six wells (n = 6). D Micrographs of PC9-GR3 and PC9-ER cells CRISPR-KO for selected genes. AZD2811 was added at 150 nM. E PC9-ER, PC9-GR3, PC9, PC9-GR4 and PC9-GR4AZD1 cells were transfected with lentiviral particles for shRNA-based silencing of BID. After puromycin selection, selected colonies were analyzed by Western blotting. Chr22q11-positive and negative cells are indicated in green and blue, respectively. F Dose-response curves for AZD2811 of PC9-ER, PC9-GR3, PC9, PC9-GR4 and PC9-GR4AZD1 colonies with shRNA-based silencing of BID. Cells numbers were determined by MTT at 72 h. Values shown are means ± SD of ≥2 independent experiments. In each experiment, every concentration of drug was tested in six wells (n = 6). G Cell cycle analysis of PC9-GR3 and PC9-ER colonies with shRNA-based silencing. Cells were allowed to attach for 24 h, AZD2811 (150 nM) was added and cultures submitted to PI staining at 72 h. H Percentage of apoptotic/necrotic cells in PC9-GR3 and PC9-ER colonies with shRNA-based silencing. Cells were treated as in (G) and submitted to Annexin V staining. I Acidic beta-galactosidase staining of PC9-ER with shRNA-based silencing after a 72 h treatment with AZD2811
Fig. 4
Fig. 4
Ectopic expression of BID sensitizes Chr22q11 negative cells to SAC abrogation in a dose-dependent manner. A PC9, PC9-GR4 and PC9-GR3 BID KO cells (all of them resistant to AURKBi/TTKi) were transfected with a pTRIPZ lentiviral vector with the BID gene under the control of a doxycycline-inducible promoter. Two transfected colonies per cell type (SE1 and SE2) were cultured in presence of doxycycline (1 µg/mL), Western blotting was used to confirm ectopic expression of the BID protein. B Dose-response curves to AZD2811 of PC9, PC9-GR4 and PC9-GR3 BID KO cells transfected with the pTRIPZ BID vector (SE1 and SE2 colonies). Ectopic expression of BID was induced using 1 µg/mL doxycycline. Cells numbers were determined by MTT at 72 h. Values shown are means ± SD of ≥2 independent experiments. In each experiment, every concentration of drug was tested in six wells (n = 6). C Micrographs of PC9-GR3 BID KO parental and pTRIPZ BID-transfected cells (clone SE1) treated with AZD2811 (150 nM) in the presence and absence of 1 µg/mL doxycycline. D Cell cycle analysis of PC9-SE1 cells treated with AZD2811 (150 nM) for 72 h, in the absence and presence of 1 µg/mL doxocyclin. E Percentage of apoptotic/necrotic cells by Annexin V analysis in PC9-SE1 cells treated with AZD2811 (150 nM) for 72 h, in the absence and presence of 1 µg/mL doxycycline. F Effect of increasing concentrations of doxycycline on the ectopic expression of BID mRNA by PC9-SE1 and SE2 clones, as determined by RT-Q-PCR. G Correlation between the levels of BID protein and BID mRNA ectopic expression in PC9-SE1 and SE2 colonies represented in (F) and (H). H Effect of increasing concentrations of doxycycline on the ectopic expression of BID protein by PC9-SE1 and SE2 colonies, as determined by Western blotting. I Dose-response curves for AZD2811 of PC9-SE1 (left panel) and PC9-SE2 (right panel) clones, ectopic expression of BID protein was induced with increasing concentrations of doxycycline as shown. Cells numbers were determined by MTT at 72 h. Values shown are means ± SD of ≥2 independent experiments. In each experiment, every concentration of drug was tested in six wells (n = 6). J Plot of BID mRNA levels vs. cell growth inhibition at 100 nM AZD2811 (left panel) and 500 nM AZD2811 (right panel) in PC9-SE1 and SE2 cells. K Plot of BID protein levels vs. cell growth inhibition at 500 nM AZD2811 in PC9-SE1 and SE2 cells
Fig. 5
Fig. 5
High expression of BID associates with sensitivity to SAC abrogation in cancer cell lines of diverse origins. A Dose-response plots to AZD2811 (upper panels) and BAY1217389 (lower panels) of cancer cell lines of lung, prostate, breast, pancreas, ovarian, colon and other origins. Values shown are means ± SD of ≥2 independent experiments. In each experiment, every concentration of drug was tested in six wells (n = 6). B BID mRNA levels in cancer cell lines of diverse origins. Cells classified according to response to SAC abrogation in S, sensitive (n=5) and R, resistant (n=14) to both AURKBi and TTKi. Each point represents a cell line, lines indicate mean ± SD. ****p<0.0001 (Student’s t test). C Western blotting analysis of BID, MDM2 and CASP-3 protein levels in cancer cell lines of diverse origins. The seven cell lines sensitive to AURKBi and/or TTKi, together with eight resistant cell lines, were selected for the analysis. Cells sensitive and resistant to both AURKBi and TTKi are indicated in green and blue, respectively. The two cell lines sensitive exclusively to one of the inhibitors are indicated in grey. D BID, MDM2 and CASP3 protein levels in cancer cell lines of diverse origins, quantified from the Western blotting image presented in (C). The intensity of the bands was normalized using β-tubulin. Cells are classified according to response to SAC abrogation in S, sensitive (n=5) and R, resistant (n=14) to both AURKBi and TTKi. Each point represents a cell line, lines indicate mean ± SD. **p<0.001; ns=not significant (Student’s t test). E Cell cycle analysis of the NCI-H1819, MDA-MB-468, SK-MES-1 and WM793 cultures. Cells were allowed to attach, serum starved for 24 h, FBS (10%) and AZD2811 (150 nM) or BAY1217389 (50 nM) were added and cultures submitted to PI staining at the indicated times. Lines sensitive (S) and resistant (R) to SAC abrogation are indicated in green and blue, respectively. F Percentage of apoptotic/necrotic cells in NCI-H1819, MDA-MB-468, SK-MES-1 and WM793 cultures. Cells were treated with AZD2811 (150 nM) or BAY1217389 (50 nM) and cultures submitted to annexin V/PI staining at the indicated times. Bars indicate mean ± SD of two independent experiments. *p<0.05 (Student’s t test). Lines sensitive and resistant to SAC abrogation are indicated in green and blue, respectively
Fig. 6
Fig. 6
High expression of BID associates with sensitivity to SAC abrogation in cancer cell lines of diverse origins (II). A Athymic nude mice bearing NCI-H1819 xenografts were treated with vehicle or AZD2811 nanoparticle formulation (25 mg/kg) once weekly, as indicated by arrows. Tumor volumes were measured by caliper (mean ± SEM, n=9 for each group). Two-way RMANOVA and Bonferroni post-hoc test detected significant differences in Vehicle vs AZD2811 from Day 21 (Day 21,*p<0.05; Days 23 and 25, **p<0.01; Days 28 and 30, ***p<0.001). B Micrographs of SK-MES-1 and NCI-H1819 transfected cells, as explained in (I). AZD2811 was used at 150 nM and doxycycline at 1 µg/mL. C The AURKBi/TTKi-sensitive MDA-MB-468 and NCI-H1819 cells were transfected with shRNA lentiviral particles to silence BID. After puromycin selection, colonies were analyzed by Western blotting. D Dose-response plots to AZD2811 of the colonies selected in (C). E The AURKBi/TTKi-resistant MiaPaCa-2, SK-MES-1 and WM793 cell lines were transfected with the pTRIPZ-BID vector. After puromycin selection, colonies were analyzed by Western blotting. Doxycycline at 1 µg/mL was used to induce ectopic expression of BID. F) Dose-response plots to AZD2811 of the colonies selected in (E)
Fig. 7
Fig. 7
SAC abrogation triggers cell death through a pathway involving BID, CASP-2 and CASP-3. A Schematic depicting the hypothetical transduction pathways triggered by TTK and AURKB inhibitors in cancer cells. Modified from [28]. B PC9-ER cells, sensitive to SAC abrogation, were treated with the AZD2811 150 nM (AZD L), AZD2811 500 nM (AZD H) or Osimertinib 500 nM (osi) and selected proteins of the pathway presented in (A) were assessed by Western blotting. The images shown are a representative of two different experiments. C Quantification of the immunoblots shown in (B). Bars represent mean ± SEM of two independent experiments. D Parental PC9, seven PC9-derived clones and NCI-H1819 cells were treated with Osimertinib 500 nM (osi) or AZD2811 150 nM (AZD) for 24 h (48 h for NCI-H1819) and selected proteins of the pathway presented in (A) were analyzed by Western blotting. Cells sensitive and resistant to SAC abrogation are indicated in green and blue, respectively. E Quantification of the immunoblots shown in (D). The intensity of the bands was normalized against β–tubulin. F NCI-H1819 cells silenced for BID and PC9-GR3 cells knocked-out for BID or CASP2 were treated with AZD2811 (150 nM) or osimertinib (500 nM) and selected proteins assessed by Western blotting. G Quantification of the bands in the Western blottings in (D) and (F), showing changes in protein levels after AZ2811 treatment. The intensity of the bands was normalized against β–tubulin. H Parental PC9-ER cells and PC9-ER CASP-2 KO were treated with AZD2811 (150 nM) and assessed by Western blotting. I Quantification of the bands corresponding to PC9-ER parental cells in the Western blotting shown in (H). The intensity of the bands was normalized against HSP90
Fig. 8
Fig. 8
High expression of BID is frequent in human tumors while Chr22q11 amplification is a rare event. A Frequency of co-amplification of Chr22q11 genes (left panel, red bars), BID copy number gains (middle panel, blue bars) and BID mRNA overexpression (right panel, green bars) in human malignancies, as found in the COSMIC database. Asterisks denote significant differences with the entire tumor cohort (indicated by lighter bars) ***p<0.001, **p<0.01, *p<0.05 (two-tailed z-score). B FISH analysis of a tumor harboring Chr22q11 amplification. Probes for the HIRA, CRKL and MAPK1 (upper panel) or for HIRA and SHANK3 (lower panel) were used. The sample corresponded to a 54-year-old, non-smoker woman with squamous carcinoma of the lung and showed an average of 8 copies of HIRA, CRKL and MAPK1 genes with a 3.0 ratio to the telomeric probe. C Levels of BID mRNA, as quantified by nCounter, in FFPE blocks from a cohort of 67 advanced lung tumors (white dots), AURKB/TTKi-sensitive (green dot) and AURKB/TTKi-resistant (blue dot) cell lines. The names of the cell lines are indicated. The solid and dotted lines indicate the geomean + 2xSD and + SD, respectively. D Levels of BID mRNA, as quantified by RT-Q-PCR in FFPE blocks from a cohort of 94 tumor samples (white dots, Table S14), AURKB/TTKi-sensitive (green dots) and AURKB/TTKi-resistant (blue dots) cell lines. The names of some cell lines are shown on the plot. The solid and dotted lines indicate the geomean + 2xSD and + SD, respectively, of the FFPE tumor samples
Fig. 9
Fig. 9
High expression of BID associates with response to SAC abrogation in patient-derived xenografts (PDXs). A Athymic nude mice bearing CTG-3429, CTG-1059 and CTG-3283 PDXs were treated with vehicle or an AZD2811 nanoparticle formulation (25 mg/kg) once weekly, as indicated by arrows. Panels show tumor volumes as measured by caliper (mean ± SEM). The number of mice per group is indicated in the plots. B Average levels of BID mRNA, as quantified by RT-Q-PCR, in fresh tissue of CTG-3283 (inverted triangle, n=5), CTG3429 and CTG-1059 (diamonds, n=6) patient-derived xenografts. BID mRNA levels in fresh cultures of cell lines sensitive (green dots) and resistant (red dots) to SAC abrogation are also plotted. C Quantification of the BID bands in the Western blotting analyses of PDXs (shown in Figs 9I and S18F). D Western blotting analysis of BID protein in vehicle-treated (V1, V2) PDXs. The results for the rest of PDXs tested are shown in Fig. S18F. E Western blotting analysis of CASP-2 and the AURKB product phosphor-histone H3 (pH3) in CTG-3282 patient-derived xenografts. V1-V3, xenografts treated with vehicle; A1-A2, xenografts treated with AZD2811. F Immunodeficient female mice bearing ST3632, DCFI-403, CTG-2939 and DCFI-367 PDXs were treated with vehicle or an AZD2811 nanoparticle formulation (25 mg/kg) once weekly, as indicated by arrows. Tumor volumes as measured by caliper are shown (mean ± SEM). The number of mice per group is indicated in the plots. G FISH analysis of ST3632 xenografts, revealing 4.6 copies of HIRA, CRKL and MAPK1 per cell (upper panel) and a ratio of 2.1 of HIRA to the Chr22 telomeric gene SHANK3 (lower panel). (H) BID mRNA levels in the NSCLC PDXs presented in (F), as calculated from RNA seq data. The Z-scores and log2 (value + 1) are presented

Similar articles

Cited by

  • LncRNA938/ TAF9/TTK axis promotes EMT and serves as a therapeutic target in hepatoblastoma.
    Jin C, Dong B, Xie Y, Chen X, Wu S, Du F, Dong Q, Zhu C. Jin C, et al. J Transl Med. 2025 Aug 21;23(1):946. doi: 10.1186/s12967-025-06809-4. J Transl Med. 2025. PMID: 40841910 Free PMC article.
  • Unveiling BID: a key biomarker in apoptosis post-intracerebral hemorrhage.
    Dai K, Zhang HR, Ren SY, Zhao MP, Wang N, Gao HZ, Kang DZ, Zheng ZQ. Dai K, et al. Front Neurol. 2025 Feb 28;16:1533558. doi: 10.3389/fneur.2025.1533558. eCollection 2025. Front Neurol. 2025. PMID: 40093739 Free PMC article.
  • A new era in cancer therapy: targeting the Proteasome-Bcl-2 axis.
    Soni S, Anang V, Zhao Y, Horowitz JC, Nho RS, Mebratu YA. Soni S, et al. J Exp Clin Cancer Res. 2025 Aug 21;44(1):246. doi: 10.1186/s13046-025-03505-5. J Exp Clin Cancer Res. 2025. PMID: 40841912 Free PMC article. Review.
  • Aurora B inhibition induces hyper-polyploidy and loss of long-term proliferative potential in RB and p53 defective cells.
    Vora S, Chatterjee S, Andrew A, Kumar RP, Proctor M, Zeng Z, Bhatt R, Nazareth D, Fernando M, Jones MJK, He Y, Hooper JD, McMillan NAJ, Urosevic J, Saeh J, Travers J, Cimini D, Chen J, Gabrielli B. Vora S, et al. Cell Death Dis. 2025 Jan 8;16(1):7. doi: 10.1038/s41419-024-07329-7. Cell Death Dis. 2025. PMID: 39779678 Free PMC article.
  • Polymorphisms within autophagy-related genes as susceptibility biomarkers for pancreatic cancer: A meta-analysis of three large European cohorts and functional characterization.
    Gálvez-Montosa F, Peduzzi G, Sanchez-Maldonado JM, Ter Horst R, Cabrera-Serrano AJ, Gentiluomo M, Macauda A, Luque N, Ünal P, García-Verdejo FJ, Li Y, López López JA, Stein A, Bueno-de-Mesquita HB, Arcidiacono PG, Zanette DL, Kahlert C, Perri F, Soucek P, Talar-Wojnarowska R, Theodoropoulos GE, Izbicki JR, Tamás H, Van Laarhoven H, Nappo G, Petrone MC, Lovecek M, Vermeulen RCH, Adamonis K, Reyes-Zurita FJ, Holleczek B, Sumskiene J, Mohelníková-Duchoňová B, Lawlor RT, Pezzilli R, Aoki MN, Pasquali C, Petrenkiene V, Basso D, Bunduc S, Comandatore A, Brenner H, Ermini S, Vanella G, Goetz MR, Archibugi L, Lucchesi M, Uzunoglu FG, Busch O, Milanetto AC, Puzzono M, Kupcinskas J, Morelli L, Sperti C, Carrara S, Capurso G, van Eijck CHJ, Oliverius M, Roth S, Tavano F, Kaaks R, Szentesi A, Vodickova L, Luchini C, Schöttker B, Landi S, Dohan O, Tacelli M, Greenhalf W, Gazouli M, Neoptolemos JP, Cavestro GM, Boggi U, Latiano A, Hegyi P, Ginocchi L, Netea MG, Sánchez-Rovira P, Canzian F, Campa D, Sainz J. Gálvez-Montosa F, et al. Int J Cancer. 2025 Jan 15;156(2):339-352. doi: 10.1002/ijc.35196. Epub 2024 Sep 25. Int J Cancer. 2025. PMID: 39319538 Free PMC article.

References

    1. Musacchio A, Salmon ED. The spindle-assembly checkpoint in space and time. Nat Rev Mol Cell Biol. 2007;8:379–93. doi: 10.1038/nrm2163. - DOI - PubMed
    1. Lischetti T, Nilsson J. Regulation of mitotic progression by the spindle assembly checkpoint. Mol Cell Oncol. 2015;2:e970484. doi: 10.4161/23723548.2014.970484. - DOI - PMC - PubMed
    1. Ditchfield C, Johnson VL, Tighe A, Ellston R, Haworth C, Johnson T, Mortlock A, Keen N, Taylor SS. Aurora B couples chromosome alignment with anaphase by targeting BubR1, Mad2, and Cenp-E to kinetochores. J Cell Biol. 2003;161:267–80. doi: 10.1083/jcb.200208091. - DOI - PMC - PubMed
    1. Morrow CJ, Tighe A, Johnson VL, Scott MI, Ditchfield C, Taylor SS. Bub1 and aurora B cooperate to maintain BubR1-mediated inhibition of APC/CCdc20. J Cell Sci. 2005;118:3639–52. doi: 10.1242/jcs.02487. - DOI - PubMed
    1. Jelluma N, Brenkman AB, van den Broek NJ, Cruijsen CW, van Osch MH, Lens SM, Medema RH, Kops GJ. Mps1 phosphorylates Borealin to control Aurora B activity and chromosome alignment. Cell. 2008;132:233–46. doi: 10.1016/j.cell.2007.11.046. - DOI - PubMed

Publication types