. 2023 Jul 13;14(1):4084.
doi: 10.1038/s41467-023-39404-6.

Liver lipophagy ameliorates nonalcoholic steatohepatitis through extracellular lipid secretion

Affiliations

Liver lipophagy ameliorates nonalcoholic steatohepatitis through extracellular lipid secretion

Yoshito Minami et al. Nat Commun. .

Abstract

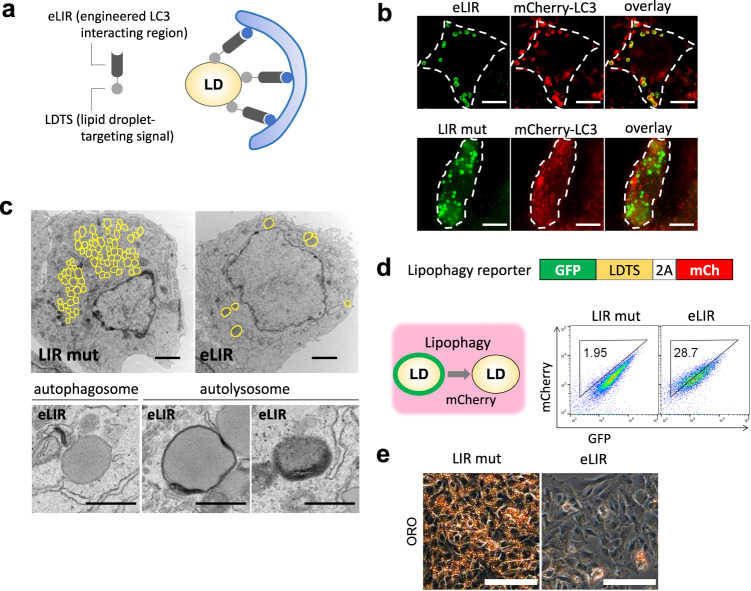
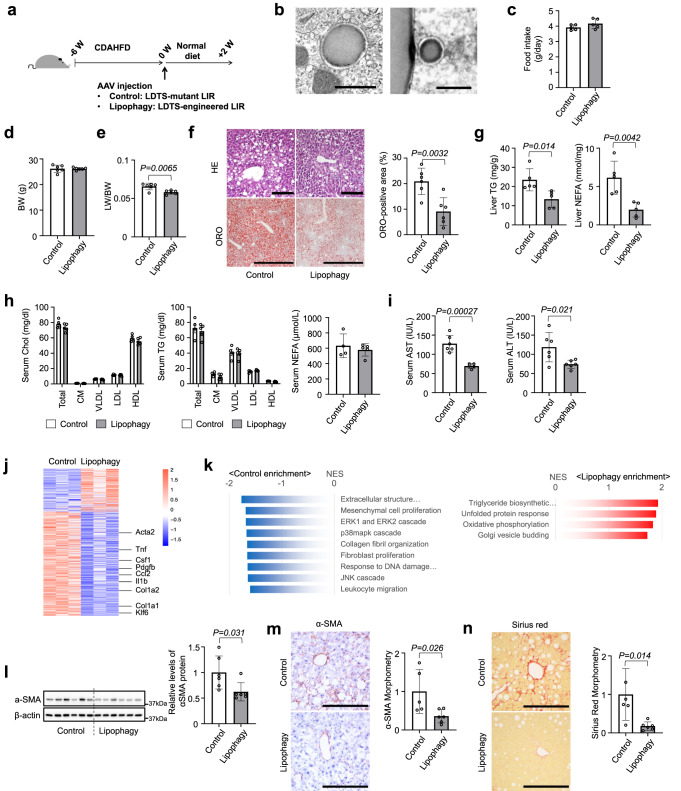
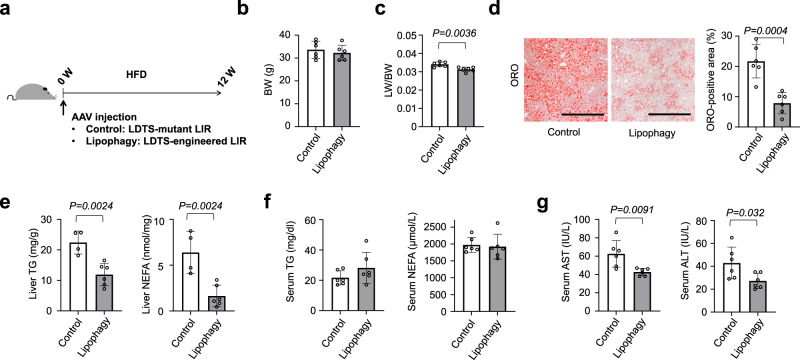
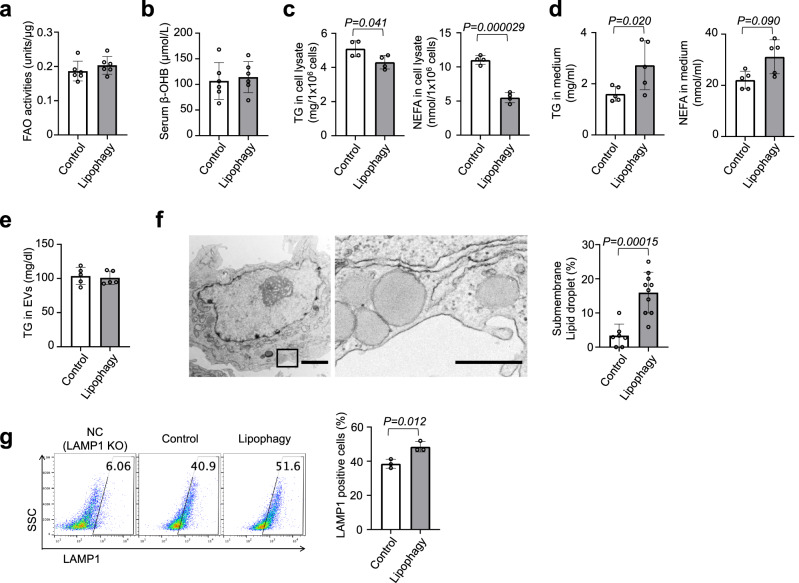
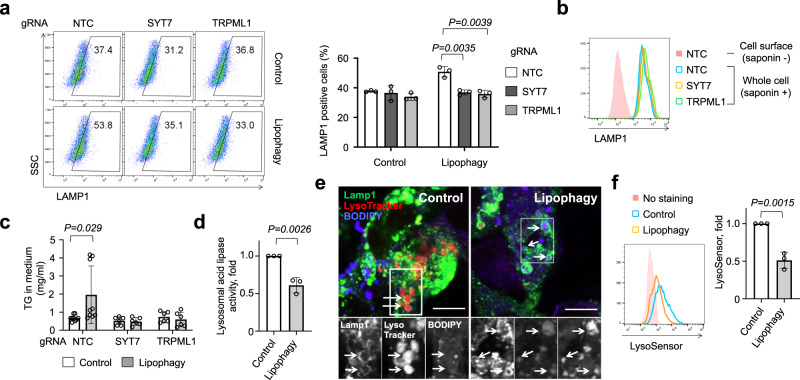
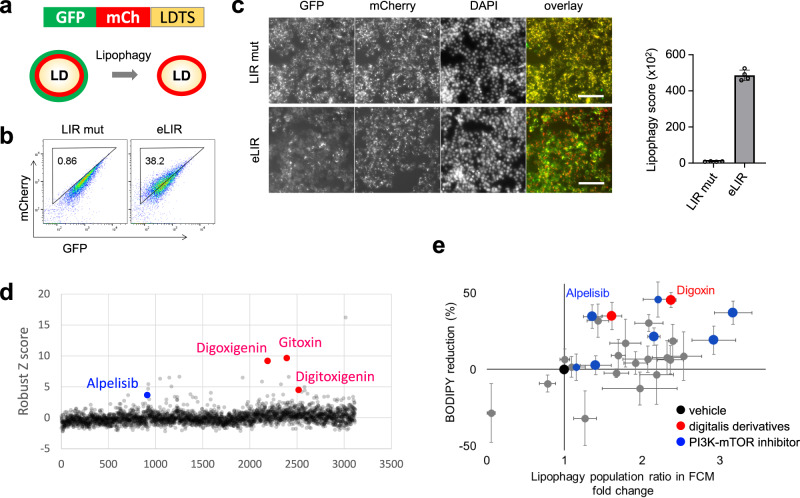
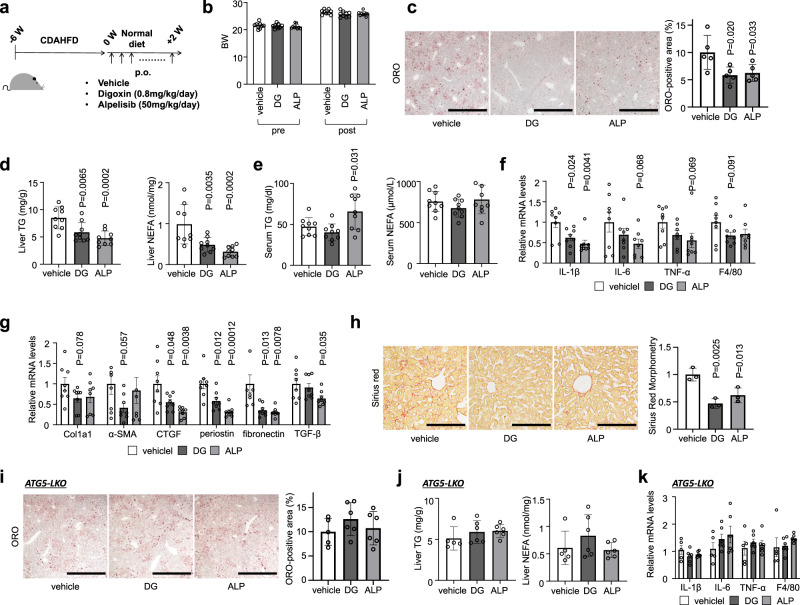
Nonalcoholic steatohepatitis (NASH) is a progressive disorder with aberrant lipid accumulation and subsequent inflammatory and profibrotic response. Therapeutic efforts at lipid reduction via increasing cytoplasmic lipolysis unfortunately worsens hepatitis due to toxicity of liberated fatty acid. An alternative approach could be lipid reduction through autophagic disposal, i.e., lipophagy. We engineered a synthetic adaptor protein to induce lipophagy, combining a lipid droplet-targeting signal with optimized LC3-interacting domain. Activating hepatocyte lipophagy in vivo strongly mitigated both steatosis and hepatitis in a diet-induced mouse NASH model. Mechanistically, activated lipophagy promoted the excretion of lipid from hepatocytes, thereby suppressing harmful intracellular accumulation of nonesterified fatty acid. A high-content compound screen identified alpelisib and digoxin, clinically-approved compounds, as effective activators of lipophagy. Administration of alpelisib or digoxin in vivo strongly inhibited the transition to steatohepatitis. These data thus identify lipophagy as a promising therapeutic approach to prevent NASH progression.


Conflict of interest statement

The authors declare no competing interests.

Figures

Fig. 1
Fig. 1. Synthetic adapter protein to induce lipophagy.
a Schema of lipophagy-inducing synthetic adapter protein. The lipid droplet-targeting sequence (LDTS) from PLIN1 was fused with autophagosome recruiting engineered LC3 interacting region (eLIR). b 3T3L1 adipocytes expressing LDTS-mutant LIR (LIR mut) or LDTS-eLIR-GFP and mCherry-LC3 were analyzed by fluorescence microscopy. Scale bars, 10 µm. c HepG2 cells expressing LDTS-LIR mut or LDTS-eLIR were analyzed by electron microscopy. Lipid droplet is highlighted in yellow. Scale bars, 2 µm and 500 nm. d Lipophagy was quantified by flow cytometry for LDTS-GFP and internal control of mCherry in HepG2 cells expressing LDTS-LIR mut or LDTS-eLIR treated with oleic acid (OA) for 24 h. e HepG2 cells expressing LDTS-LIR mut or LDTS-eLIR were treated with OA for 24 h, and lipid droplets were stained with oil red O. Scale bars, 100 µm. These experiments were repeated independently 3 times with similar results (b, c, e).
Fig. 2
Fig. 2. Lipophagy improved nonalcoholic steatohepatitis in mice fed CDAHFD.
a Study protocol of NASH model with choline-deficient, L-amino acid-defined, high-fat diet (CDAHFD) and the induction of lipophagy with AAV-mediated gene delivery into hepatocytes. b Electron micrographs of lipophagy-induced liver tissues. Scale bars, 1 µm. ce Food intake (c), body weight (d) and liver/body weight (LW/BW) ratios (e) of lipophagy-induced NASH model mice. f Hematoxylin/eosin or oil red O (ORO) staining of liver sections. Scale bars, 1 mm. g Liver TG and NEFA content. h Serum cholesterol and triglyceride (TG) in 4 major fractions and NEFA contents. i Serum AST and ALT levels. j, k RNA sequence and gene set enrichment analysis of liver tissues. l Immunoblots assessing the expression of αSMA in liver tissues. m, n Immunohistochemistry of αSMA (m) and sirius red staining (n) of liver sections and morphometry analysis of signal positive area. Scale bars, 200 µm. All data are presented as mean ± SD (n = 6 per group). P values calculated by two-sided unpaired t-test. Source data are provided as a Source data file.
Fig. 3
Fig. 3. Lipophagy prevented hepatosteatosis in mice fed HFD.
a Study protocol of hepatosteatosis model with high-fat diet (HFD) and the induction of lipophagy with AAV-mediated gene delivery into hepatocytes. b, c Body weight (b) and liver/body weight (LW/BW) ratios (c) of lipophagy-induced mice fed HFD. d ORO staining of liver sections. Scale bars, 1 mm. e, f The levels of TG and NEFA in the liver (e) and serum (f). g Serum AST and ALT levels. All data are presented as mean ± SD (n = 6 per group). P values calculated by two-sided unpaired t-test. Source data are provided as a Source data file.
Fig. 4
Fig. 4. Lipophagy excreted LDs through the lysosomal exocytosis.
a Fatty acid oxidation (FAO) activities of liver tissues in mice fed CDAHFD for the NASH model. b The levels of serum ß-OHB in mice fed CDAHFD (a, b; n = 6 per group). c, d HepG2 cells expressing LDTS-LIR mut (control) or eLIR (lipophagy) were cultured in medium containing oleic and palmitic acid (OA + PA) for 12 h and then incubated in FBS-free medium for 6 h. TG and NEFA of cell lysate (c) and culture supernatant (d) were measured (n = 4 per group). e TG content in serum exosomes in a mouse model of NASH fed with CDAHFD (n = 5 per group). f Electron micrographs of lipophagy-induced hepatocyte. Right image is magnified view of left black square. LDs localized close to cellular membrane was quantified. Scale bars, 2 µm and 500 nm (n = 10 cells per group). g Flow cytometry for Lamp1 in the surface of HepG2 cells expressing LDTS-LIR mut (control) or eLIR (lipophagy). LAMP1 KO cells were used as a negative control (n = 3 per group). All data are presented as mean ± SD. P values calculated by two-sided unpaired t-test. ß-OHB; ß-Hydroxybutyric acid. Source data are provided as a Source data file.
Fig. 5
Fig. 5. Deacidification activated lysosomal exocytosis.
a Flow cytometry for Lamp1 in the surface of control and lipophagy-induced HepG2 cells. SYT7 or TRPML1 was knockout by CRISPR-Cas9 (n = 3 per group). b Flow cytometry to evaluate whole cell expression level of LAMP1 in saponin-treated cells. c TG in the medium of control and lipophagy-induced HepG2 cells. Cells were cultured with FFAs (OA + PA) containing medium for 12 h and then maintained in FBS-free medium for 6 h (n = 9 per NTC group, n = 6 per SYT7 and TRPML1 group). d Lysosome acid lipase activity in control and lipophagy-induced HepG2 cells (n = 3 per group). e Lamp1, LysoTracker Red DND-99 and BODIPY co-staining in control and lipophagy-induced HepG2 cells. Scale bar, 10 mm. f Flow cytometry for LysoSensor Green DND-189 staining of control and lipophagy-induced HepG2 cells (n = 3 per group). All data are presented as mean ± SD. P values calculated by two-sided unpaired t-test. Source data are provided as a Source data file.
Fig. 6
Fig. 6. High content compound screening to find lipophagy activators.
a Schematic diagram showing the image-based reporter system to quantify lipophagy activity level. GFP loses its fluorescence in autolysosomes resulting in a decrease in total fluorescent intensity of GFP in mCherry positive area. b The quality of lipophagy reporter system was confirmed by flow cytometry with LDTS-LIRs. c Automated imaging of lipophagy reporter cells expressing LDTS-LIRs as controls. Scale bars, 100 µm (n = 4 per group). d Robust Z score of approximately 3500 small molecules library. Toxic compounds defined as cell number <80% were excluded. e Individual validation of lipophagy and assessment of intracellular lipid lowering effect among 23 out of 39 primary hits, digoxin and other PI3K-mTOR inhibitors. All data are presented as mean ± SD. P values calculated by two-sided unpaired t-test. Source data are provided as a Source data file.
Fig. 7
Fig. 7. Alpelisib and digoxin prevented the progression of NASH in mice fed CDAHFD.
a Study protocol of digoxin (DG) or alpelisib (ALP) administration in NASH model mice with CDAHFD. b Body weight of control and drugtreated mice. c ORO staining of liver sections. Scale bars, 1 mm. d Liver TG and NEFA content. e Serum TG and NEFA levels. f, g Real-time PCR assessing the expression of inflammation- (f) and fibrosis- (g) related genes in liver tissue. h Sirius red staining of liver sections. Scale bars, 200 µm. i ORO staining of liver sections of liver-specific Atg5 knockout mice fed CDAHFD. j Liver TG and NEFA content of liver-specific Atg5 knockout mice fed CDAHFD. k Real-time PCR assessing the expression of inflammation-related genes in Atg5 knockout liver tissue. Data are presented as mean ± SD of n = 8–9 (ah) and n = 5–6 (ik). P values calculated by one-way ANOVA with Dunnett’s multiple comparison test. Source data are provided as a Source data file.
Fig. 8
Fig. 8. Flow diagram of selection in the nested case-control study.
The results are provided in Table 1.

References

    1. Rinella M, Charlton M. The globalization of nonalcoholic fatty liver disease: prevalence and impact on world health. Hepatology. 2016;64:19–22. doi: 10.1002/hep.28524. - DOI - PubMed
    1. Younossi ZM, et al. Global epidemiology of nonalcoholic fatty liver disease-Meta-analytic assessment of prevalence, incidence, and outcomes. Hepatology. 2016;64:73–84. doi: 10.1002/hep.28431. - DOI - PubMed
    1. Tilg H, Moschen AR. Evolution of inflammation in nonalcoholic fatty liver disease: the multiple parallel hits hypothesis. Hepatology. 2010;52:1836–1846. doi: 10.1002/hep.24001. - DOI - PubMed
    1. Angulo P, et al. Liver fibrosis, but no other histologic features, is associated with long-term outcomes of patients with nonalcoholic fatty liver disease. Gastroenterology. 2015;149:389–397 e310. doi: 10.1053/j.gastro.2015.04.043. - DOI - PMC - PubMed
    1. Krenkel O, et al. Therapeutic inhibition of inflammatory monocyte recruitment reduces steatohepatitis and liver fibrosis. Hepatology. 2018;67:1270–1283. doi: 10.1002/hep.29544. - DOI - PubMed

Publication types