. 2023 Aug;55(8):1267-1276.
doi: 10.1038/s41588-023-01443-6. Epub 2023 Jul 13.

Leveraging polygenic enrichments of gene features to predict genes underlying complex traits and diseases

Affiliations

Leveraging polygenic enrichments of gene features to predict genes underlying complex traits and diseases

Elle M Weeks et al. Nat Genet. 2023 Aug.

Abstract

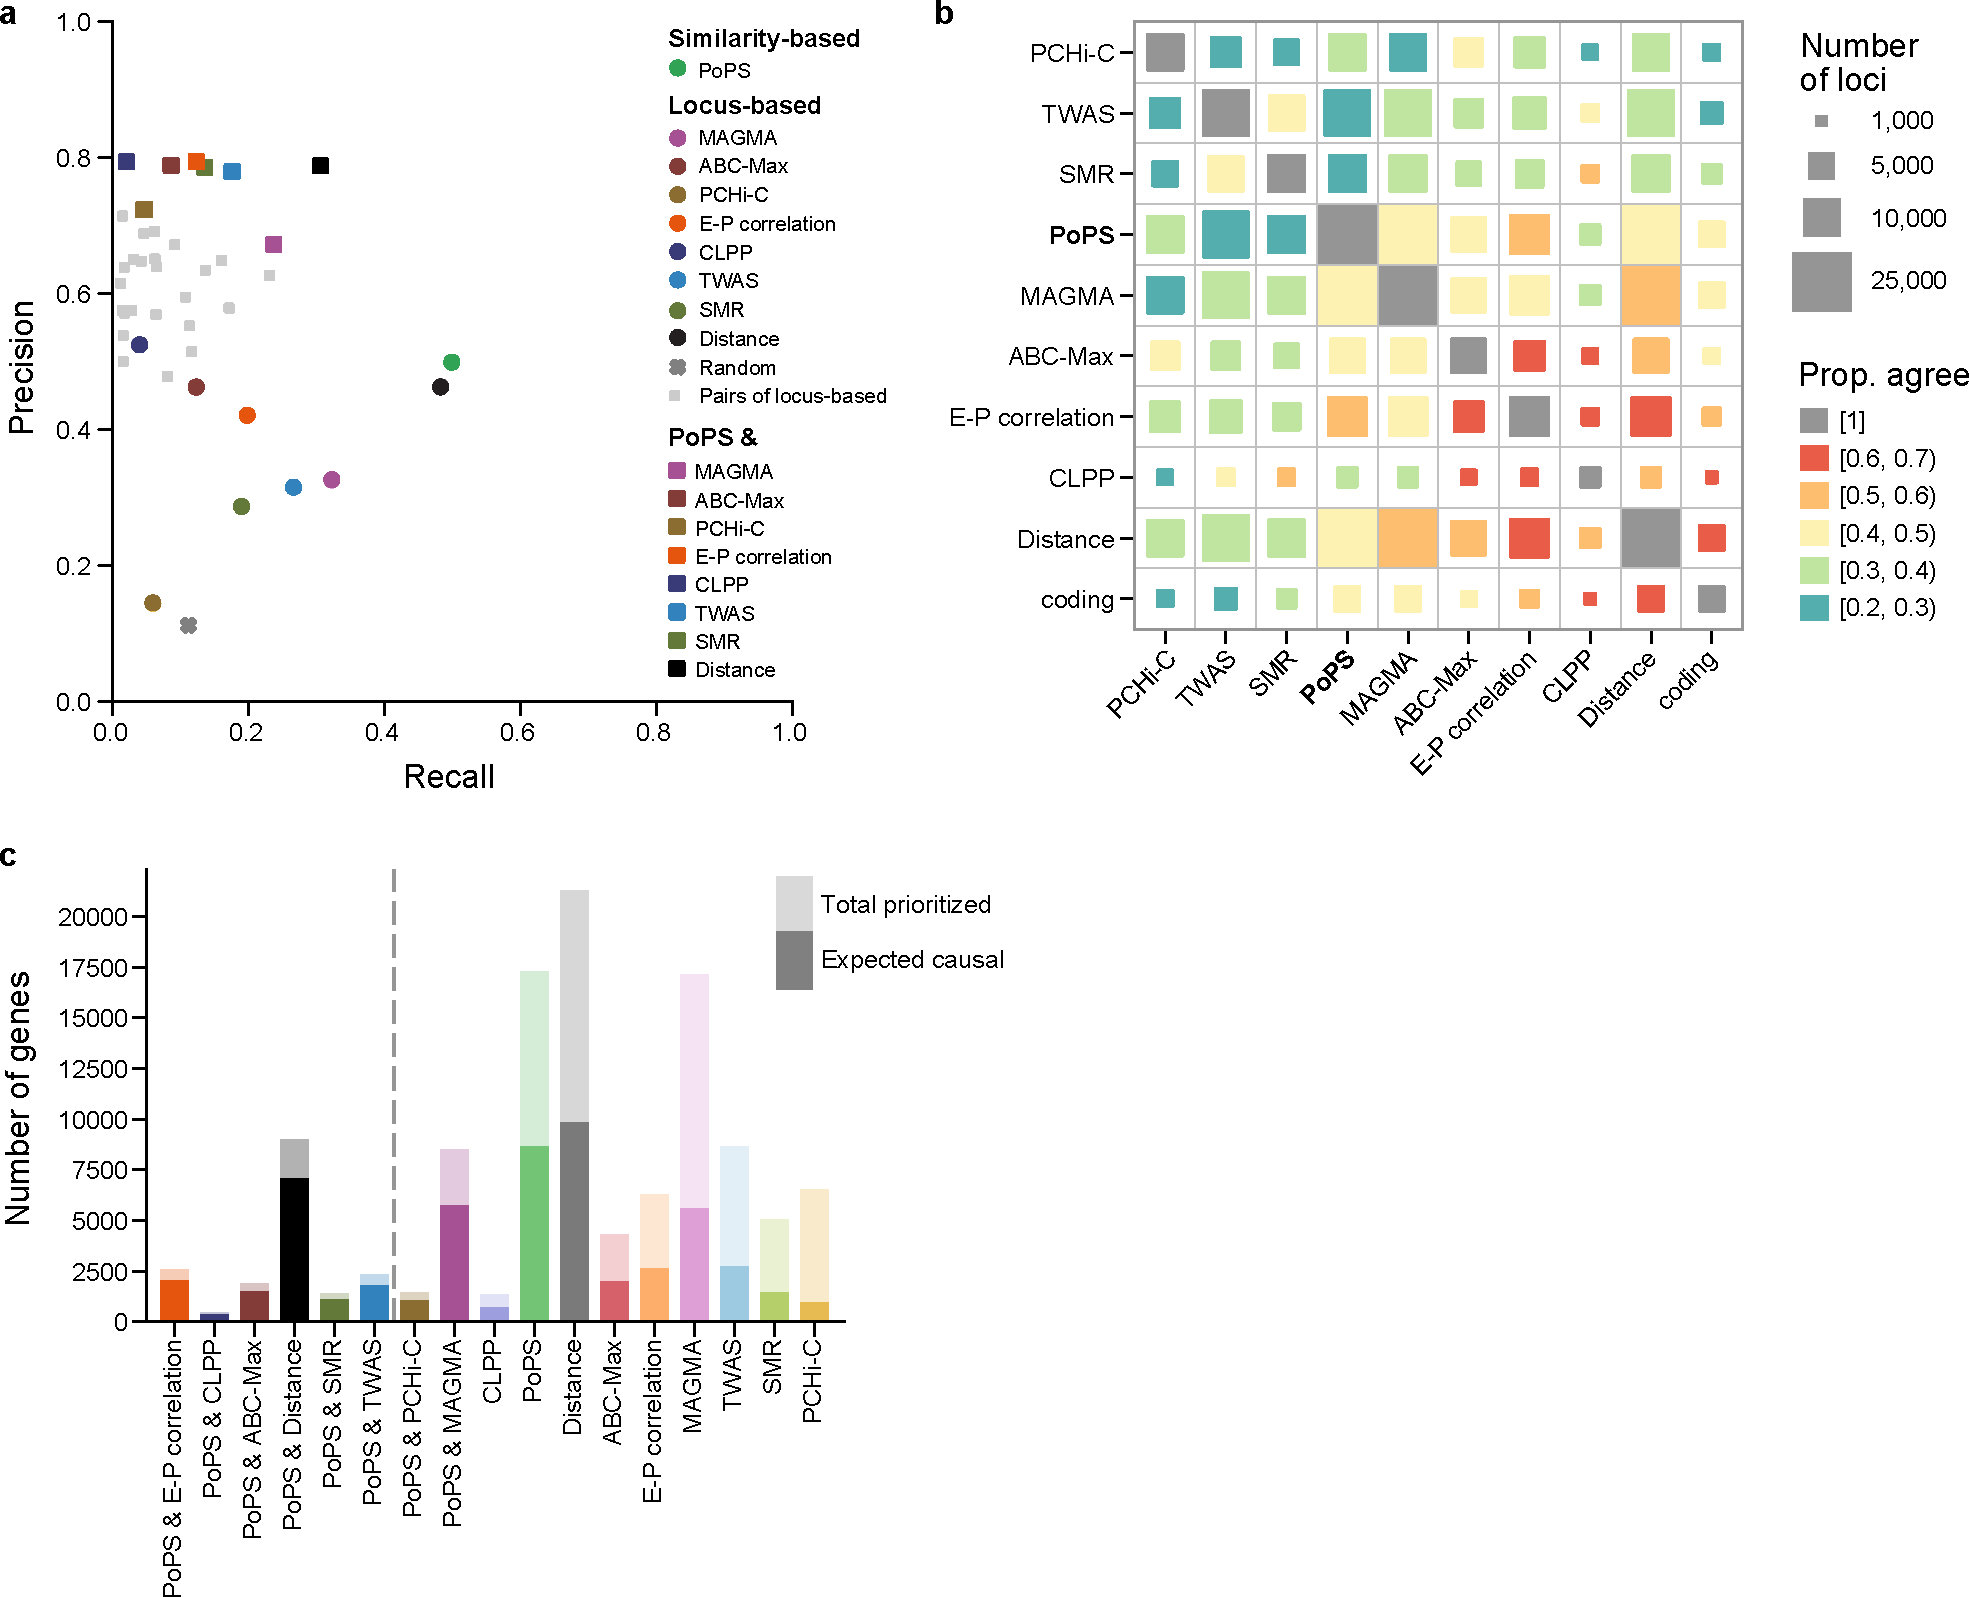
Genome-wide association studies (GWASs) are a valuable tool for understanding the biology of complex human traits and diseases, but associated variants rarely point directly to causal genes. In the present study, we introduce a new method, polygenic priority score (PoPS), that learns trait-relevant gene features, such as cell-type-specific expression, to prioritize genes at GWAS loci. Using a large evaluation set of genes with fine-mapped coding variants, we show that PoPS and the closest gene individually outperform other gene prioritization methods, but observe the best overall performance by combining PoPS with orthogonal methods. Using this combined approach, we prioritize 10,642 unique gene-trait pairs across 113 complex traits and diseases with high precision, finding not only well-established gene-trait relationships but nominating new genes at unresolved loci, such as LGR4 for estimated glomerular filtration rate and CCR7 for deep vein thrombosis. Overall, we demonstrate that PoPS provides a powerful addition to the gene prioritization toolbox.


Conflict of interest statement

Competing Interests

J.C.U reports compensation from consulting services with Goldfinch Bio and is an employee of Illumina. R.S.F. is an employee of Vertex Pharmaceuticals Incorporated. C.P.F. is an employee of Bristol Myers Squibb. J.O.M. reports compensation for consulting services with Cellarity. A.R. is a co-founder and equity holder of Celsius Therapeutics, an equity holder in Immunitas, and was an SAB member of ThermoFisher Scientific, Syros Pharmaceuticals, Neogene Therapeutics and Asimov until July 31, 2020. From August 1, 2020, A.R. is an employee of Genentech. J.N.H. served on the Scientific Advisory Board of and consults for Camp4 Therapeutics. E.S.L. serves on the Board of Directors for Codiak BioSciences and Neon Therapeutics, and serves on the Scientific Advisory Board of F-Prime Capital Partners and Third Rock Ventures; he is also affiliated with several non-profit organizations including serving on the Board of Directors of the Innocence Project, Count Me In, and Biden Cancer Initiative, and the Board of Trustees for the Parker Institute for Cancer Immunotherapy. He has served and continues to serve on various federal advisory committees. The remaining authors declare no competing interests.

Figures

Extended Data Fig. 1
Extended Data Fig. 1. PoPS model parameter choices and feature selection.
a-c, Results using Benchmarker to compare different parameter choices for fitting the PoPS model, meta-analyzed across independent traits (n = 46). Error bars represent 95% confidence intervals around the meta-analyzed point estimate. a, Feature selection: GLS with an L1 penalty on the full set of features performs less well than GLS after marginal selection using a P value < 0.05 threshold from the two-sided Wald test. b, Error model: ordinary least squares (OLS) performs less well than generalized least squares (GLS) using marginal selection from a. c, Joint model regularization: GLS after marginal feature selection with an L2 penalty performs better than similar models with an L1 penalty or no penalty. d, Number of features selected (marginal P value < 0.05 from the two-sided Wald test) and included in the joint predictive model for PoPS for each trait. A legend for trait domain colors is provided in Fig. 2.
Extended Data Fig. 2
Extended Data Fig. 2. Additional comparisons using closest gene metric.
a, Results using closest gene enrichment to compare similarity-based gene prioritization methods, meta-analyzed within each trait domain across independent traits (n = 46). Error bars represent 95% confidence intervals around the meta-analyzed point estimate. b, Results using closest gene enrichment to compare PoPS results using different feature sets, meta-analyzed within each trait domain across independent traits (n = 46). Error bars represent 95% confidence intervals around the meta-analyzed point estimate.
Extended Data Fig. 3
Extended Data Fig. 3. Comparison of gene expression features derived from bulk and single-cell RNA seq datasets.
a, Results using Benchmarker to compare PoPS results using different feature sets, meta-analyzed within each trait domain across independent traits (n = 46). Error bars represent 95% confidence intervals around the meta-analyzed point estimate. b, Results using closest gene enrichment to compare PoPS results using different feature sets, meta-analyzed within each trait domain across independent traits (n = 46). Error bars represent 95% confidence intervals around the meta-analyzed point estimate.
Extended Data Fig. 4
Extended Data Fig. 4. Comparison of similarity-based methods using precision and recall.
Precision-recall plot showing performance of similarity-based methods.
Extended Data Fig. 5
Extended Data Fig. 5. Comparing prioritization criteria.
Precision-recall plots for each method with varying prioritization criteria. Each point shows the precision and recall for a set of prioritized genes selected using prioritization criteria based on absolute thresholds and/or relative rank in a locus. For all methods, the star represents the final chosen criteria. a, Circles: PoP scores ranked ≤ 2–5 in the locus. Star: highest PoPS score in the locus. b, Plus: significant TWAS P value after Bonferroni correction (P < 0.05/235,584). Circles: TWAS P values ranked ≤ 2–5 in the locus. Star: significant TWAS P value after Bonferroni correction (P < 0.05/235,584) and the most significant in the locus. c, Pluses: CLPP > 0.01, 0.1, 0.5, 0.9, and 0.99. Circles: CLPP > 0.01, 0.1, 0.5, 0.9, and 0.99 and also the highest CLPP in the locus. Star: CLPP > 0.1 and also the highest CLPP in the locus. d, Plus: any predicted connection from ABC. Circles: ABC connection strength ranked ≤ 2–5 in the locus. Star: highest ABC connection strength in the locus. e, Pluses: any predicted connection from PCHi-C for individual datasets. Triangle: any predicted connection from PCHi-C in any dataset. Circles: highest connection strength in the locus for individual datasets. Star: highest connection strength in the locus in any dataset. f, Pluses: any predicted connection from E-P correlation for individual datasets. Triangle: any predicted connection from E-P correlation in any dataset. Circles: highest connection strength in the locus for individual datasets. Star: highest connection strength in the locus in any dataset. g, Circle: closest gene by distance to the transcription start site. Star: closest gene by distance to the gene body. h, Circles: MAGMA z-scores ranked ≤ 2–5 in the locus. Star: highest MAGMA score in the locus. i, Plus: significant SMR P value after Bonferroni correction (P < 0.05/18,383). Circles: SMR P values ranked ≤ 2–5 in the locus. Star: significant SMR P value after Bonferroni correction (P < 0.05/18,383) and the most significant in the locus.
Extended Data Fig. 6
Extended Data Fig. 6. Performance of PoPS and locus-based gene prioritization methods by trait.
Precision-recall plots for each method. Each point represents a single trait colored by trait domain. Only traits for which the method prioritized at least five genes in the validation loci were included. A legend for trait domain colors is provided in Fig. 2.
Extended Data Fig. 7
Extended Data Fig. 7. Additional performance metrics using evaluation gene set in 1,348 non-coding loci containing genes that harbor fine-mapped protein coding variants.
a, Sensitivity-specificity plot showing performance of locus-based methods, PoPS, intersections of pairs of locus-based methods, and intersections of PoPs with locus-based methods on the evaluation gene set of 589 genes with fine-mapped protein coding variants. b, Heatmap showing performance using the F-score of locus-based methods, PoPS, intersections of pairs of locus-based methods, and intersections of PoPs with locus-based methods.
Extended Data Fig. 8
Extended Data Fig. 8. Number of prioritized genes for non-UK Biobank traits.
Number of unique gene-trait pairs prioritized by PoPS, locus-based gene prioritization methods, and their intersections, sorted by estimated precision. The full height of each bar represents the total number of genes prioritized. The opaque portion of each bar represents the expected number of true causal genes prioritized. Methods to the left of the dashed line achieve precision greater than 75%.
Extended Data Fig. 9
Extended Data Fig. 9. Known example RBM38.
Top: summary statistics colored by LD to the lead variant and fine-mapping results for variants in the locus colored by credible set. Bottom: results from PoPS and locus-based methods for all genes in the locus. Genes are colored by strength of prediction for each method with a star denoting the prioritized gene. Variant rs737092, RBM38 for mean corpuscular hemoglobin (MCH).
Extended Data Fig. 10
Extended Data Fig. 10. Sensitivity of precision and recall estimates to locus definition.
a, Loci defined as +/− 100 kb on either side of the lead variant. b, Loci defined as +/− 1 Mb on either side of the lead variant. c, Results restricted to loci in fine-mapped regions with three or fewer independent credible sets. d, Results restricted to loci in fine-mapped regions with five or fewer independent credible sets.
Fig. 1 |
Fig. 1 |. Overview of PoPS.
We compute gene-level z-scores from GWAS summary statistics with an LD reference panel using MAGMA. We create gene features from gene expression data, biological pathways, and predicted PPI networks and use marginal feature selection to limit features included to those most likely to be relevant. We then fit a linear model for the dependence of gene-level associations on gene features using generalized least squares (GLS) to account for LD and add an L2 penalty to account for the large number of features. This results in a vector of joint polygenic enrichments of gene features, β^, which we use to assign gene priority scores.
Fig. 2 |
Fig. 2 |. Evaluation of PoPS and comparison to other similarity-based methods.
a, Results using Benchmarker to evaluate PoPS, grouped by trait domain and sorted by the lower bound of the 95% confidence interval of normalized τ. Normalized τ provides an estimate for the average contribution of SNPs near genes with high priority scores to per SNP heritability, normalized by average per SNP heritability. Error bars represent 95% confidence intervals around the point estimate. One-sided p-values were computed using the z-score test for heritability enrichment in S-LDSC. Opaque bars passed the Bonferroni significance threshold. For IBD and Alzheimer’s we retained summary statistics from both UK Biobank and other publicly available sources with a greater sample size. b, Results using closest gene enrichment to evaluate PoPS ordered as in panel a. Error bars represent 95% confidence intervals around the point estimate. One-sided p-values were computed using a normal approximation to the null distribution, and opaque bars passed the Bonferroni significance threshold. c, Results using Benchmarker to compare similarity-based gene prioritization methods, meta-analyzed within each trait domain across independent traits (n = 46 independent traits). Error bars represent 95% confidence intervals around the meta-analyzed point estimate.
Fig. 3 |
Fig. 3 |. Most informative gene features used by PoPS.
a, Results using Benchmarker to compare PoPS using different feature sets, meta-analyzed within each trait domain across independent traits (n = 46 independent traits). Error bars represent 95% confidence intervals around the meta-analyzed point estimate. b, Rank-order plots for selected traits highlighting the feature clusters with the greatest contribution to the PoP scores of prioritized genes.
Fig. 4 |
Fig. 4 |. Comparing and combining PoPS with locus-based methods.
a, Precision-recall plot showing performance of locus-based methods, PoPS, intersections of pairs of locus-based methods, and intersections of PoPs with locus-based methods using the evaluation gene set of 589 genes with fine-mapped protein coding variants in 1,348 non-coding loci containing genes that harbor fine-mapped protein coding variants. b, Overlap and agreement among methods across all genome-wide significant loci. Each square represents a pair of methods; the size corresponds to the number of loci where both methods prioritize a gene, and the color corresponds to the proportion of these loci where both methods prioritize the same gene. c, Number of unique gene-trait pairs prioritized across all genome-wide significant loci by PoPS, locus-based gene prioritization methods, and intersections of PoPs with locus-based methods, sorted by estimated precision. The full height of each bar represents the total number of genes prioritized. The opaque portion of each bar represents the expected number of true causal genes prioritized. Methods to the left of the dashed line achieve precision greater than 75%.
Fig. 5 |
Fig. 5 |. High confidence genes for selected traits.
Top five genes prioritized by PoPS+local, ranked by PoP score, for selected traits. Shaded boxes indicate if a method prioritized the gene.
Fig. 6 |
Fig. 6 |. Known and novel biological examples.
Top: summary statistics colored by LD to the lead variant and fine-mapping results for variants in the locus colored by credible set. Bottom: results from PoPS and locus-based methods for all genes in the locus. Genes are colored by strength of prediction for each method with a star denoting the prioritized gene. a, rs1175550, SMIM1 for mean corpuscular hemoglobin concentration (MCHC). b, rs1550270, CPE for bone mineral density (eBMD). c, rs11029928, LGR4 for estimated glomerular filtration rate (eGFR). d, rs112401631, CCR7 for deep vein thrombosis (DVT).

References

    1. Visscher PM et al. 10 Years of GWAS Discovery: Biology, Function, and Translation. Am. J. Hum. Genet. 101, 5–22 (2017). - PMC - PubMed
    1. Donnelly P Progress and challenges in genome-wide association studies in humans. Nature 456, 728–731 (2008). - PubMed
    1. Gallagher MD & Chen-Plotkin AS The post-GWAS era: From association to function. Am. J. Hum. Genet. 102, 717–730 (2018). - PMC - PubMed
    1. Reich DE et al. Linkage disequilibrium in the human genome. Nature 411, 199–204 (2001). - PubMed
    1. van Arensbergen J, van Steensel B & Bussemaker HJ In search of the determinants of enhancer-promoter interaction specificity. Trends Cell Biol. 24, 695–702 (2014). - PMC - PubMed

METHODS-ONLY REFERENCES

    1. Purcell S et al. PLINK: a toolset for whole-genome association and population-based linkage analysis. American Journal of Human Genetics (2007). - PMC - PubMed
    1. Loh P-R, Kichaev G, Gazal S, Schoech AP & Price AL Mixed-model association for biobank-scale datasets. Nat. Genet. 50, 906–908 (2018). - PMC - PubMed
    1. Zhou W et al. Efficiently controlling for case-control imbalance and sample relatedness in large-scale genetic association studies. Nature Genetics vol. 50 1335–1341 Preprint at 10.1038/s41588-018-0184-y (2018). - DOI - PMC - PubMed
    1. Stuart T et al. Comprehensive integration of single-cell data. Cell 177, 1888–1902.e21 (2019). - PMC - PubMed
    1. Baglama J & Reichel L Restarted block Lanczos bidiagonalization methods. Numer. Algorithms 43, 251–272 (2007).

Publication types

MeSH terms