. 2023 Sep;33(9):679-698.
doi: 10.1038/s41422-023-00844-w. Epub 2023 Jul 13.

α-myosin heavy chain lactylation maintains sarcomeric structure and function and alleviates the development of heart failure

Affiliations

α-myosin heavy chain lactylation maintains sarcomeric structure and function and alleviates the development of heart failure

Naijin Zhang et al. Cell Res. 2023 Sep.

Abstract

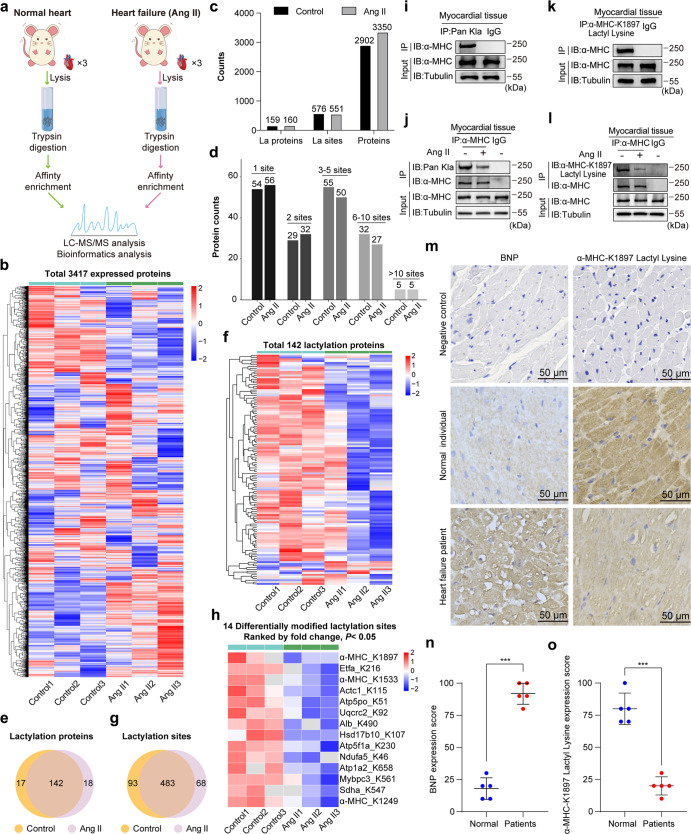
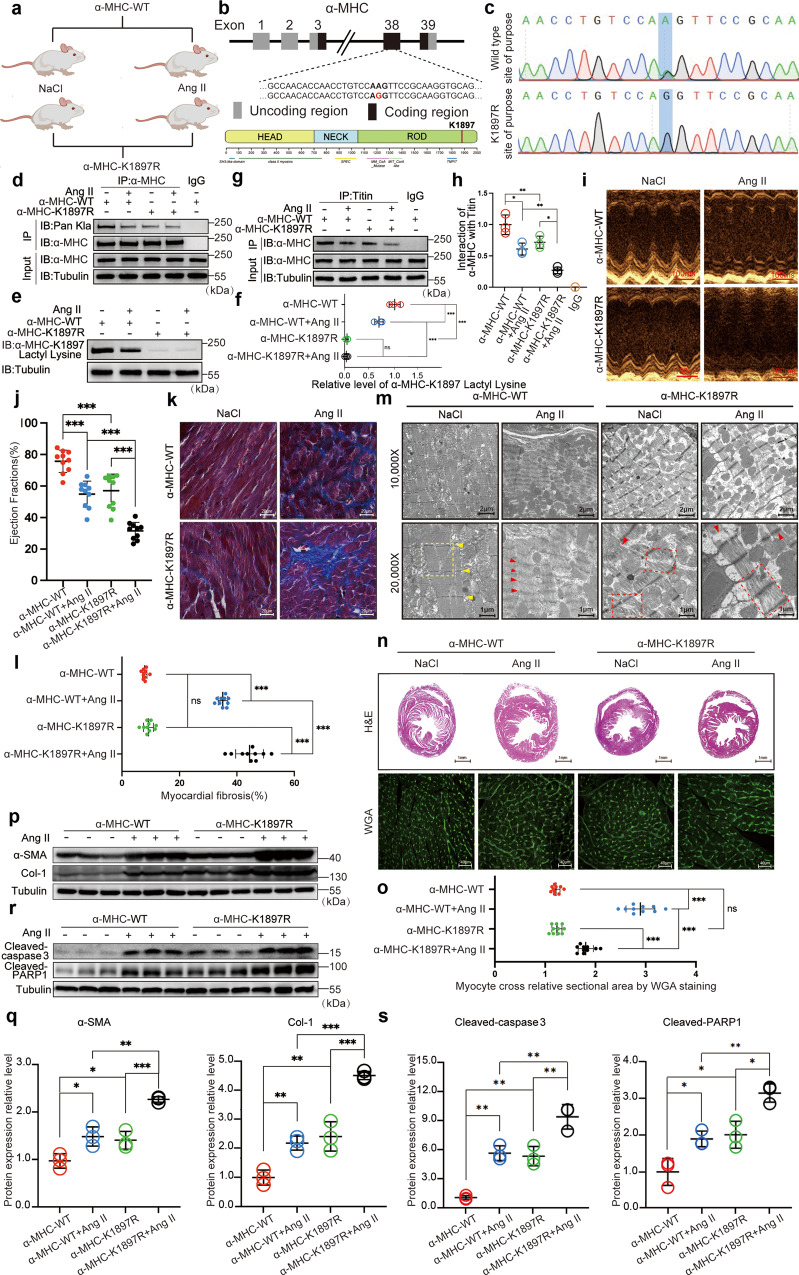
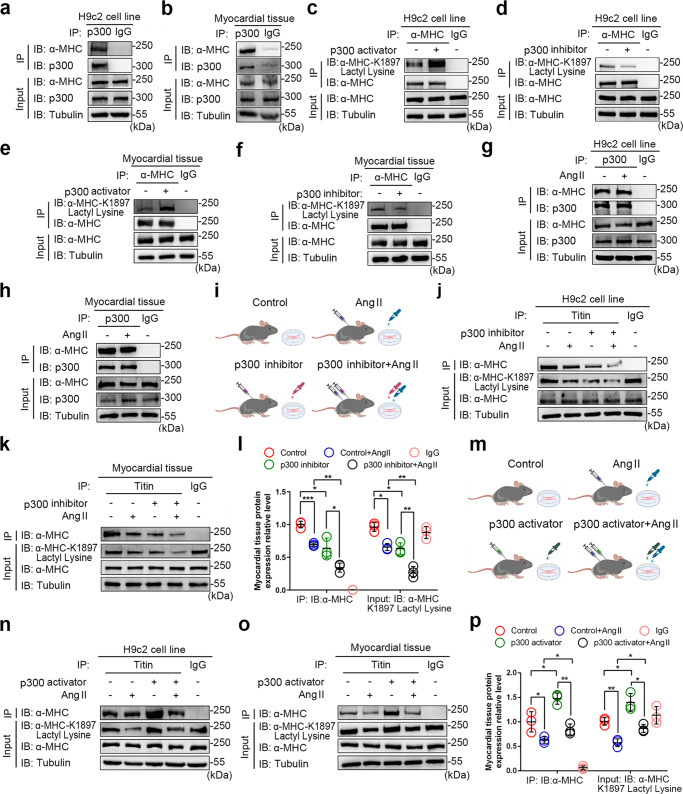
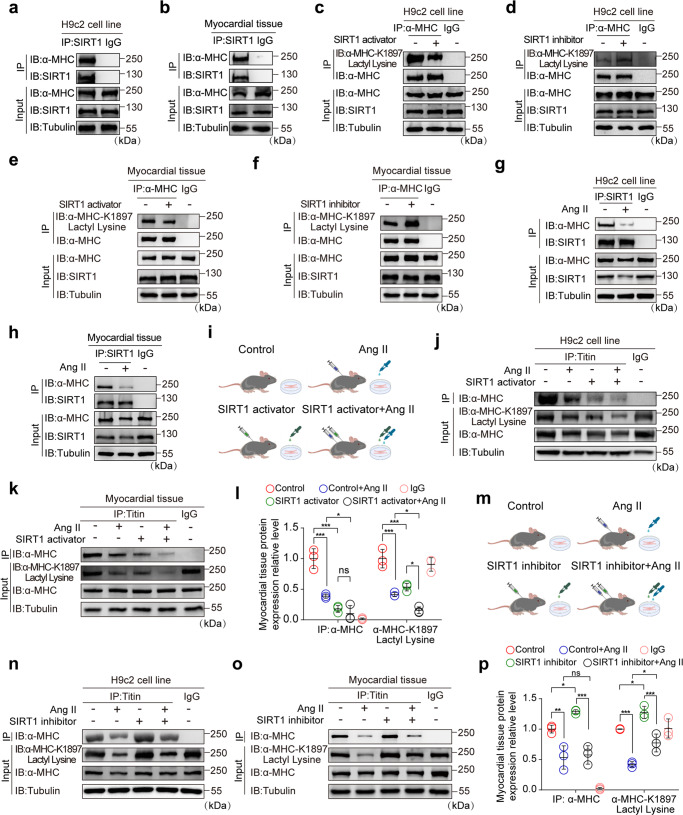
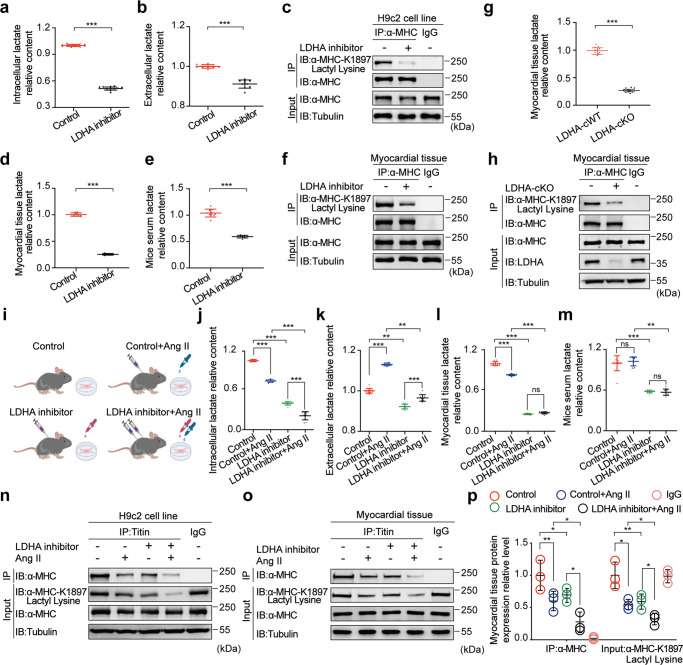
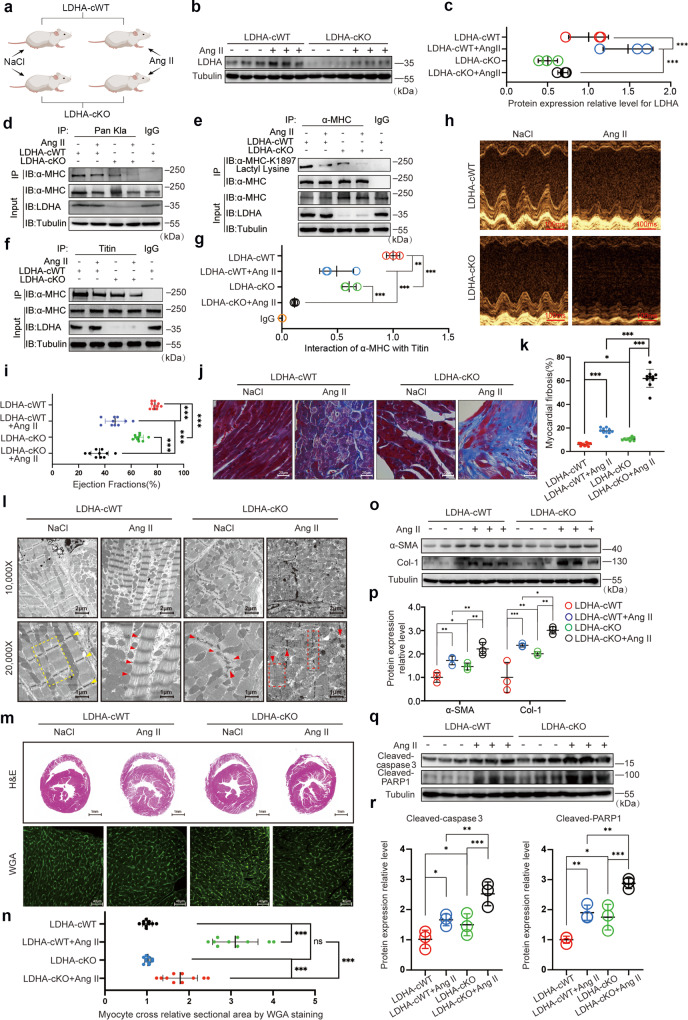
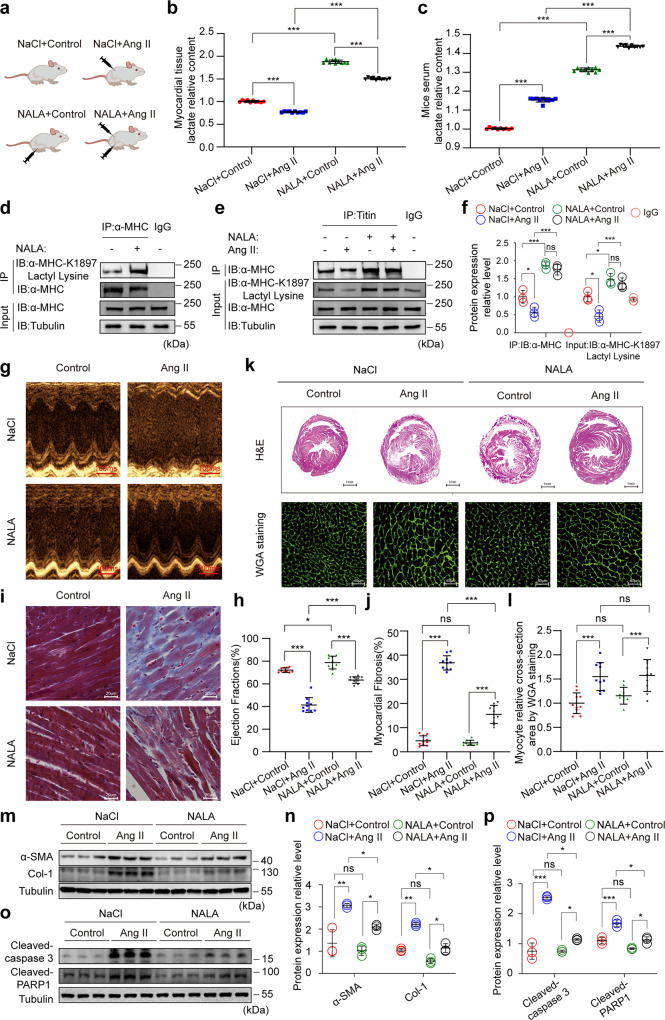
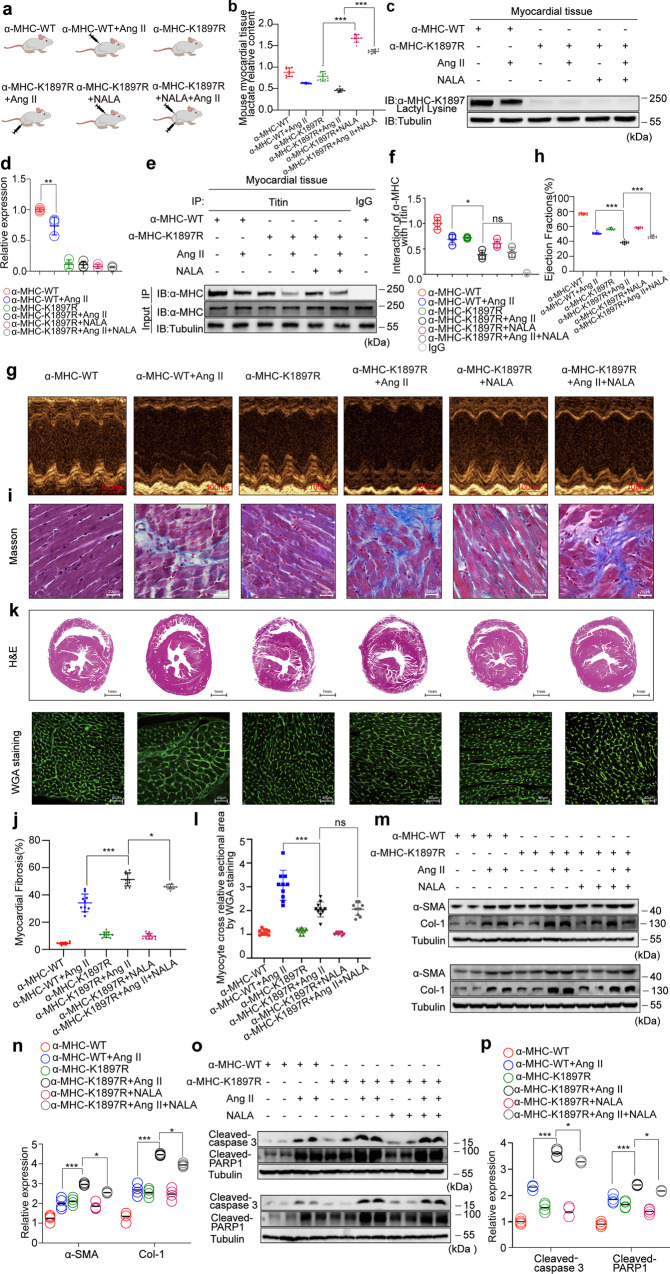
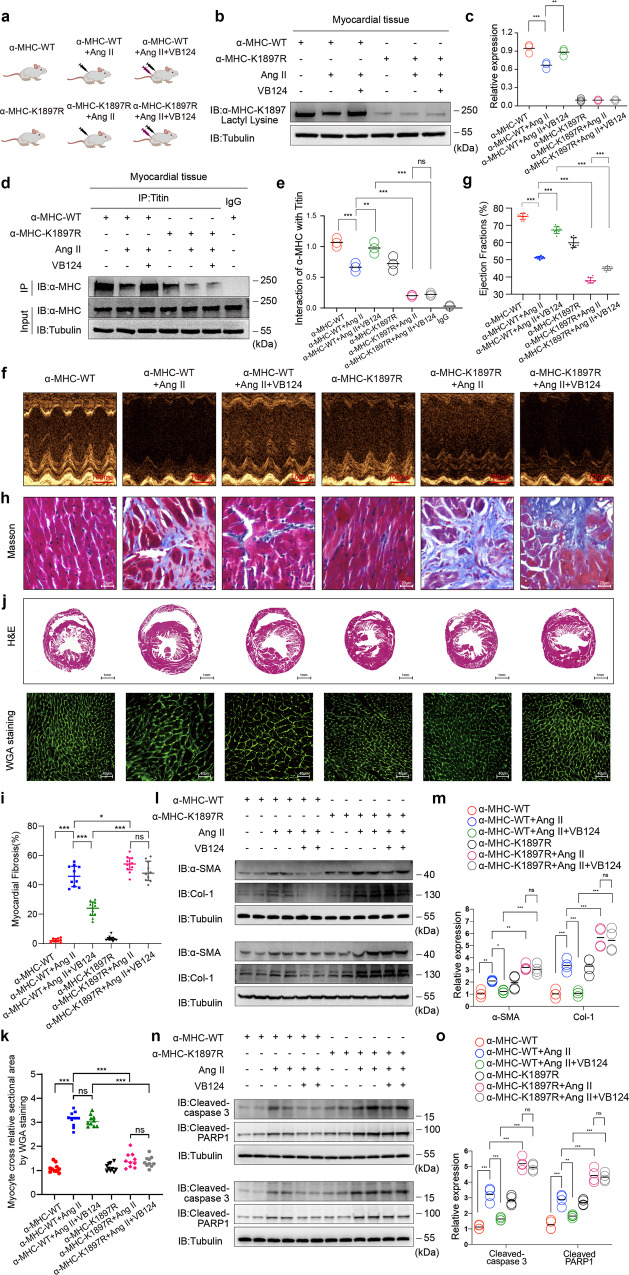
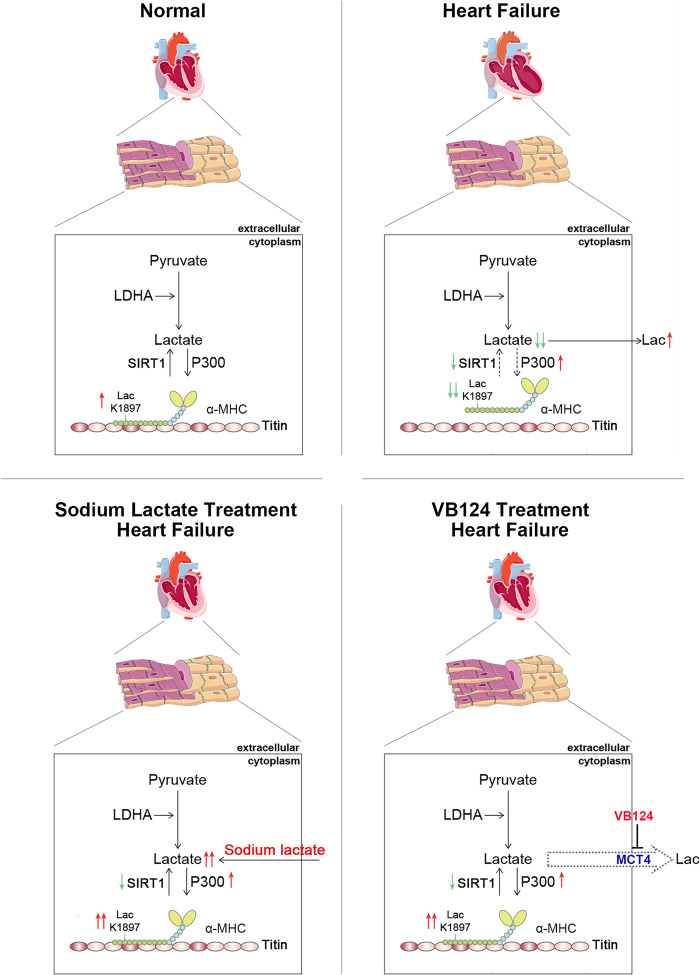
The sarcomeric interaction of α-myosin heavy chain (α-MHC) with Titin is vital for cardiac structure and contraction. However, the mechanism regulating this interaction in normal and failing hearts remains unknown. Lactate is a crucial energy substrate of the heart. Here, we identify that α-MHC undergoes lactylation on lysine 1897 to regulate the interaction of α-MHC with Titin. We observed a reduction of α-MHC K1897 lactylation in mice and patients with heart failure. Loss of K1897 lactylation in α-MHC K1897R knock-in mice reduces α-MHC-Titin interaction and leads to impaired cardiac structure and function. Furthermore, we identified that p300 and Sirtuin 1 act as the acyltransferase and delactylase of α-MHC, respectively. Decreasing lactate production by chemical or genetic manipulation reduces α-MHC lactylation, impairs α-MHC-Titin interaction and worsens heart failure. By contrast, upregulation of the lactate concentration by administering sodium lactate or inhibiting the pivotal lactate transporter in cardiomyocytes can promote α-MHC K1897 lactylation and α-MHC-Titin interaction, thereby alleviating heart failure. In conclusion, α-MHC lactylation is dynamically regulated and an important determinant of overall cardiac structure and function. Excessive lactate efflux and consumption by cardiomyocytes may decrease the intracellular lactate level, which is the main cause of reduced α-MHC K1897 lactylation during myocardial injury. Our study reveals that cardiac metabolism directly modulates the sarcomeric structure and function through lactate-dependent modification of α-MHC.


Conflict of interest statement

The authors declare no competing interests.

Figures

Fig. 1
Fig. 1. α-MHC K1897 lactylation is decreased in mice and humans with heart failure.
a Flow chart showing LC-MS/MS analysis and bioinformatic analysis of control and Ang II-induced heart failure mice (n = 3 per group). b Heatmap of total 3417 expressed proteins of control and Ang II group cardiac samples, displayed individually for each biological replicate. Rows represented individual proteins detected by quantitative MS/MS. c Column graph of omics data showing the number of proteins, lactylation-modified proteins and lactylation sites identified by MS/MS. d Column graph showing protein quantitative distribution map based on protein lactylation sites identified by MS/MS in control and Ang II groups. e Venn diagram showing the shared and specific lactylation-modified proteins in control and Ang II groups. f Heatmap of 142 shared lactylation proteins in the control and Ang II-treated mice heart samples, displayed individually for each biological replicate. Rows represented individual proteins detected by quantitative MS/MS. g Venn diagram showing the shared and specific lactylation sites. h 14 differentially modified lactylation sites of the shared 483 lactylated modified sites in g, using cut offs of fold change > 1.5 or fold change < 0.67, and P value < 0.05. The selected 14 lactylated modified sites were ranked by fold change. i Each WT mouse heart was lysed and immunoprecipitated using anti-Pan Kla antibody or control IgG followed by detection of α-MHC. k Each WT mouse heart was lysed and immunoprecipitated using anti-α-MHC K1897 Lactyl Lysine antibody or control IgG followed by detection of α-MHC. j, l Hearts from control mice and Ang II-treated mice were lysed and immunoprecipitated with anti-α-MHC antibody or control IgG, followed by detection of Pan Kla (j) and α-MHC K1897 Lactyl Lysine (l). m Representative immunohistochemical (IHC) staining of BNP (left) and α-MHC K1897 Lactyl Lysine (right) in the myocardial tissue from normal individuals and heart failure patients. Negative controls were performed with rabbit IgG. n, o Quantification of the relative BNP and α-MHC K1897 Lactyl Lysine expression score. Data are presented as mean ± standard deviation (SD) (n = 5, ***P < 0.001).
Fig. 2
Fig. 2. α-MHC K1897R mutation reduces α-MHC binding with Titin and aggravates heart failure in mice.
a Schematic for experimental intervention in mice. Micro-osmotic pumps were used to deliver NaCl or Ang II subcutaneously to α-MHC K1897R KI and α-MHC WT mice. b Structural domains of α-MHC (bottom) and the amino acid change made at the α-MHC mutation site (above). The position of the 1897 mutation is indicated. c The nucleotide mutation site in α-MHC K1897R KI mice. d Each mouse myocardial tissues indicated in a was lysed and immunoprecipitated using anti-α-MHC antibody or control IgG followed by detection of Pan Kla. e α-MHC K1897 Lactyl Lysine was detected by western blot (WB) in each mouse myocardial tissues indicated in a. f Quantification of relative expression level of α-MHC K1897 Lactyl Lysine. Tubulin was used as an internal reference (n = 3 per group). g Each mouse myocardial tissue indicated in a was lysed and immunoprecipitated using anti-Titin antibody or control IgG followed by detection of α-MHC. h Quantification of the interaction between α-MHC and Titin. Tubulin was used as an internal reference (n = 3 per group). i Representative M-mode echocardiogram of WT and α-MHC K1897R KI mice after NaCl or Ang II treatment. j Cardiac function was evaluated by EF (n = 10 per group). k, l Masson staining to detect myocardial fibrosis and the quantification of the degree of fibrosis. (n = 10 per group). m Transmission electron microscope images of myocardial tissue ultrastructure showing myofilaments of WT and α-MHC K1897R KI mice after NaCl or Ang II treatment. The yellow dotted border lines indicate the normal sarcomere structure, and the red dotted border lines indicate the damaged sarcomere structure. The arrowheads indicate Z disk in myocardial tissue. n Representative heart sections stained with H&E (top) and WGA (bottom) to detect the presence of hypertrophy in cardiomyocytes. o Quantification of relative cardiomyocyte cross-sectional area (n = 10 per group). p, q WB and quantification of fibrosis markers (α-SMA, Col-1) in myocardial tissues. Tubulin was used as an internal reference (n = 3 per group). r, s WB and quantification of cardiac injury markers (cleaved-Caspase3 and cleaved-PARP1) in myocardial tissues. Tubulin was used as an internal reference (n = 3 per group). Data are presented as mean ± SD (f, h, j, l, o, q, s). Statistical significance was assessed by two-way ANOVA with Bonferroni multiple comparisons test (P values adjusted for 6 comparisons; ns, no significance; *P < 0.05; **P < 0.01; ***P < 0.001).
Fig. 3
Fig. 3. p300 is the acyltransferase for α-MHC K1897 lactylation.
ah H9c2 cells (a) or myocardial tissues (b) were lysed and immunoprecipitated using anti-p300 antibody or control IgG, followed by detection of α-MHC. H9c2 cells (c) and myocardial tissues (e) treated with or without p300 activator were lysed and immunoprecipitated using anti-α-MHC antibody or control IgG, followed by detection of α-MHC K1897 Lactyl Lysine. H9c2 cells (d) and myocardial tissues (f) treated with or without p300 inhibitor were lysed and immunoprecipitated using anti-α-MHC or control IgG, followed by detection of α-MHC K1897 Lactyl Lysine. H9c2 cells (g) and myocardial tissues (h) treated with or without Ang II were lysed and immunoprecipitated using anti-p300 antibody or control IgG, followed by detection of α-MHC. i Schematic of experimental intervention patterns (control, Ang II, p300 inhibitor, combination of Ang II and p300 inhibitor) in mice and H9c2 cells. jk H9c2 cells (j) and myocardial tissues (k) indicated in i were lysed and immunoprecipitated using anti-Titin antibody or control IgG, followed by detection of α-MHC. l Quantification of the interaction of α-MHC with Titin and the relative expression level of α-MHC K1897 Lactyl Lysine in k. Tubulin was used as an internal reference (n = 3 per group). m Schematic for experimental intervention patterns (control, Ang II, p300 activator, combination of Ang II and p300 activator) in mice and H9c2 cells. n, o H9c2 cells (n) and myocardial tissue (o) indicated in m were lysed and immunoprecipitated using anti-Titin antibody or control IgG, followed by detection of α-MHC. p Quantification of the interaction of α-MHC with Titin and the expression relative level of α-MHC K1897 Lactyl Lysine in o. Tubulin was used as an internal reference (n = 3 per group). Data are presented as mean ± SD (l, p). Statistical significance was assessed by two-way ANOVA with Bonferroni multiple comparisons test (P values adjusted for 6 comparisons; *P < 0.05; **P < 0.01; ***P < 0.001).
Fig. 4
Fig. 4. SIRT1 is the delactylase for α-MHC K1897.
ah H9c2 cells (a) or myocardial tissues (b) were lysed and immunoprecipitated using anti-SIRT1 antibody or control IgG, followed by detection of α-MHC. H9c2 cells (c) and myocardial tissues (e) treated with or without SIRT1 activator were lysed and immunoprecipitated using anti-α-MHC antibody or control IgG, followed by detection of α-MHC K1897 Lactyl Lysine. H9c2 cells (d) and myocardial tissues (f) treated with or without SIRT1 inhibitor were lysed and immunoprecipitated using anti-α-MHC or control IgG, followed by detection of α-MHC K1897 Lactyl Lysine. H9c2 cells (g) and myocardial tissue (h) treated with or without Ang II were lysed and immunoprecipitated using anti-SIRT1 antibody or control IgG, followed by detection of α-MHC. i Schematic of experimental intervention patterns (control, Ang II, SIRT1 activator, combination of Ang II and SIRT1 activator) in mice and H9c2 cells. j, H9c2 cells (j) and myocardial tissues (k) indicated in i were lysed and immunoprecipitated using anti-Titin or control IgG, followed by detection of α-MHC. l Quantification of the interaction of α-MHC with Titin and the relative expression level of α-MHC K1897 Lactyl Lysine in k. Tubulin was used as an internal reference (n = 3 per group). m Schematic of experimental intervention patterns (control, Ang II, SIRT1 inhibitor, combination of Ang II and SIRT1 inhibitor) in mice and H9c2 cells. n, o H9c2 cells (n) and myocardial tissues (o) indicated in m were lysed and immunoprecipitated using anti-Titin or control IgG, followed by detection of α-MHC. p Quantification of the interaction of α-MHC with Titin and the relative expression level of α-MHC K1897 Lactyl Lysine in o. Tubulin was used as an internal reference (n = 3 per group). Data are presented as mean ± SD (l, p). Statistical significance was assessed by two-way ANOVA with Bonferroni multiple comparisons test (P values adjusted for 6 comparisons; ns, no significance; *P < 0.05; **P < 0.01; ***P < 0.001).
Fig. 5
Fig. 5. Inhibition of LDHA activity reduces the lactate concentration and inhibits α-MHC K1897 lactylation.
a, b Relative content of intracellular (a) and extracellular (b) lactate in H9c2 cells after DSMO or LDHA inhibitor treatment (n = 10 per group). c H9c2 cells stimulated with or without LDHA inhibitor were lysed and immunoprecipitated using anti-α-MHC antibody or control IgG, followed by detection of α-MHC K1897 Lactyl Lysine. de Relative content of lactate in myocardial tissues (d) and serum (e) in mice after control or LDHA inhibitor treatment (n = 10 per group). fh Mouse myocardial tissues treated by LDHA inhibitor (f) or genetic (LDHA-cKO) manipulation (h) were lysed and immunoprecipitated using anti-α-MHC antibody or control IgG, followed by detection of α-MHC K1897 Lactyl Lysine. g Relative content of lactate in myocardial tissues in LDHA-cKO and LDHA cWT mice (n = 10 per group). i Schematic for experimental intervention patterns (control, Ang II, LDHA inhibitor, combination of Ang II and LDHA inhibitor) in mice and H9c2 cells. j, k Relative content of intracellular (j) and extracellular (k) lactate in cardiomyocytes after control, Ang II, LDHA inhibitor or combination of Ang II and LDHA inhibitor (n = 10 per group). l, m Relative content of lactate in myocardial tissues (l) and serum (m) in mice after the indicated treatments (n = 10 per group). n, o H9c2 cells (n) and myocardial tissues (o) treated with control, Ang II, LDHA inhibitor or combination of Ang II and LDHA inhibitor were lysed and immunoprecipitated using anti-Titin antibody or control IgG, followed by detection of α-MHC. p Quantification of the interaction of α-MHC with Titin and the relative expression level of α-MHC K1897 Lactyl Lysine in o. Tubulin was used as an internal reference (n = 3 per group). Data are represented as mean ± SD (a, b, d, e, g). Statistical significance was assessed by Student’s t-test (***P < 0.001). Data are presented as mean ± SD (jm, p). Statistical significance was assessed by two-way ANOVA with Bonferroni multiple comparisons test (P values adjusted for 6 comparisons; ns, no significance; *P < 0.05; **P < 0.01; ***P < 0.001).
Fig. 6
Fig. 6. LDHA-cKO mice decreases α-MHC K1897 lactylation and aggravates heart failure.
a Schematic for experimental intervention patterns in mice. Micro-osmotic pumps were used to deliver NaCl or Ang II subcutaneously to LDHA-cKO and LDHA-cWT mice. b WB assay assessed LDHA expression levels in myocardial tissues from LDHA-cWT and LDHA-cKO mice after NaCl or Ang II treatment. c Quantification analysis of LDHA expression. d Mouse myocardial tissues indicated in a were lysed and immunoprecipitated using anti-Pan kla antibody or control IgG, followed by detection of α-MHC. e Mouse myocardial tissues indicated in a were lysed and immunoprecipitated using anti-α-MHC antibody or control IgG, followed by detection of α-MHC K1897 Lactyl Lysine. f Mouse myocardial tissues indicated in a were lysed and immunoprecipitated using anti-Titin antibody or control IgG, followed by detection of α-MHC. g Quantification of the interaction between α-MHC and Titin. Tubulin was used as an internal reference (n = 3 per group). h Representative M-mode echocardiogram of LDHA-cWT and LDHA-cKO mice after NaCl or Ang II treatment. i Cardiac function was evaluated by EF (n = 10 per group). j Masson staining to detect myocardial fibrosis. k Quantification of the fibrotic area (n = 10 per group). l Transmission electron microscope photos of heart tissue ultrastructure in LDHA-cWT and cKO mice after NaCl or Ang II treatment. The yellow dotted border lines indicate the normal sarcomere structure, and the red dotted border lines indicate the damaged sarcomere structure. The arrowheads indicate Z disk in myocardial tissues. m Representative heart sections stained with H&E (top) and WGA (bottom) to detect the presence of hypertrophy in cardiac myocytes. n Quantification of relative cardiomyocyte cross-sectional area (n = 10 per group). o, p WB and quantification of fibrosis marker (α-SMA, Col-1) levels in myocardial tissues. Tubulin was used as an internal reference (n = 3 per group). q, r WB and quantification of cardiac injury marker (cleaved-Caspase3 and cleaved-PARP1) levels in myocardial tissues. Tubulin was used as an internal reference (n = 3 per group). Data are presented as mean ± SD (c, g, i, k, n, p, r). Statistical significance was assessed by two-way ANOVA with Bonferroni multiple comparisons test (P values adjusted for 6 comparisons; ns, no significance; *P < 0.05; **P < 0.01; ***P < 0.001).
Fig. 7
Fig. 7. NALA increases lactylation of α-MHC K1897 and prevents heart failure.
a Schematic for experimental intervention patterns (control/Ang II/NALA/ combination of Ang II and NALA) in mice. bc Relative content of lactate in myocardial tissues (b) and serum (c) in mice after the indicated treatments (n = 10 per group). d Mouse myocardial tissues treated with or without NALA were lysed and immunoprecipitated using anti-α-MHC antibody or control IgG, followed by detection of α-MHC K1897 Lactyl Lysine. e Mouse myocardial tissues indicated in a were lysed and immunoprecipitated using anti-Titin antibody or control IgG, followed by detection of α-MHC. f Quantification of the interaction between α-MHC and Titin. Tubulin was used as an internal reference (n = 3 per group). g Representative M-mode echocardiogram of mice after the indicated treatments. h Cardiac function was evaluated by EF (n = 10 per group). i Masson staining was used to show myocardial fibrosis. j Quantification of the fibrotic area (n = 10 per group). k Representative heart sections stained with H&E (top) and WGA (bottom) to detect the presence of hypertrophy in cardiac myocytes. l Quantification of relative cardiomyocyte cross-sectional area (n = 10 per group). m, n WB and quantification of fibrosis marker (α-SMA, Col-1) levels in myocardial tissues. Tubulin was used as an internal reference (n = 3 per group). o, p WB and quantification of cardiac injury marker (cleaved-Caspase3 and cleaved-PARP1) levels in myocardial tissues. Tubulin was used as an internal reference (n = 3 per group). Data are presented as mean ± SD (b, c, f, h, j, l, n, p). Statistical significance was assessed by two-way ANOVA with Bonferroni multiple comparisons test (P values adjusted for 6 comparisons; ns, no significance; *P < 0.05; **P < 0.01; ***P < 0.001).
Fig. 8
Fig. 8. The α-MHC K1897R mutant partially abolishes the protective effect of NALA against Ang II-induced heart failure.
a Schematic for experimental intervention patterns. α-MHC WT mice were given control treatment or Ang II infusion. α-MHC K1897R KI mice were given control treatment/Ang II infusion/NALA infusion/combined Ang II and NALA infusion. b Relative content of myocardial tissue lactate in mice after the indicated treatment (n = 10 per group). c, d Representative WB and quantification of α-MHC K1897 Lactyl Lysine in myocardial tissues from mice after the indicated treatment. Tubulin was used as an internal reference (n = 3 per group). e, f Immunoprecipitation using anti-Titin antibody or control IgG (e), followed by detection of α-MHC. Quantification of the interaction of α-MHC with Titin (f). Tubulin was used as an internal reference (n = 3 per group). g Representative M-mode echocardiogram of mice after the indicated treatment. h Cardiac function was evaluated by EF (n = 10 per group). i Masson staining to detect myocardial fibrosis. j Quantification of the fibrotic area (n = 10 per group). k Representative heart sections stained with H&E (top) and WGA (bottom) to detect the presence of hypertrophy in cardiomyocytes. l Quantitation of relative cardiomyocyte cross-sectional area (n = 10 per group). m, n WB and quantification of fibrosis marker (α-SMA, Col-1) levels in myocardial tissues. Tubulin was used as an internal reference (n = 4 per group). o, p WB and quantification of cardiac injury indicator (cleaved-Caspase3 and cleaved-PARP1) levels in myocardial tissue, Tubulin was used as an internal reference (n = 4 per group). b, d, f, h, j, l, n, p Statistical significance was assessed by two-way ANOVA with Bonferroni multiple comparisons test (P values adjusted for 10 comparisons; ns no significance; *P < 0.05; **P < 0.01; ***P < 0.001).
Fig. 9
Fig. 9. MCT4 inhibitor VB124 increases α-MHC K1897 lactylation and prevents heart failure, and the α-MHC K1897R mutation partially abolishes the protective effect of VB124 against Ang II-induced heart failure.
a Schematic diagram for experimental intervention patterns. α-MHC WT and α-MHC K1897R KI mice were given control treatment, Ang II infusion or combined Ang II and VB124 infusion for 2 weeks. b, c Representative WB image and quantification of α-MHC K1897 Lactyl Lysine in myocardial tissue from mice after the indicated treatments. Tubulin was used as an internal reference (n = 3 per group). d, e Immunoprecipitation using anti-Titin antibody or control IgG followed by detection of α-MHC (d). Quantification of the interaction of α-MHC with Titin (e). Tubulin was used as an internal reference (n = 3 per group). f Representative mouse M-mode echocardiogram after the indicated treatment. g Cardiac function was evaluated by EF (n = 10 per group). h Masson staining to detect myocardial fibrosis. i Quantification of the fibrotic area (n = 10 per group). j Representative heart sections stained with H&E (top) and WGA (bottom) to detect the presence of hypertrophy in cardiac myocytes. k Quantitation of relative cardiomyocyte cross-sectional area (n = 10 per group). l, m WB and quantification of fibrosis marker (α-SMA, Col-1) levels in myocardial tissues. Tubulin was used as an internal reference (n = 4 per group). n, o WB and quantification of cardiac injury indicator (cleaved-Caspase3 and cleaved-PARP1) levels in myocardial tissues. Tubulin was used as an internal reference (n = 4 per group). c, e, g, i, k, m, o Statistical significance was assessed by two-way ANOVA with Bonferroni multiple comparisons test (P values adjusted for 10 comparisons, *P < 0.05; **P < 0.01; ***P < 0.001).
Fig. 10
Fig. 10. Schematic diagram showing the proposed mechanistic model of α-MHC lactylation.
Under the physiological state, α-MHC lactylation reserves the interaction of α-MHC with Titin and maintains sarcomeric structure and function. Upon pathological stress stimulation, a decrease in the lactate concentration in cardiomyocytes leads to reduction of α-MHC lactylation and α-MHC–Titin interaction, thus impairing cardiac structure and function. Upregulation of the lactate concentration by administering sodium lactate or inhibiting MCT4 in cardiomyocytes can promote α-MHC lactylation and α-MHC–Titin interaction, thereby alleviating heart failure.

Comment in

  • Lactylation regulates cardiac function.
    Ghosh-Choudhary S, Finkel T. Ghosh-Choudhary S, et al. Cell Res. 2023 Sep;33(9):653-654. doi: 10.1038/s41422-023-00857-5. Cell Res. 2023. PMID: 37488305 Free PMC article. No abstract available.

Similar articles

Cited by

References

    1. Lehman SJ, Crocini C, Leinwand LA. Targeting the sarcomere in inherited cardiomyopathies. Nat. Rev. Cardiol. 2022;19:353–363. doi: 10.1038/s41569-022-00682-0. - DOI - PMC - PubMed
    1. Lyon RC, Zanella F, Omens JH, Sheikh F. Mechanotransduction in cardiac hypertrophy and failure. Circ. Res. 2015;116:1462–1476. doi: 10.1161/CIRCRESAHA.116.304937. - DOI - PMC - PubMed
    1. Henderson CA, Gomez CG, Novak SM, Mi-Mi L, Gregorio CC. Overview of the muscle cytoskeleton. Compr. Physiol. 2017;7:891–944. doi: 10.1002/cphy.c160033. - DOI - PMC - PubMed
    1. Wang Z, et al. Structures from intact myofibrils reveal mechanism of thin filament regulation through nebulin. Science. 2022;375:eabn1934. doi: 10.1126/science.abn1934. - DOI - PubMed
    1. Isaacs WB, Kim IS, Struve A, Fulton AB. Association of titin and myosin heavy chain in developing skeletal muscle. Proc. Natl. Acad. Sci. USA. 1992;89:7496–7500. doi: 10.1073/pnas.89.16.7496. - DOI - PMC - PubMed

Publication types