. 2023 Aug;8(8):1587-1599.
doi: 10.1038/s41564-023-01431-w. Epub 2023 Jul 13.

LY6E is a pan-coronavirus restriction factor in the respiratory tract

Affiliations

LY6E is a pan-coronavirus restriction factor in the respiratory tract

Katrina B Mar et al. Nat Microbiol. 2023 Aug.

Abstract

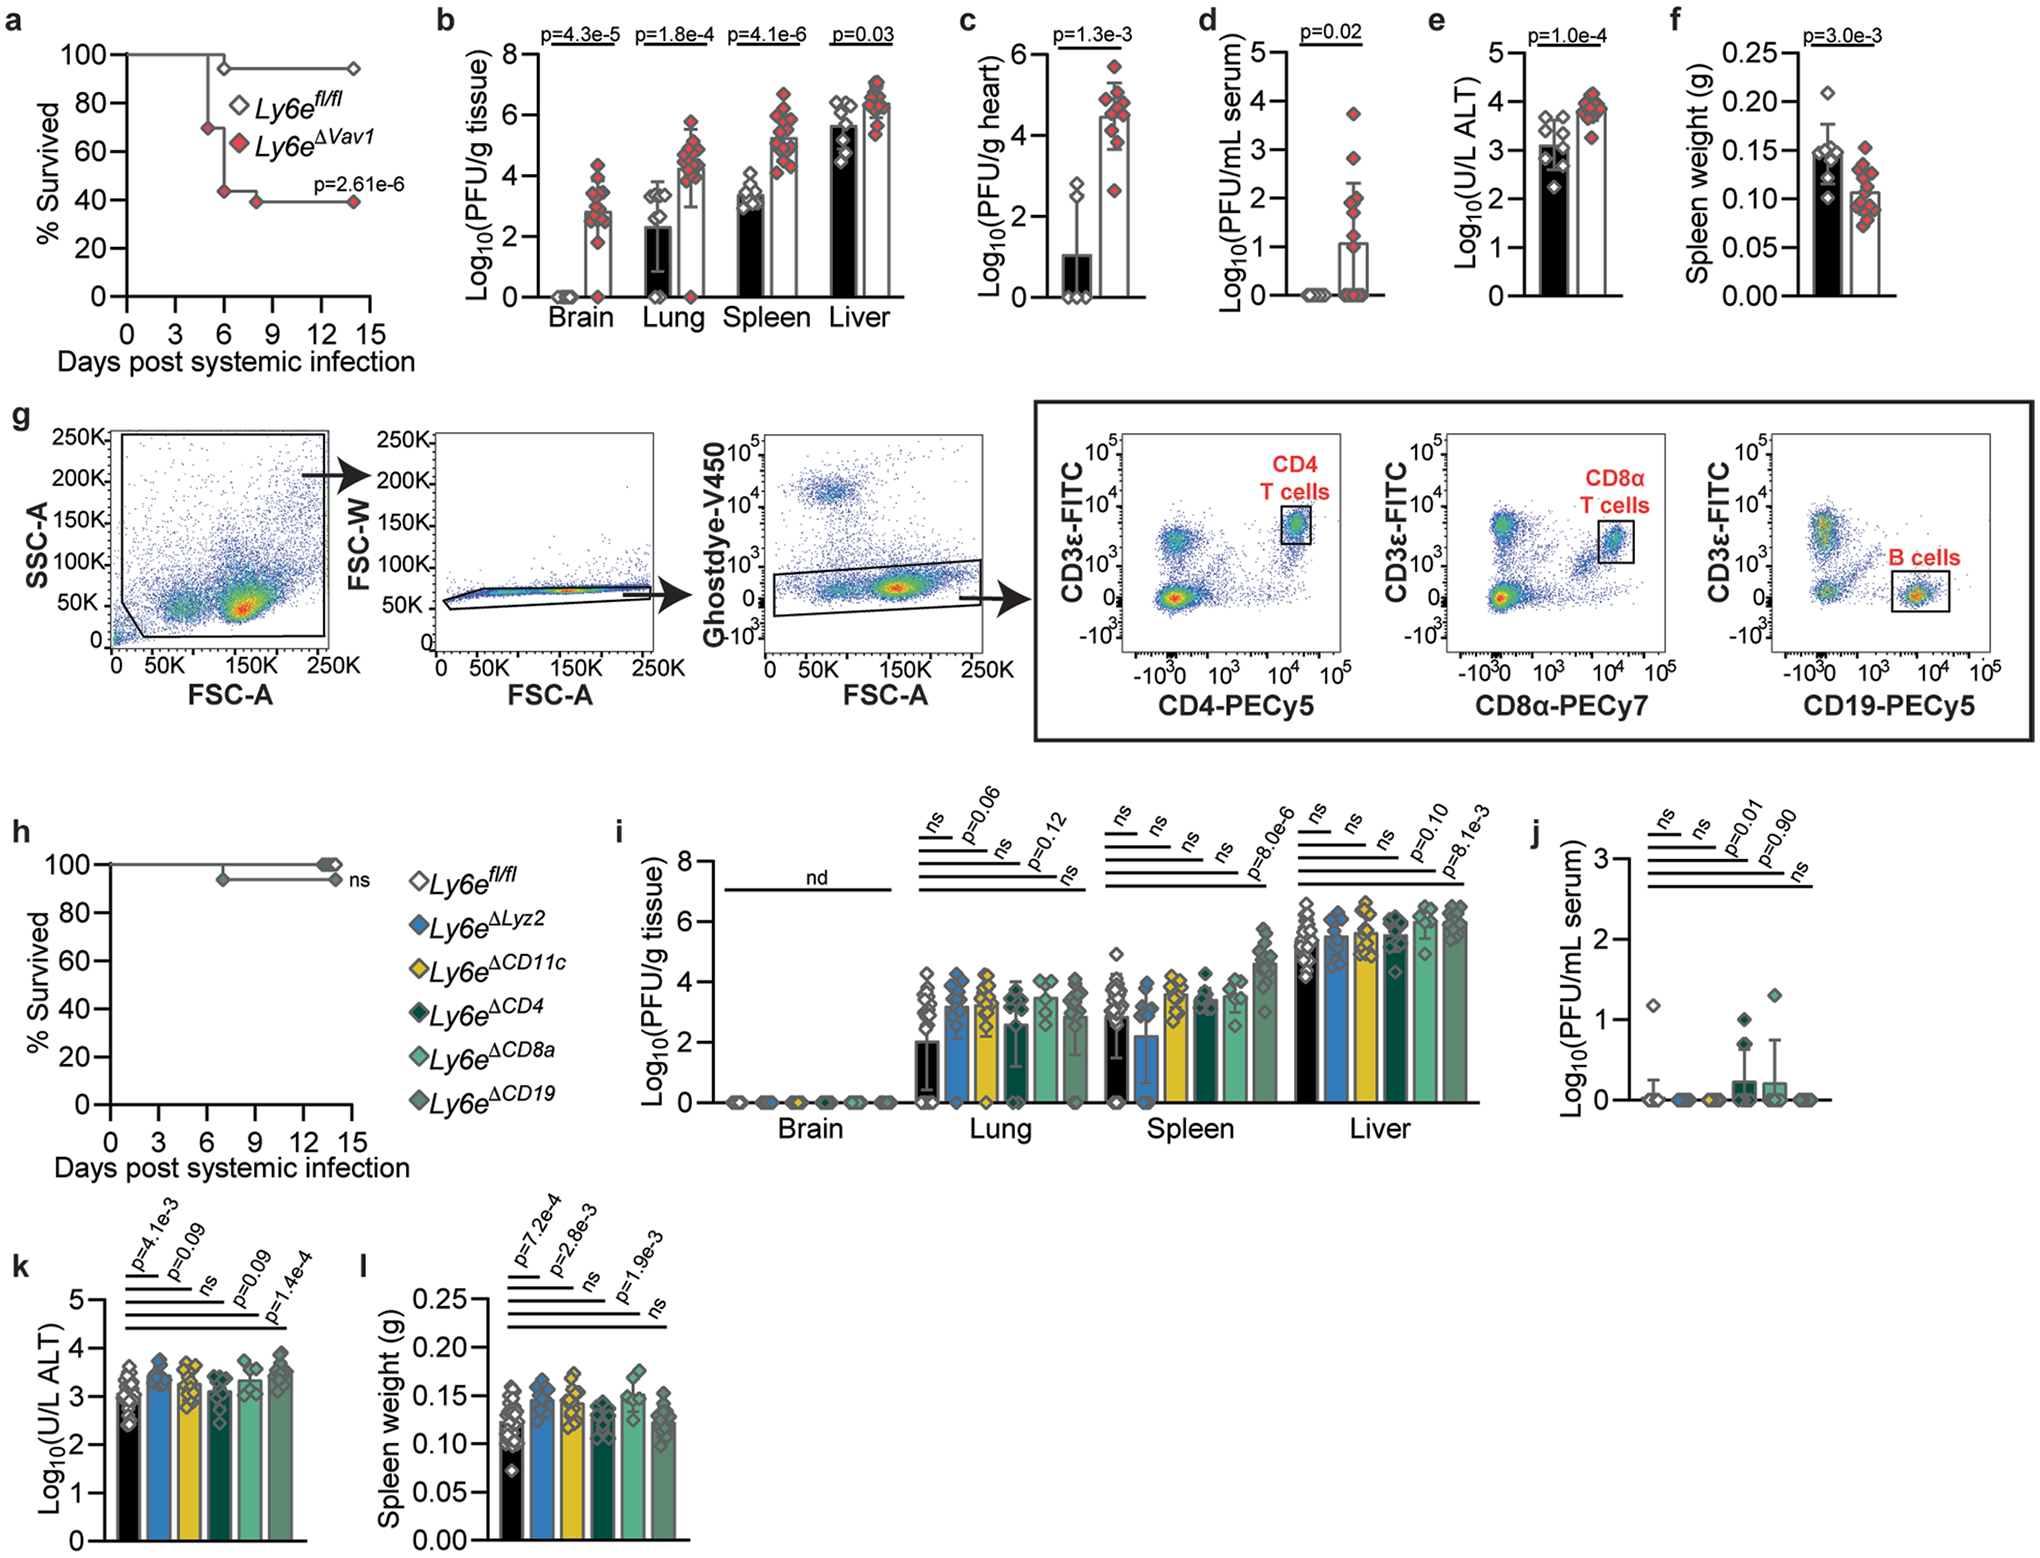
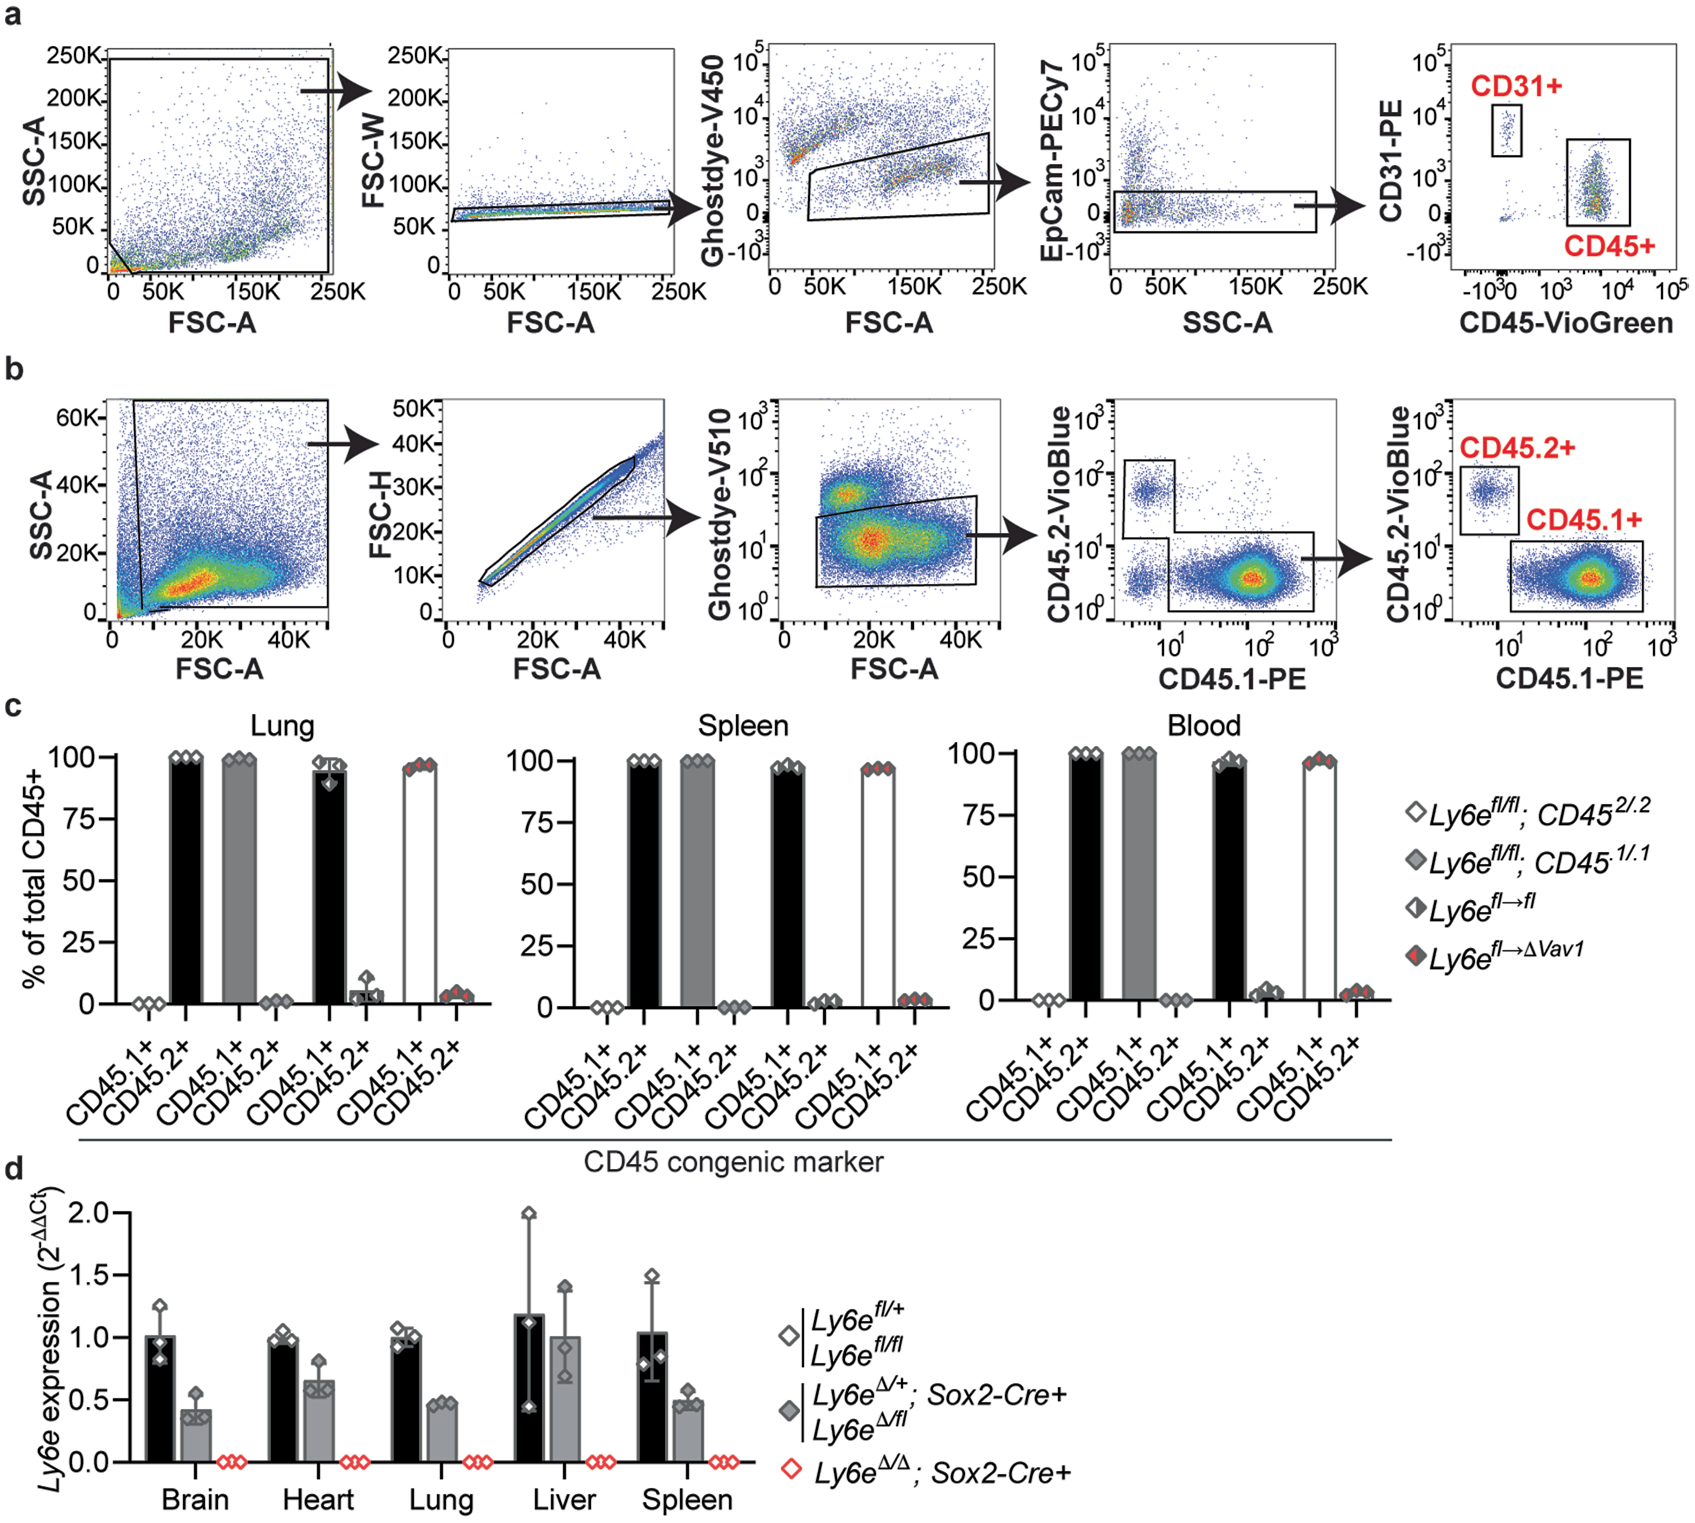
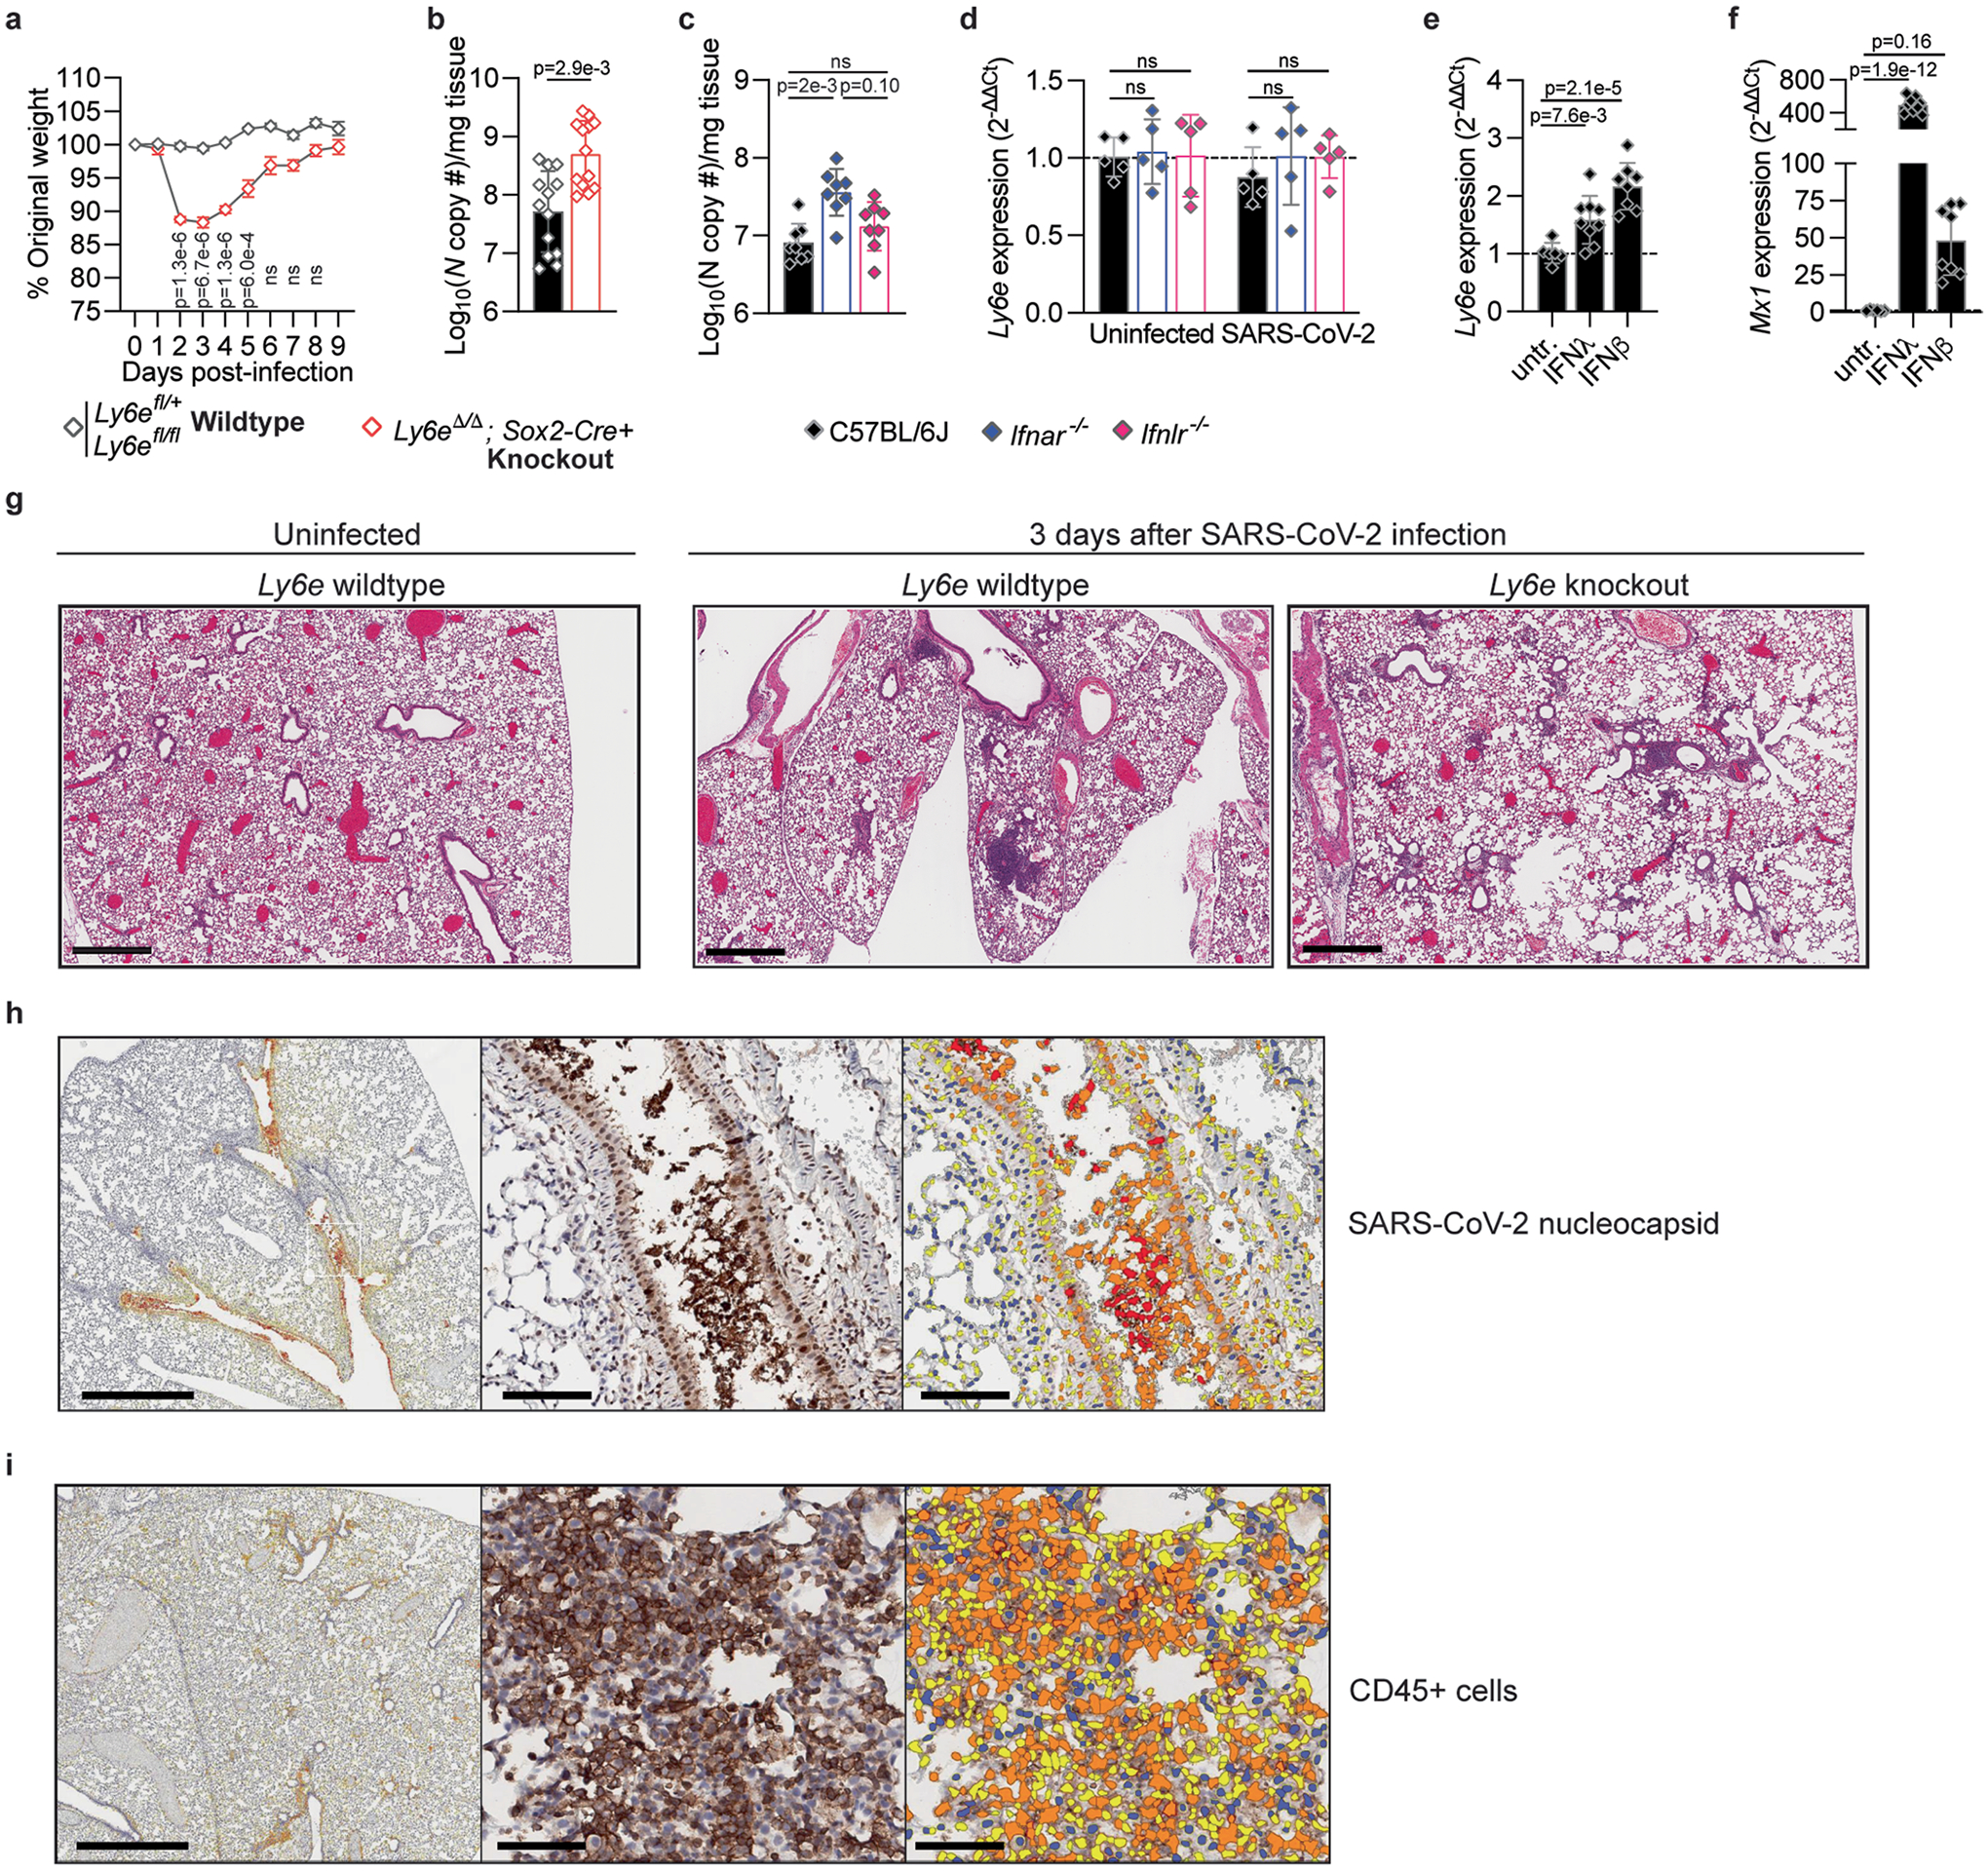
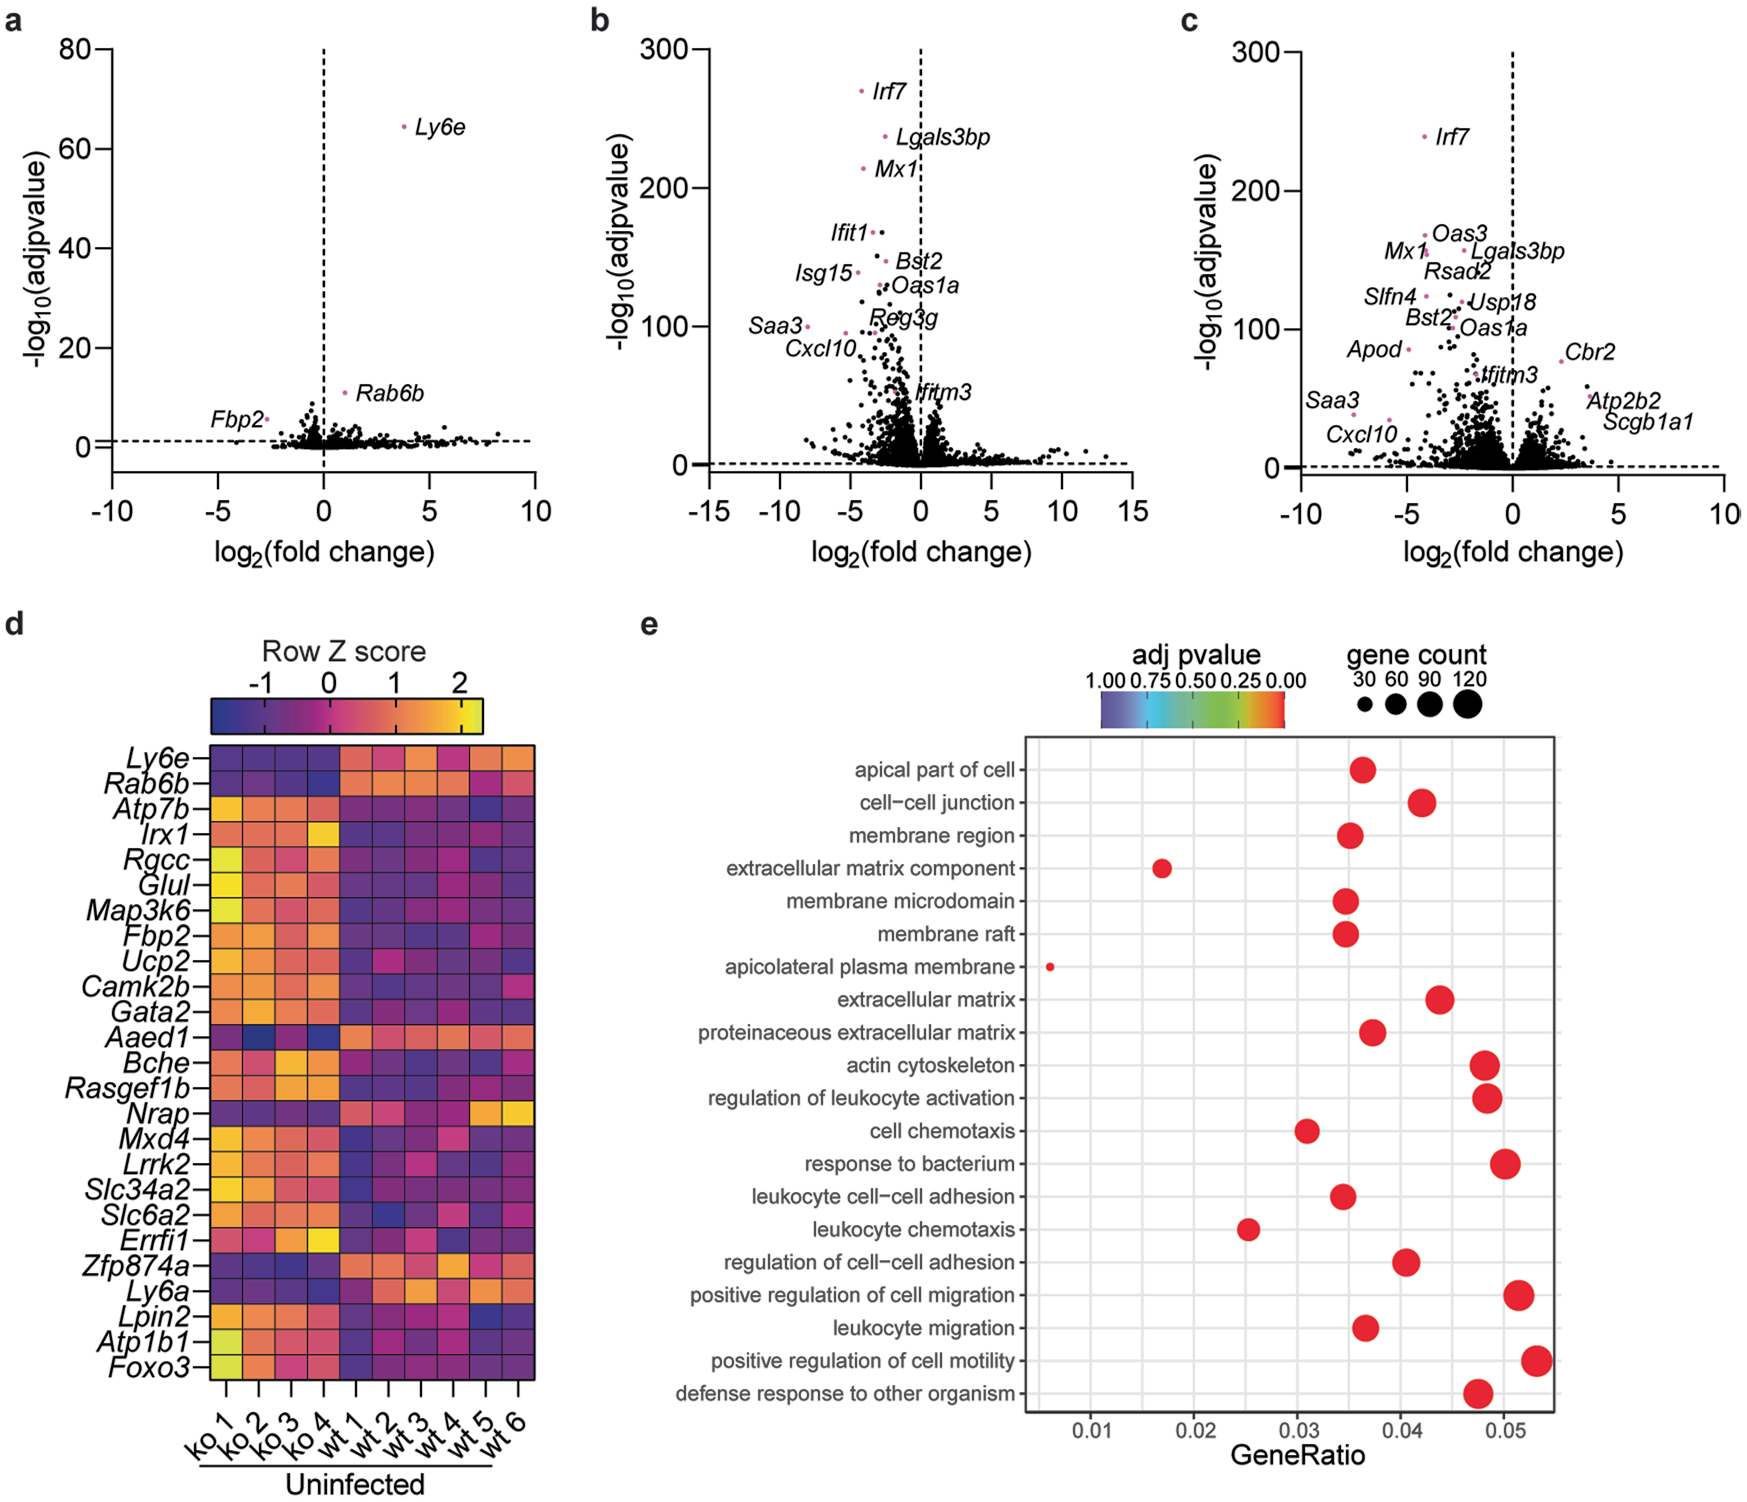
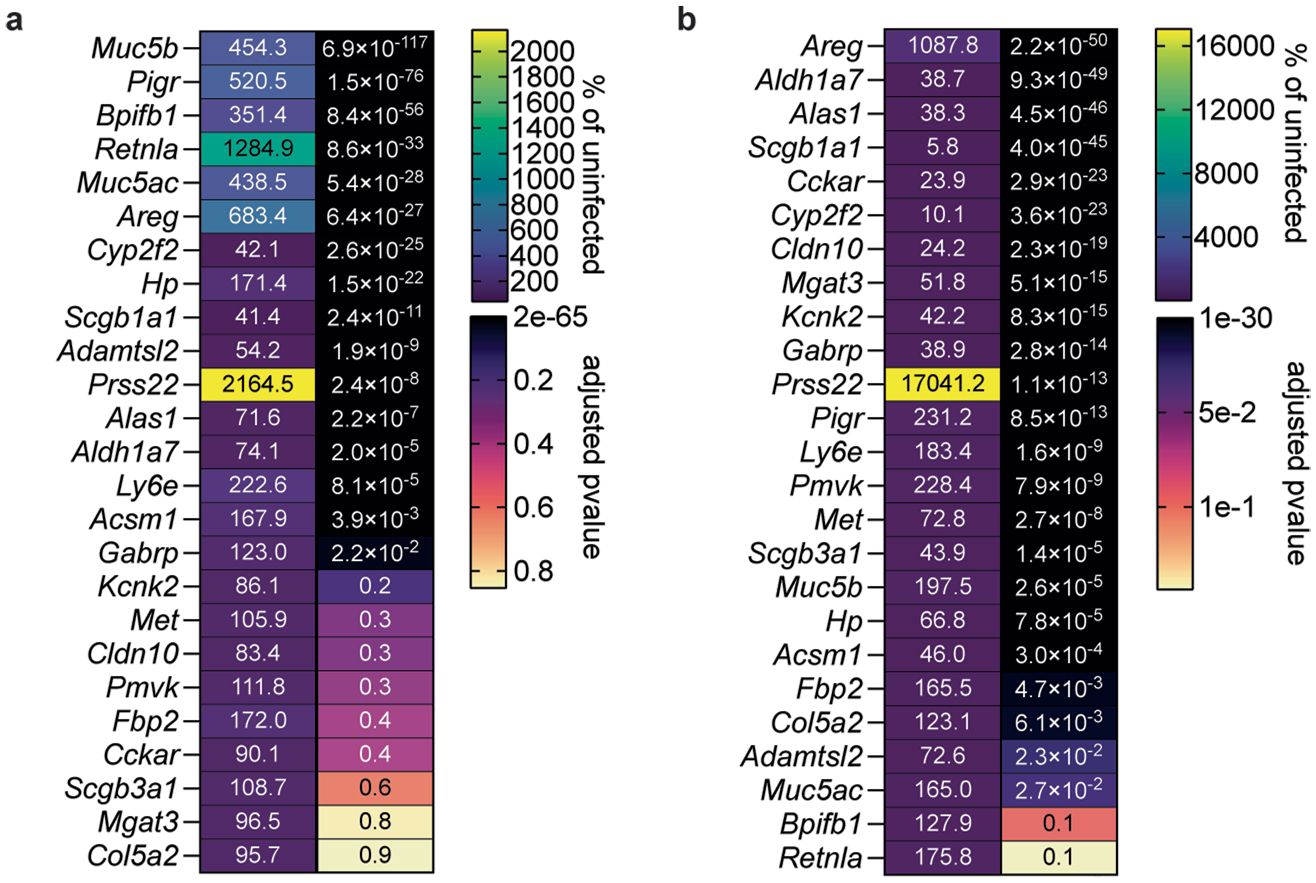
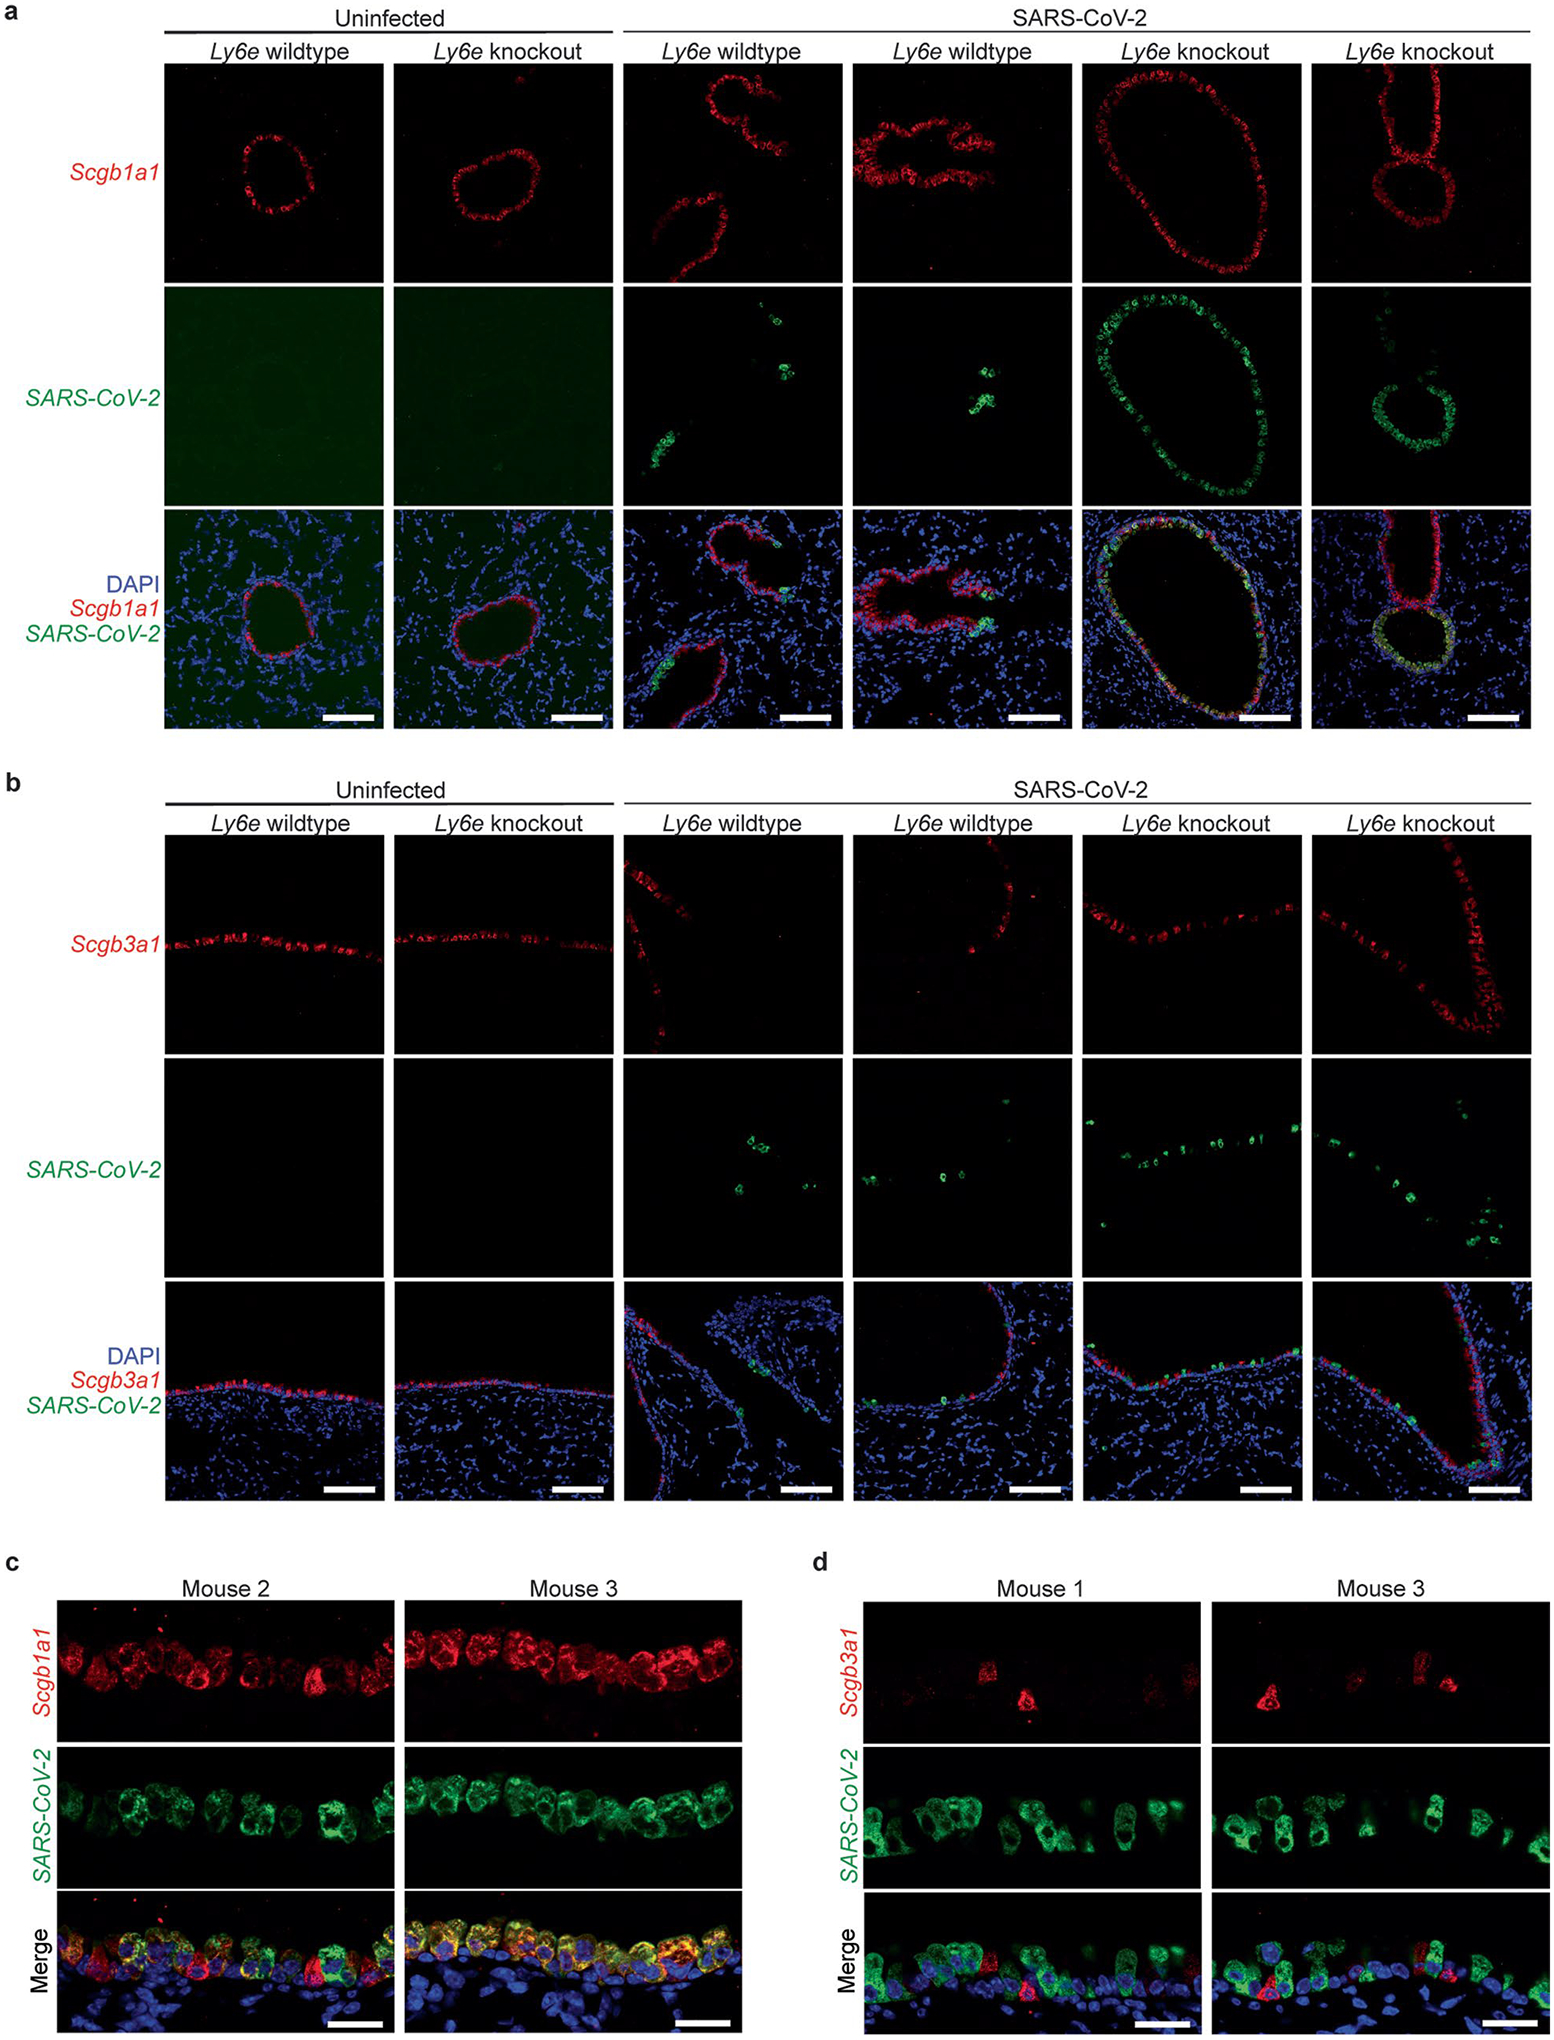
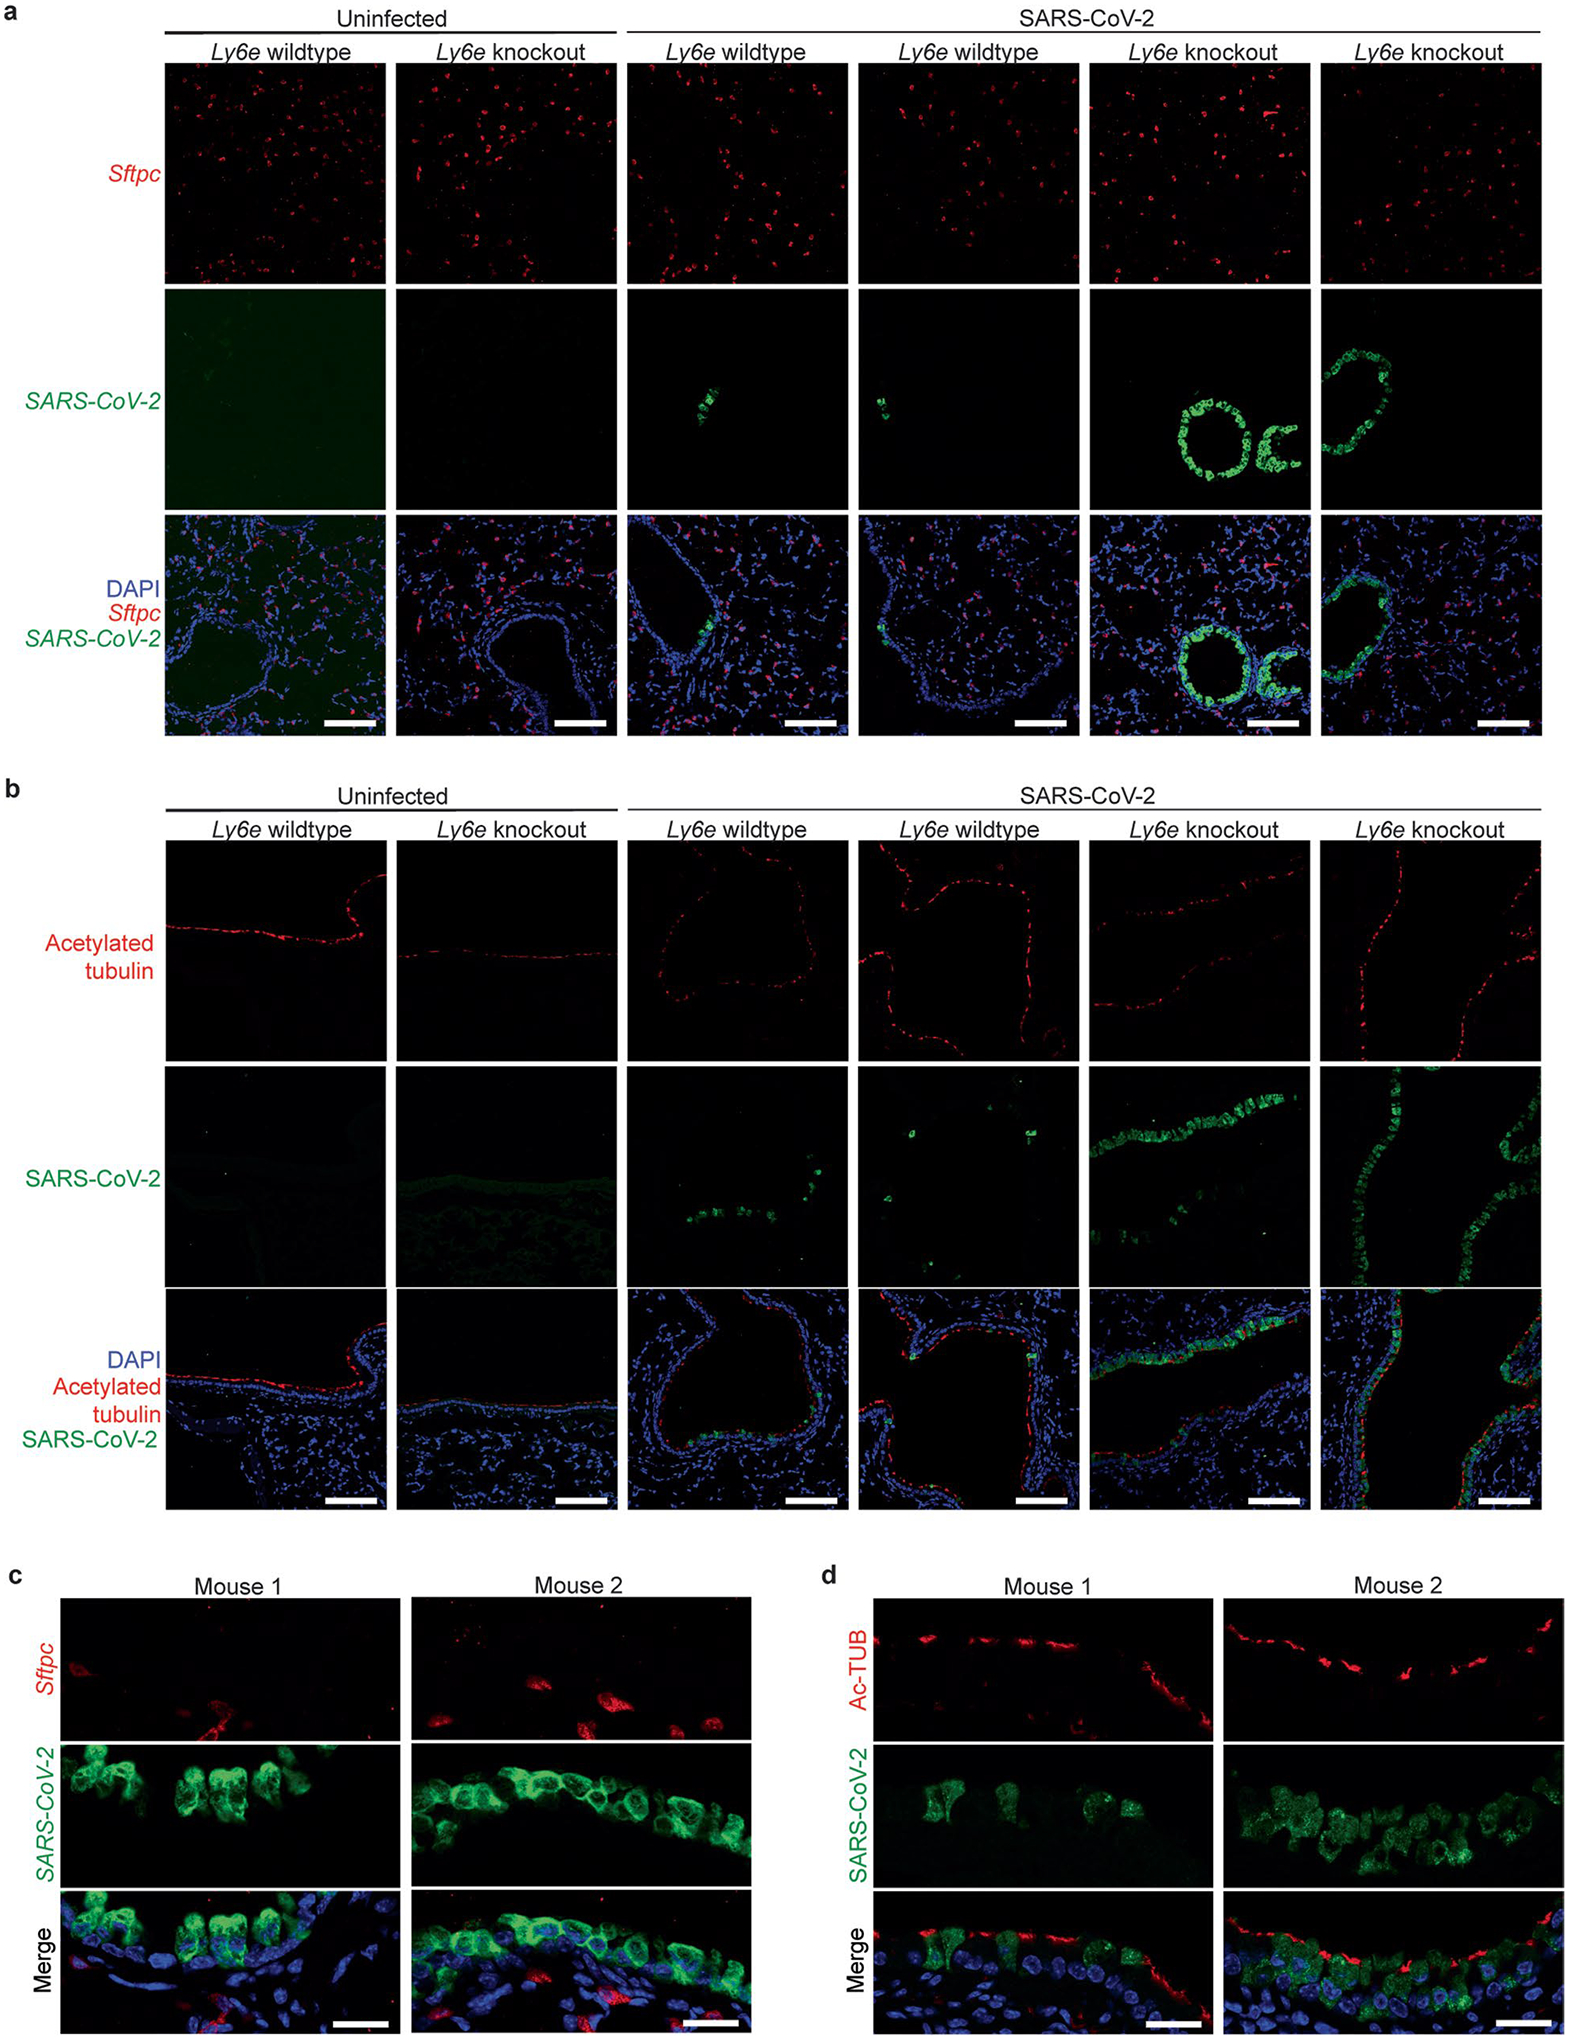
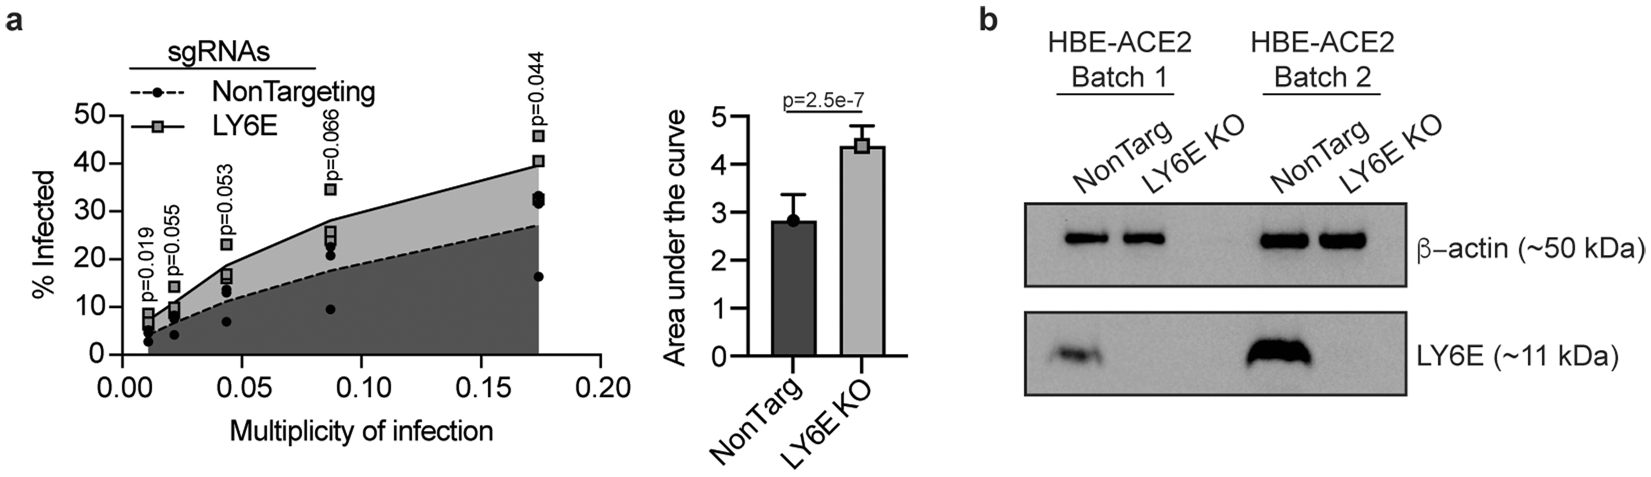
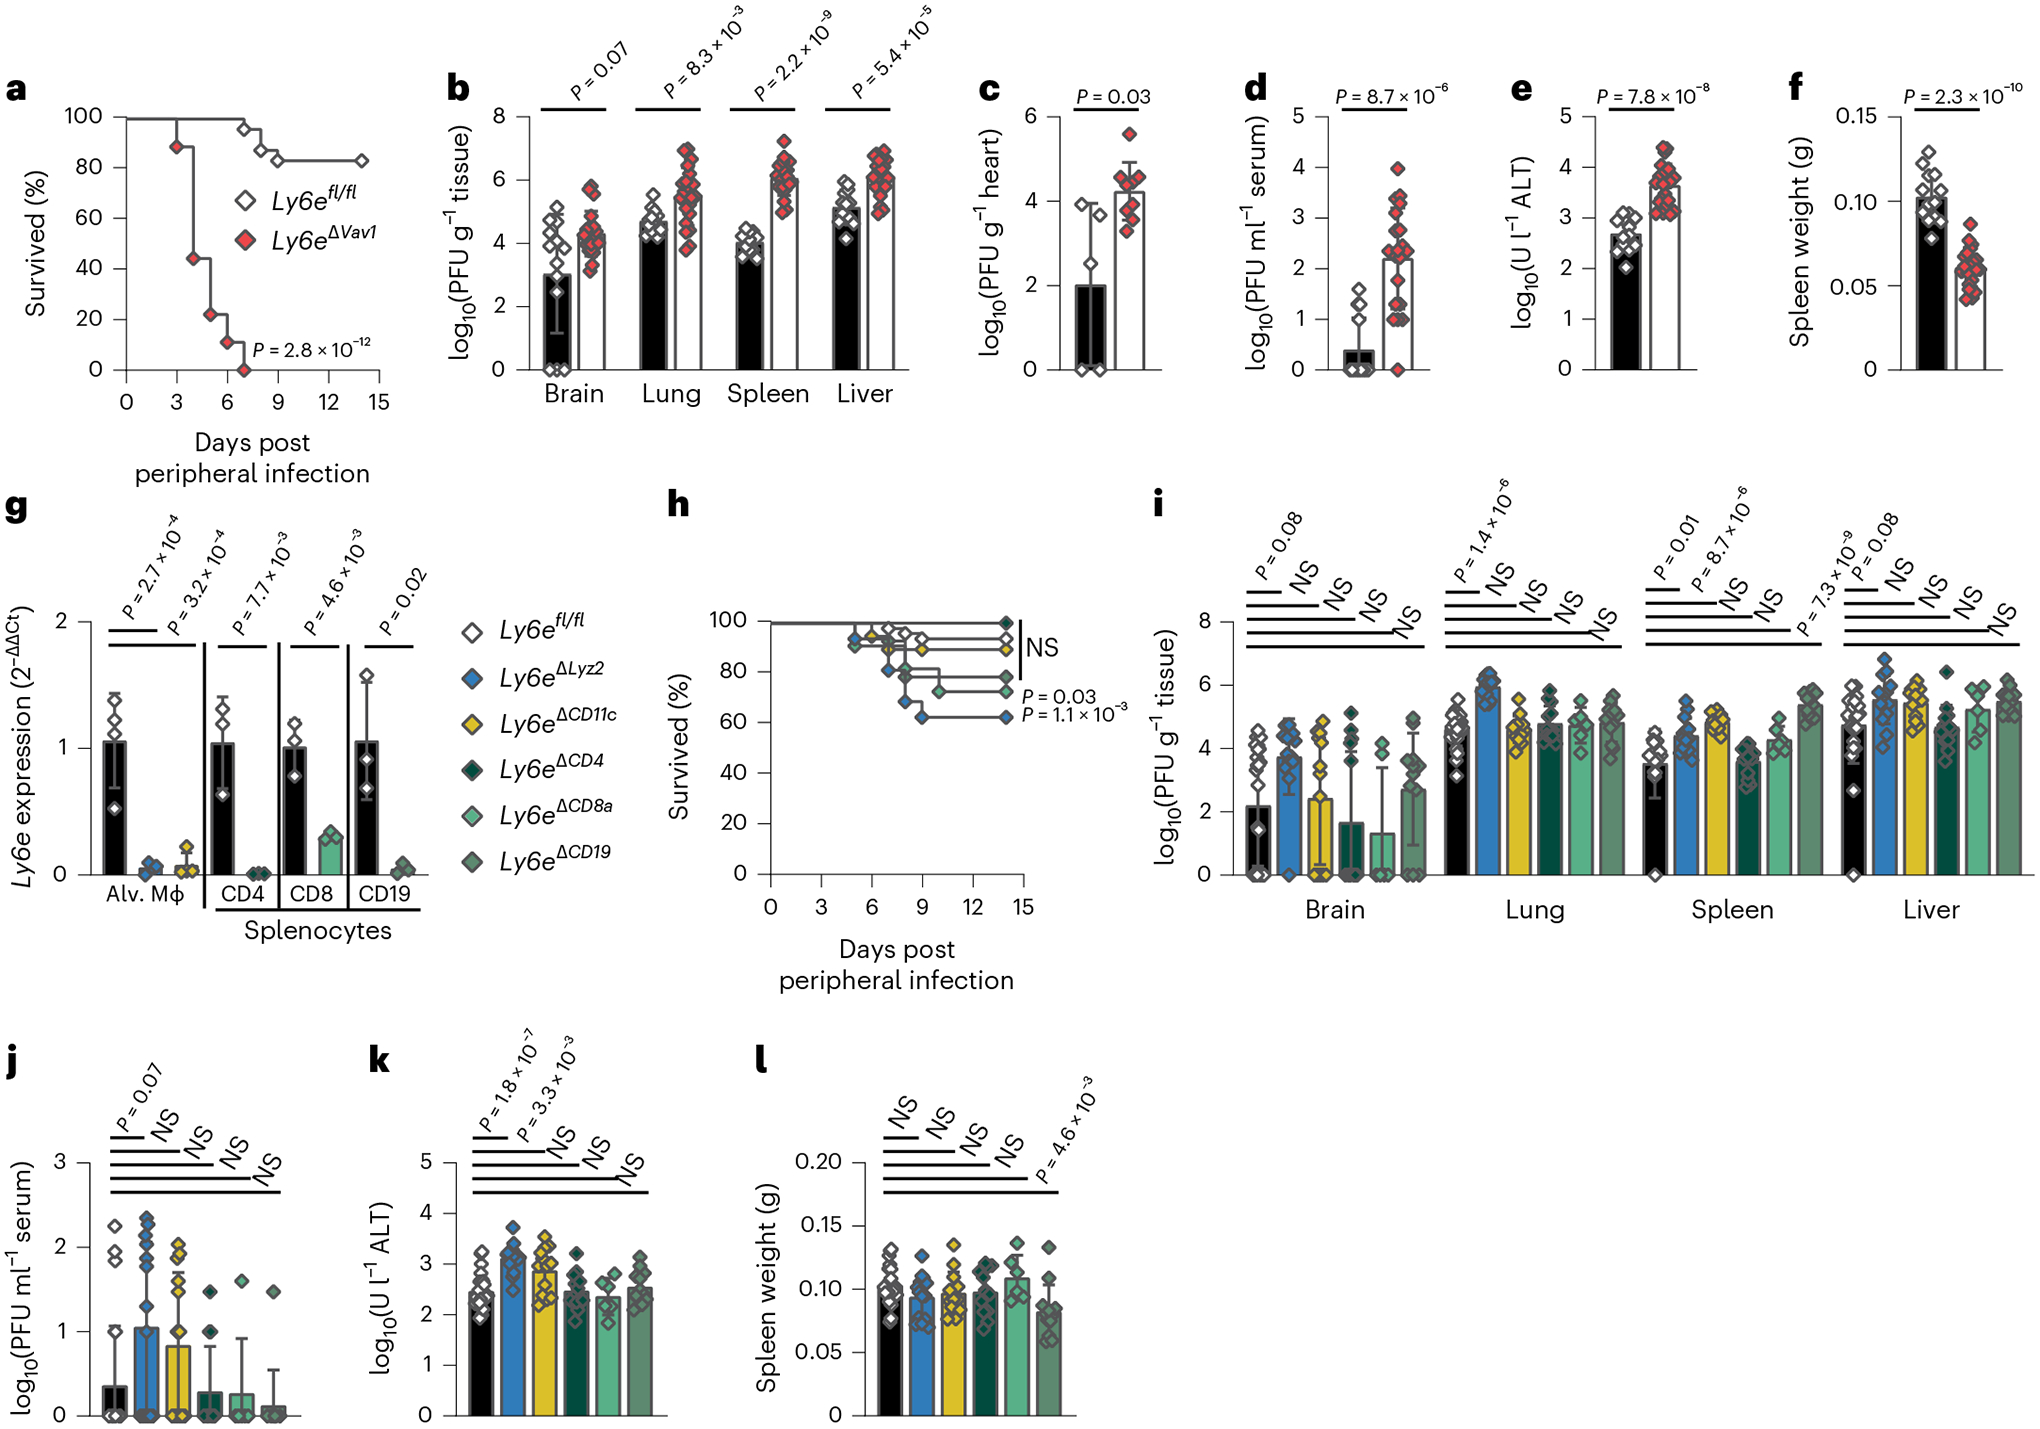
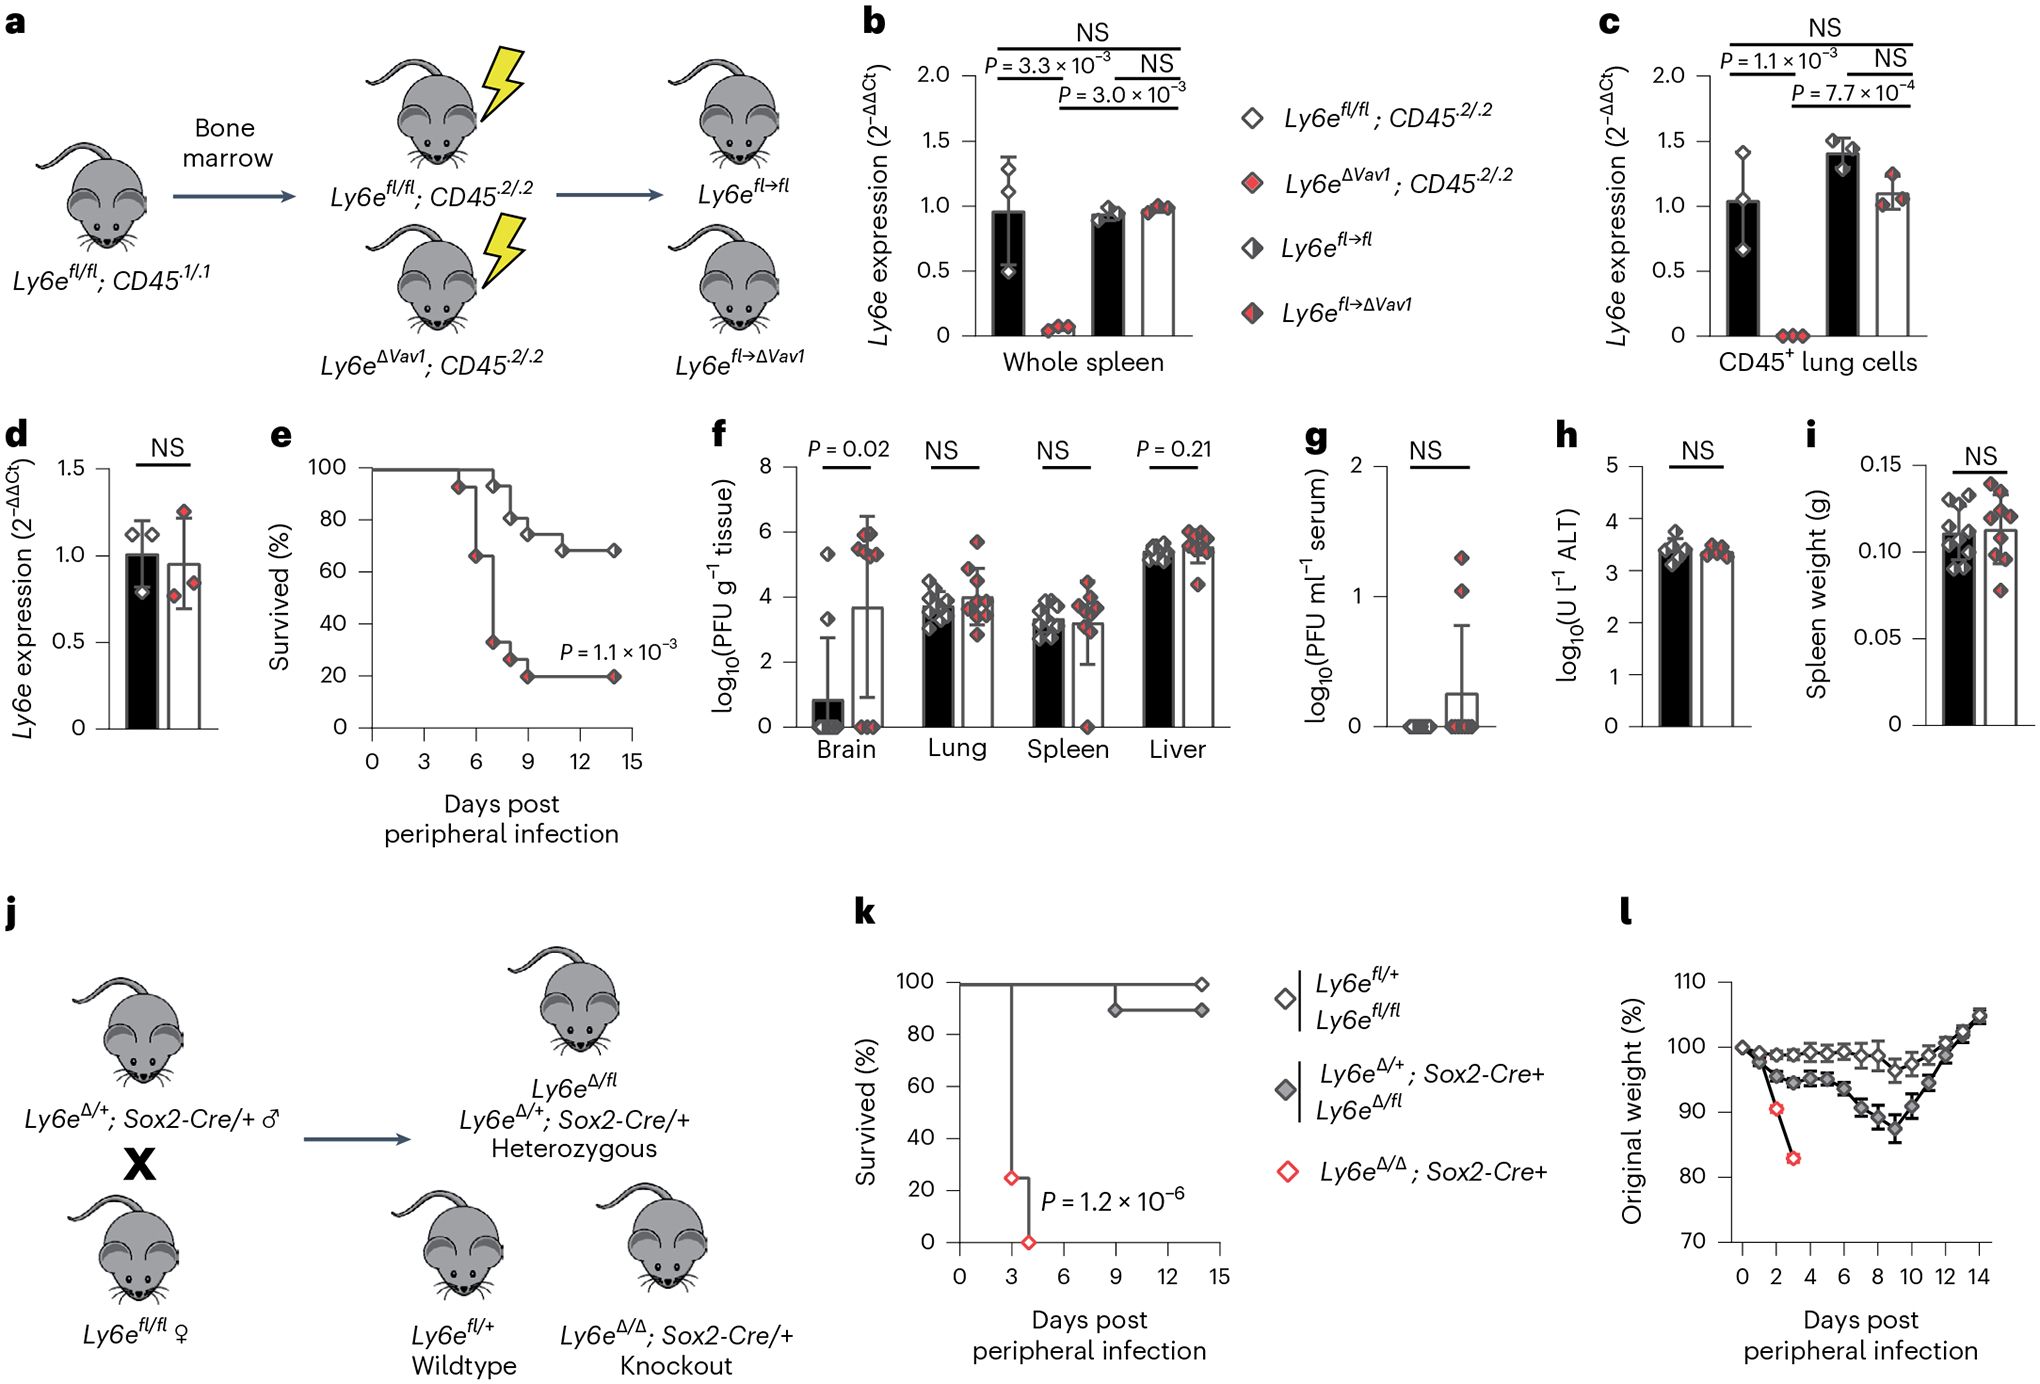
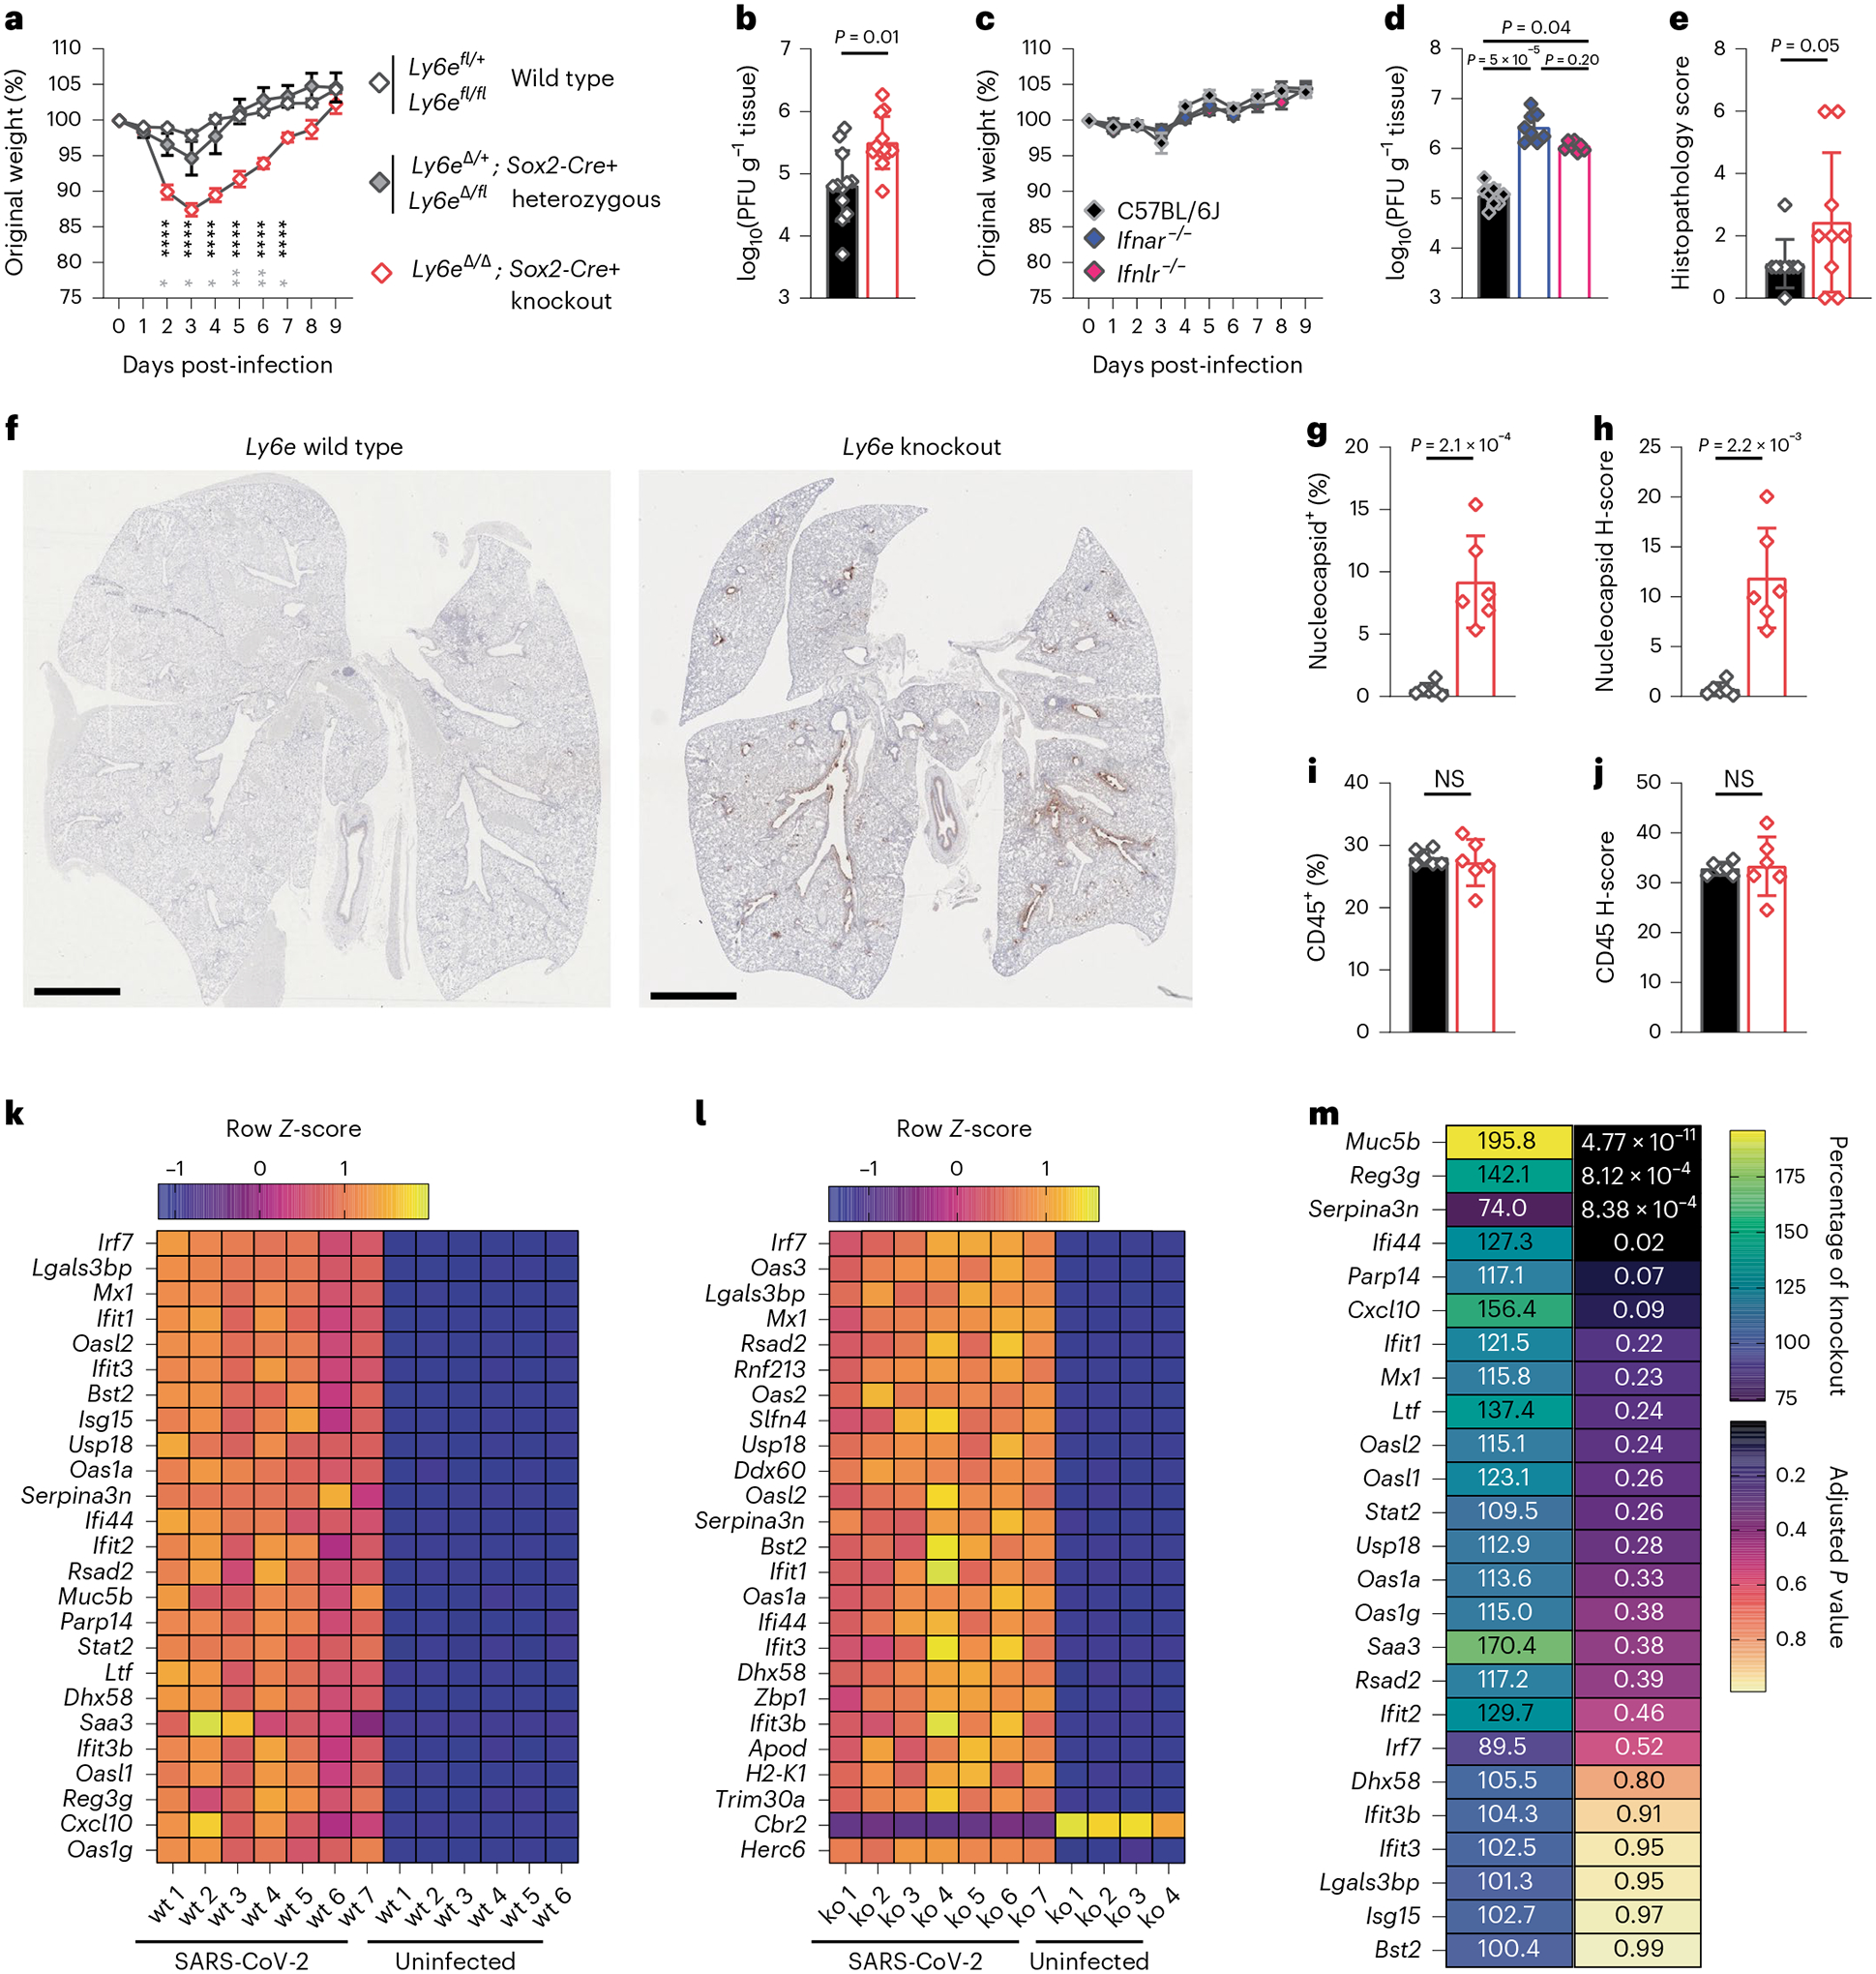
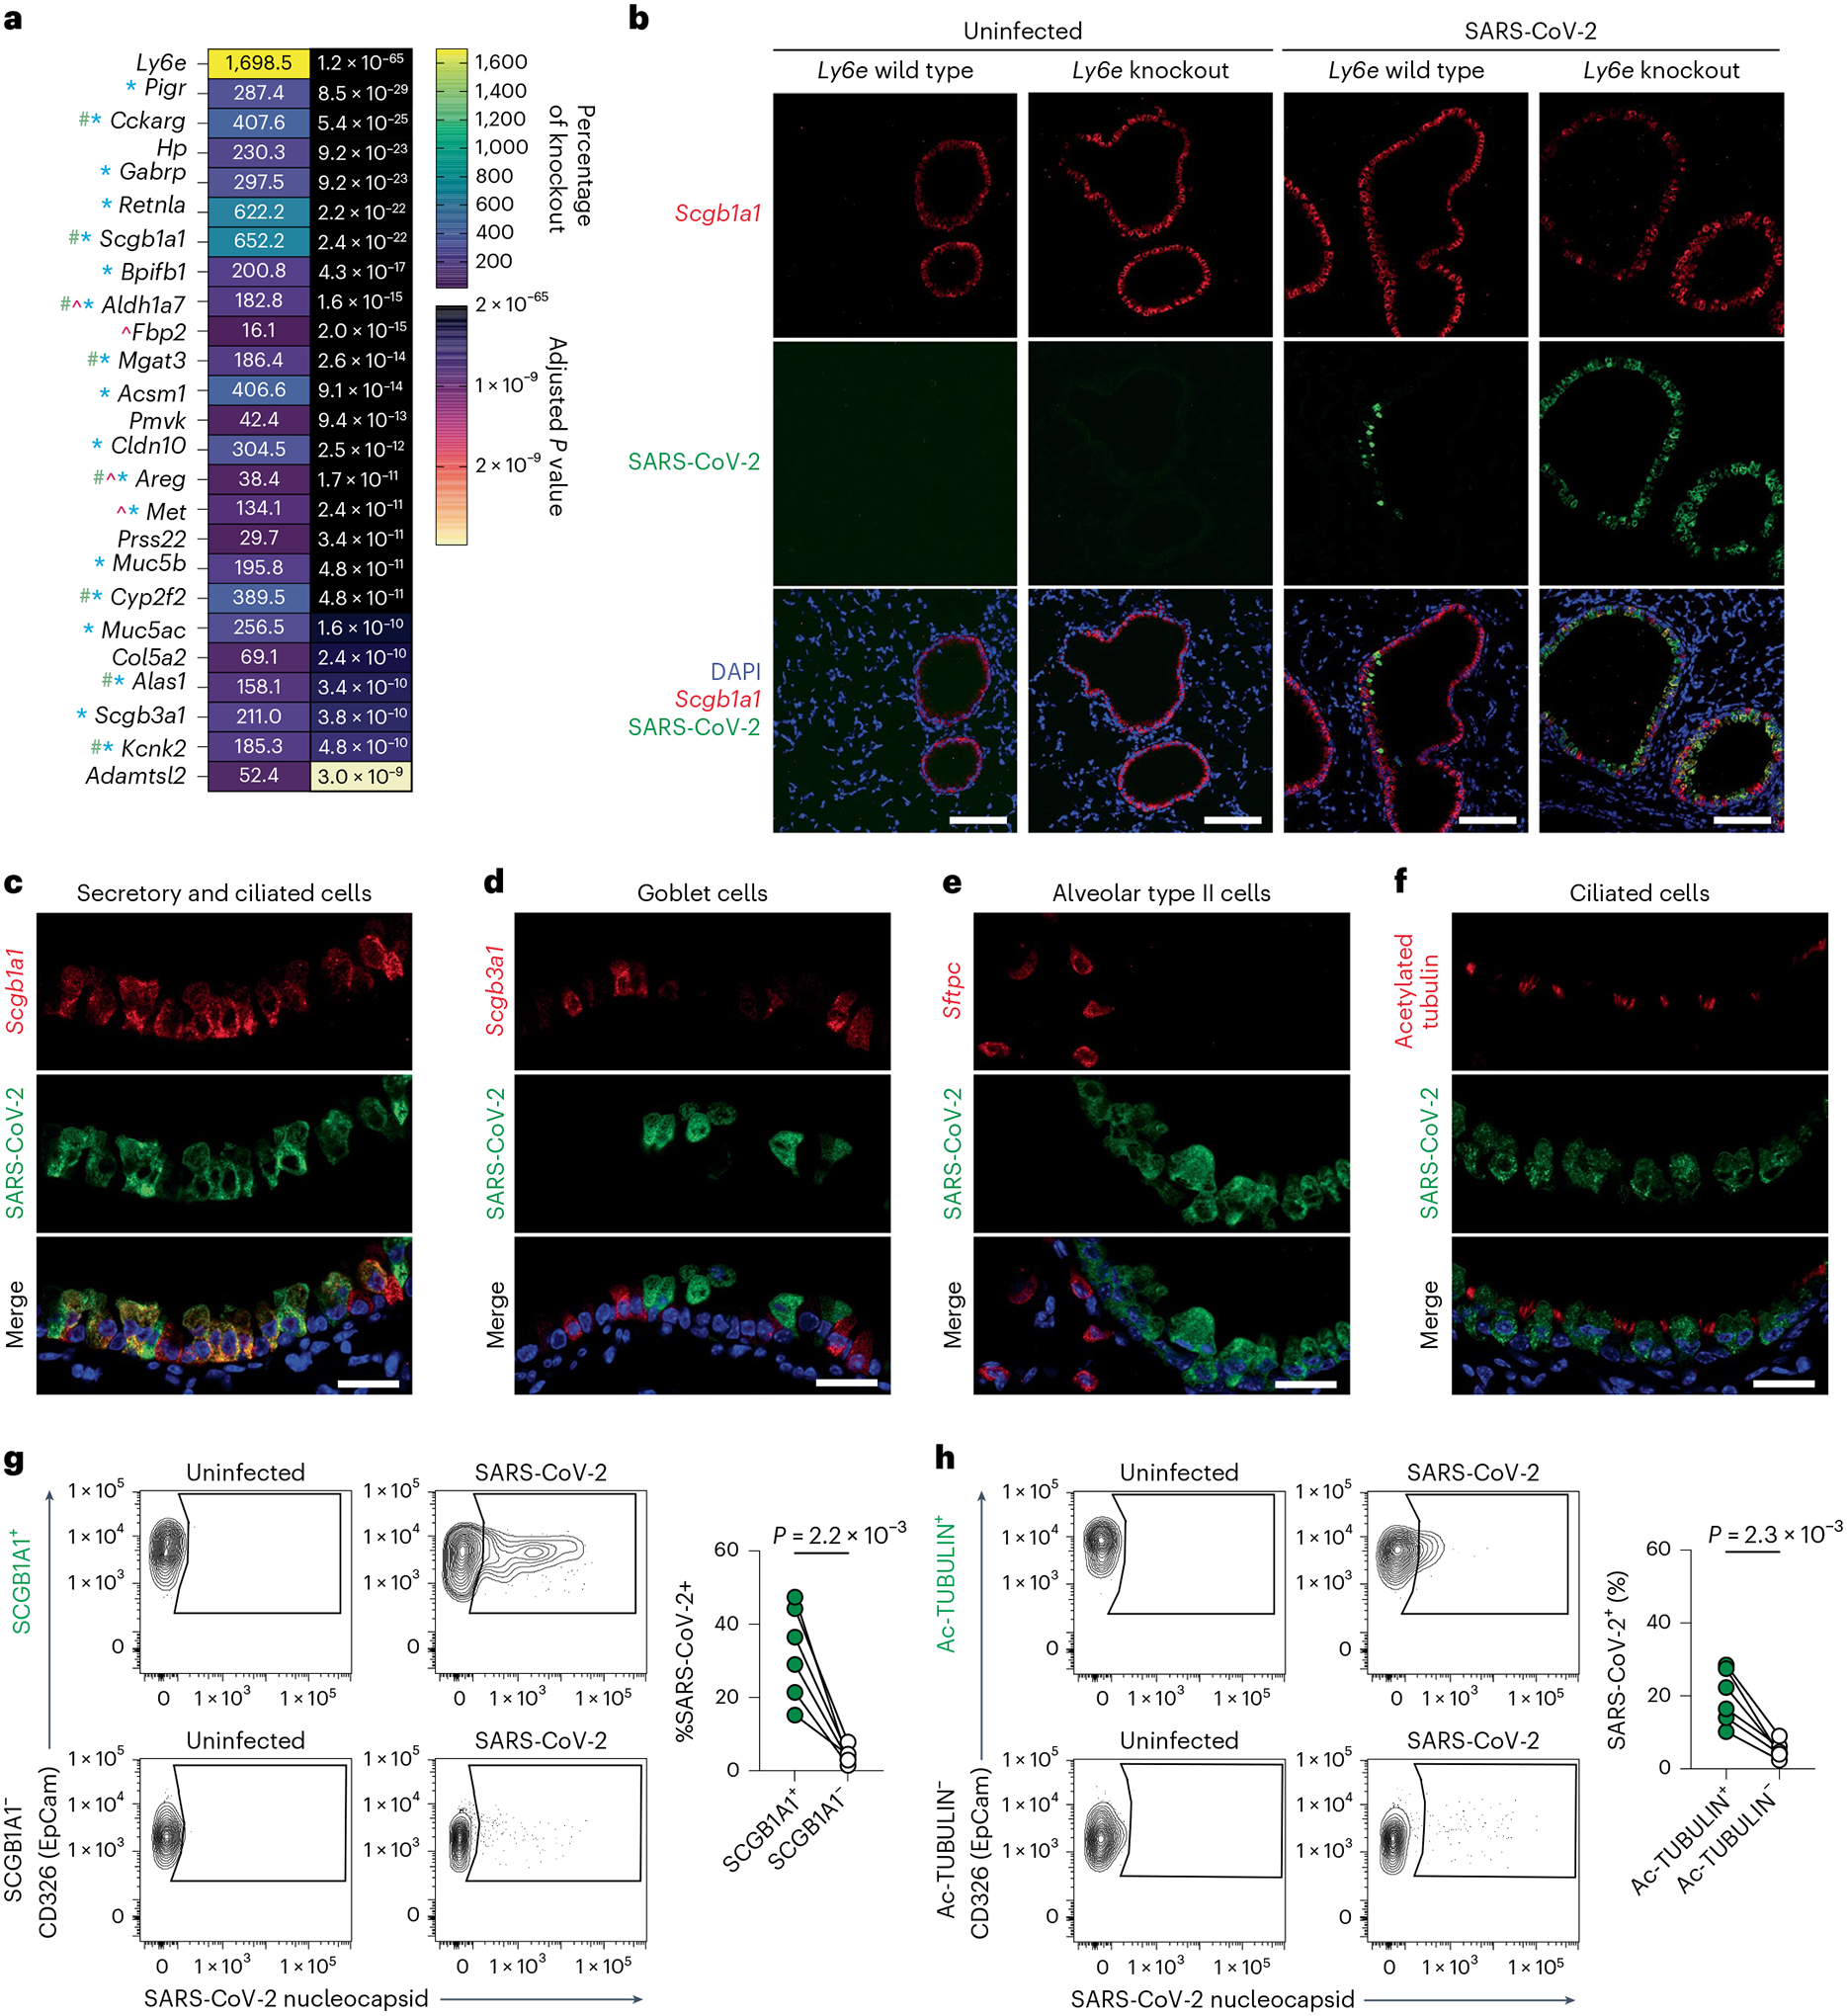
LY6E is an antiviral restriction factor that inhibits coronavirus spike-mediated fusion, but the cell types in vivo that require LY6E for protection from respiratory coronavirus infection are unknown. Here we used a panel of seven conditional Ly6e knockout mice to define which Ly6e-expressing cells confer control of airway infection by murine coronavirus and severe acute respiratory syndrome coronavirus 2 (SARS-CoV-2). Loss of Ly6e in Lyz2-expressing cells, radioresistant Vav1-expressing cells and non-haematopoietic cells increased susceptibility to murine coronavirus. Global conditional loss of Ly6e expression resulted in clinical disease and higher viral burden after SARS-CoV-2 infection, but little evidence of immunopathology. We show that Ly6e expression protected secretory club and ciliated cells from SARS-CoV-2 infection and prevented virus-induced loss of an epithelial cell transcriptomic signature in the lung. Our study demonstrates that lineage confined rather than broad expression of Ly6e sufficiently confers resistance to disease caused by murine and human coronaviruses.


Conflict of interest statement

Competing interests

The authors declare no competing interests.

Figures

Extended Data Fig. 1 |
Extended Data Fig. 1 |. a-f, Ly6efl/fl and Ly6eΔVav1 mice were intraperitoneally infected with 5,000 PFU MHV-A59 and assessed for survival (a), viral burden in brain, lung, spleen, and liver (b), viral burden in heart (c), viral burden in serum (d), serum alanine aminotransferase (e), and post-mortem spleen weight (f).
In a, data represents means from n = 34 Ly6efl/fl and n = 23 Ly6eΔVav1; b, d-f, n = 8 Ly6efl/fl and n = 15 Ly6eΔVav1; c, n = 5 Ly6efl/fl and n = 10 Ly6eΔVav1. g, Flow cytometry gating strategy for sorting lymphocytes from the spleen for examining Ly6e gene expression in Ly6eΔCD4, Ly6eΔCD8a, and Ly6eΔCD19 mice relative to Ly6efl/fl littermates in Fig. 1g. h–l, mice were intraperitoneally infected with 5,000 PFU MHV-A59 and assessed for (h) survival (n = 47 Ly6efl/fl, n = 15 Ly6eΔLyz2, n = 14 Ly6eΔCD11c, n = 14 Ly6eΔCD4, n = 5 Ly6eΔCD8a, and n = 16 Ly6eΔCD19), viral burden in brain, lung, spleen, and liver (i), viral burden in serum (j), serum alanine aminotransferase (k), and post-mortem spleen weight (l). In i-l, data represents means from n = 30 Ly6efl/fl, n=13 Ly6eΔLysM, n = 14 Ly6eΔCD11c, n = 10 Ly6eΔCD4, n = 6 Ly6eΔCD8a, and n = 14 Ly6eΔCD19. Male and female mice were used at an approximately 1 to 1 ratio for these experiments. Statistical significance was determined by log-rank (Mantel-Cox) tests (a, h), two-sided Mann-Whitney test (b-d), two-sided unpaired t-test (e-f), Kruskal-Wallis test (i-j), and one-way ANOVA (k-l). Error bars represent mean ± standard deviation.
Extended Data Fig. 2 |
Extended Data Fig. 2 |. a, Flow cytometry gating strategy for sorting lung CD45+ cells and CD31+ cells from Ly6eΔVav1 mice for determining Ly6e gene expression as shown in Fig. 2c,d.
b, Flow cytometry gating strategy for identifying donor (CD45.1+) and recipient (CD45.2+) immune cells. c, Relative composition of CD45.1+ and CD45.2+ immune cells of compartment total CD45+ cells in lung, spleen, and blood. d, Relative Ly6e mRNA levels in brain, heart, lung, liver, and spleen from Ly6e wildtype, heterozygous, and knockout mice. In c, data represents means from n = 3 Ly6efl/fl; CD45.2/.2, n = 3 Ly6efl/fl; CD45.1/.1, n = 3 Ly6efl→fl, n = 3 Ly6efl→ΔVav1; d, n = 3 Ly6e wildtype, n = 3 Ly6e heterozygous, n = 3 Ly6e knockout. Error bars represent mean ± standard deviation.
Extended Data Fig. 3 |
Extended Data Fig. 3 |. a, Ly6e wildtype and knockout mice were intranasally infected with 8,700 PFU SARS-CoV-2 and monitored daily for weight loss.
Lung viral burden measured by quantitative PCR for Ly6e wildtype and knockout mice (b) or C57BL/6J, Ifnar−/−, and Ifnlr−/− mice (c) that were infected with 60,000 PFU SARS-CoV-2 and euthanized 3 days post-infection. d, Lung Ly6e expression from C57BL/6J, Ifnar−/−, and Ifnlr−/− mice that were mock treated with PBS or infected with 8,700 PFU SARS-CoV-2 and euthanized the next day. Expression is shown relative to PBS-treated C57BL/6J mice. Expression of Ly6e (e) and Mx1 (f) in lungs from C57BL/6J mice treated intranasally with recombinant human IFNλ or retro-orbitally with recombinant murine IFNβ relative to untreated (untr). In a, data represents means from n = 5 Ly6e wildtype, n = 5 Ly6e knockout mice; b, n = 13 Ly6e wildtype, n = 13 Ly6e knockout mice; c, n = 8 C57BL6/J, n = 8 Ifnar−/−, and n=8 Ifnlr−/−; d, n = 5 for each group and genotype; e-f, n = 6 untreated, n = 9 IFNλ-treated, n = 8 IFNβ-treated. g, Representative hematoxylin and eosinstained lung sections used for analysis shown in Fig. 3e from Ly6e wildtype (n = 6) and Ly6e knockout (n = 6) mice euthanized 3 days after treated with PBS or intranasal infection with 60,000 PFU SARS-CoV-2. Example of automated image analysis of SARS-CoV-2 infected cells for Fig. 3g–h (h) and of CD45+ cells for Fig. 3i, j (i). In the corresponding markup images, cells without DAB marker (for example positive stain) are colored blue, and positive cells identified as weak positive, moderate positive, and strong positive for the DAB marker are colored as yellow, orange, and red respectively. Statistical significance was determined by two-sided unpaired t-test (a), two-sided Mann-Whitney test (b-c), one way ANOVA with Holm-Šídák′s multiple comparisons test (d–f). Error bars represent mean ± SEM in a and mean ± SD in b-f. Scale bars: 600 μm (g), 1 mm and 100 μm (h-i).
Extended Data Fig. 4 |
Extended Data Fig. 4 |. mRNA sequencing of lungs from Ly6e wildtype and Ly6e knockout mice that were intranasally infected with 60,000 PFU P.1 SARS-CoV-2 and euthanized 3 days post-infection.
Volcano plot summarization of differentially expressed genes (DEGs) between uninfected Ly6e wildtype (n = 6) and Ly6e knockout (n = 4) mice (a), uninfected wildtype (n = 6) and SARS-CoV-2 infected wildtype (n = 7) mice (b), and uninfected knockout (n = 4) and SARS-CoV-2 infected knockout (n=7) mice (c). d, Z-score heatmap of the top 25 DEGs for data summarized in a. e, Gene Ontology (GO) enrichment analysis of transcriptomic data from SARS-CoV-2 infected Ly6e wildtype and Ly6e knockout mice. The abscissa is the ratio of the number of differential genes linked with the GO term to the total number of differential genes. The size of a point represents the number of genes annotated to a specific GO term, and the color from red to purple represents the significant level of the enrichment. Male and female mice were used at an approximately 1 to 1 ratio for these experiments. For a-c, P-values were determined using the negative binomial distribution model and adjusted for multiple hypothesis testing using the Benjamini and Hochberg’s approach for controlling the false discovery rate. P-values for e were determined using hypergeometric distribution and adjusted testing using the Benjamini and Hochberg’s approach for controlling the false discovery rate.
Extended Data Fig. 5 |
Differential expression of select genes highlighted in Fig. 4a between SARS-CoV-2-infected Ly6e wildtype mice and uninfected Ly6e wildtype mice (a) and SARS-CoV-2-infected Ly6e knockout mice and uninfected Ly6e knockout mice (b)
Extended Data Fig. 6 |
Extended Data Fig. 6 |. Mice were infected with 8,700 PFU P.1 SARS-CoV-2 and euthanized 1 day post-infection.
Lung sections were probed for SARS-CoV-2 RNA (green) and Scgb1a1 mRNA (red) (a, c) or Scgb3a1 mRNA (red) (b, d). Lung sections from n = 3 Ly6e knockout mice were stained and imaged. Images shown are from two different mice than in Fig. 4. Scale bars: 100 μM (a-b), 25 μM (c-d).
Extended Data Fig. 7 |
Extended Data Fig. 7 |. Mice were infected with 8,700 PFU SARS-CoV-2 and euthanized 1 day post-infection.
Lung sections were probed for SARS-CoV-2 RNA (green) and Sftpc mRNA (red) (a, c) or for SARS-CoV-2 nucleocapsid (green) and acetylated tubulin (red) (b, d). Lung sections from n = 3 Ly6e knockout mice were stained and imaged. Images shown are from different mice than in Fig. 4. Scale bars: 100 μM (a-b), 25 μM (c-d).
Extended Data Fig. 8 |
a, Flow cytometry gating strategy used in Fig. 4g–h for detecting SARS-CoV-2 nucleocapsid (N) in SCGB1A1-positive and acetylated tubulin-positive pulmonary epithelial cells. Representative plots are from uninfected Ly6e knockout mice.
Extended Data Fig. 9 |
Extended Data Fig. 9 |. a, Area under the curve analysis of SARS-CoV-2 infectivity in HBE-ACE2 cells from n = 3 independent experiments, b, Western blot of two independent preparations of control and LY6E knockout cells used in a.
Statistical significance was determined by two-sided unpaired t-test (a). Error bars represent mean ± standard deviation.
Fig. 1 |
Fig. 1 |. Control of respiratory murine coronavirus infection is conferred in part by Ly6e in myeloid cells.
af, Mice were intranasally infected with 5,000 plaque-forming units (PFU) MHV-A59 and assessed for survival (a), viral burden in brain, lung, spleen and liver (b), viral burden in heart (c), viral burden in serum (d), serum ALT (e) and post-mortem spleen weight (f). g, Relative Ly6e mRNA levels in lung alveolar macrophages (Alv. Mϕ, n = 4 Ly6efl/fl, n = 4 Ly6eΔLyz2, n = 4 Ly6eΔCD11c), splenic CD3ε+CD4+ T cells (n = 3 Ly6efl/fl and n = 3 Ly6eΔCD4), splenic CD3ε+CD8α+ T cells (n = 3 Ly6efl/fl and n = 3 Ly6eΔCD8a) and splenic CD19+CD3ε B cells (n = 3 Ly6efl/fl and n = 3 Ly6eΔCD19). hl, Mice were intranasally infected with 5,000 PFU MHV-A59 and assessed for survival (n = 48 Ly6efl/fl, n = 16 Ly6eΔLyz2, n = 19 Ly6eΔCD11c, n = 13 Ly6eΔCD4, n = 11 Ly6eΔCD8a and n = 14 Ly6eΔCD19) (h), viral burden in brain, lung, spleen and liver (i), viral burden in serum (j), serum ALT (k) and post-mortem spleen weight (l). In a, data represent the mean of n = 24 Ly6efl/fl and n = 18 Ly6eΔVav1; in b, n = 13 Ly6efl/fl and n = 21 Ly6eΔVav1; in c, n = 5 Ly6efl/fl and n = 9 Ly6eΔVav1; in df, n = 13 Ly6efl/fl and n = 21 Ly6eΔVav1; in il, n = 26 Ly6efl/fl, n = 14 Ly6eΔLyz2, n = 13 Ly6eΔCD11c, n = 13 Ly6eΔCD4, n = 6 Ly6eΔCD8a and n = 12 Ly6eΔCD19. Male and female mice were used at an approximately 1-to-1 ratio for these experiments. Statistical significance was determined by log-rank (Mantel–Cox) tests (a and h), two-sided Mann–Whitney test (bd), two-sided unpaired t-test (eg), Kruskal–Wallis test with Dunn’s multiple comparisons test (i and j) and one-way analysis of variance with Holm–Šídák’s multiple comparisons test (k and l). Error bars represent mean ± standard deviation. NS, not significant.
Fig. 2 |
Fig. 2 |. Ly6e in radioresistant cells contributes to protection against murine coronavirus infection.
a, Experimental scheme to generate bone marrow chimaeric mice. bd, Relative Ly6e mRNA levels in whole spleen (b), lung CD45+ immune cells (c) and lung CD31+CD45EpCam endothelial cells (d). ei, Ly6efl→fl and Ly6efl→ΔVav1 mice were intranasally infected with 1,000 plaque-forming units (PFU) MHV-A59 and assessed for survival (e), viral burden in brain, lung, spleen and liver (f), viral burden in serum (g), serum ALT (h) and post-mortem spleen weight (i). j, Breeding scheme to generate whole-body Ly6e heterozygous and knockout mice. k,l, Ly6e wild-type, heterozygous and knockout mice were intranasally infected with 5,000 PFU MHV-A59 and assessed daily for survival (k) and weight loss (l). In b and c, data represent means from n = 3 Ly6efl/fl, n = 3 Ly6eΔVav1, n = 3 Ly6efl→fl and n = 3 Ly6efl→ΔVav1; in d, n = 3 Ly6efl/fl and n = 3 Ly6eΔVav1; in e, n = 16 Ly6efl→fl and n = 15 Ly6efl→ΔVav1; in fi, n = 10 Ly6efl→fl and n = 9 Ly6efl→ΔVav1; in k and l, n = 6 Ly6e wild type, n = 10 Ly6e heterozygous and n = 10 Ly6e knockout. Male and female mice were used at an approximately 1-to-1 ratio for these experiments. Statistical significance was determined by log-rank (Mantel–Cox) tests (e and k), two-sided Mann–Whitney test (f and g), one-way analysis of variance (b and c) and two-sided unpaired t-test (d and hl). Error bars represent mean ± standard deviation in all panels except for l, where error bars indicate mean ± standard error of the mean. NS, not significant.
Fig. 3 |
Fig. 3 |. Ly6e knockout mice have higher SARS-CoV-2 burden and infection-associated pathology.
Mice were intranasally infected with 60,000 plaque-forming units (PFU) P.1 SARS-CoV-2 or administered PBS (uninfected). For b and dm, mice were killed 3 days post-infection. a, Daily weight (n = 7 Ly6e wild type, n = 4 Ly6e heterozygous and n = 7 Ly6e knockout). b, Viral burden in lung (n = 12 Ly6e wild type and n = 12 Ly6e knockout). c, Daily weight (n = 10 C57BL6/J, n = 10 Ifnar−/− and n = 10 Ifnlr−/−). d, Viral burden in lung (n = 8 C57BL6/J, n = 8 Ifnar−/− and n = 8 Ifnlr−/−). e, Histopathological scoring for features of acute pneumonia in lung sections (n = 9 Ly6e wild type and n = 9 Ly6e knockout). f, Representative lung sections stained for SARS-CoV-2 nucleocapsid (DAB) and a haematoxylin counterstain. Quantitative analyses of lung sections from n = 6 Ly6e wild-type and n = 6 Ly6e knockout mice: percentage of SARS-CoV-2 nucleocapsid-positive cells of total lung cells (g), nucleocapsid stain H-score that integrates staining intensity and proportion of total cells (h), percentage of CD45-positive cells of total lung cells (i) and CD45 stain H-score (j). k,l, Z-score heat map of the top 25 most differentially expressed genes between SARS-CoV-2-infected and uninfected Ly6e wild-type mice (k) and SARS-CoV-2-infected and uninfected Ly6e knockout mice (l) based on RNA-seq. m, Differential gene expression of the top 25 genes induced by SARS-CoV-2 infection in Ly6e wild-type mice (as in k) shown relative to average expression levels in Ly6e knockout mice. Statistical significance was determined by two-sided unpaired t-tests (a, g and i), two-sided Mann–Whitney test (b, d, h and j), and Kolmogorov–Smirnov test (e). In a, black text indicates statistical comparison between wild type and knockout (days 2–7, left to right: P = 1 × 10⁻⁵, P = 6 × 10⁻⁶, P = 4 × 10⁻⁶, P = 6.1 × 10⁻⁵, P = 1.2 × 10⁻⁵ and P = 8.6 × 10⁻⁵), and grey symbols (days 2–7, left to right: P = 0.02, P = 0.03, P = 0.02, P = 0.01, P = 2.8 × 10⁻³ and P = 0.02) indicate comparison between heterozygous and knockout. Error bars represent mean ± standard deviation in all panels except for a and c, where error bars indicate mean ± standard error of the mean. Scale bars: 2 mm (f). NS, not significant.
Fig. 4 |
Fig. 4 |. Ly6e protects lung secretory club cells and ciliated cells from SARS-CoV-2 infection.
a, Mice were intranasally infected with 60,000 plaque-forming units (PFU) P.1 SARS-CoV-2 and killed 3 days post-infection. The heat map illustrates the top 25 most differentially expressed genes between SARS-CoV-2-infected Ly6e wild-type mice (n = 7) and Ly6e knockout mice (n = 7) based on RNA-seq. Genes enriched in secretory cells (blue asterisk), ciliated cells (green pound sign) or alveolar type II epithelial cells (pink caret) are labelled according to public single-cell RNA-seq data (lungendothelialcellatlas.com). bh, Mice were intranasally infected with 8,700 PFU P.1 SARS-CoV-2 and killed 1 day post-infection. Lung sections were probed by HCR-RNA-FISH for SARS-CoV-2 RNA (green) and Scgb1a1 mRNA (red) (b and c), Scgb3a1 mRNA (red) (d) and Sftpc mRNA (red) (e), or by IHC for SARS-CoV-2 nucleocapsid (green) and acetylated tubulin (red) (f). Representative images were selected from n = 3 Ly6e knockout mice; remaining images from other two mice are shown in Extended Data Figs. 6 and 7. g,h, Representative contour plots of CD45EpCam+ cells from lungs of SARS-CoV-2-infected or uninfected Ly6e knockout mice stained for SARS-CoV-2 nucleocapsid and SCGB1A1 (g) or acetylated tubulin (h) and quantification of infection (n = 6 Ly6e knockout mice). Male and female mice were used at an approximately 1-to-1 ratio for these experiments. Statistical significance was determined by two-sided paired t-test (g and h). Scale bars, 100 μM (b) and 25 μM (cf).

References

    1. Schoggins JW Interferon-stimulated genes: what do they all do? Annu. Rev. Virol 6, 567–584 (2019). - PubMed
    1. Mao M et al. RIG-E, a human homolog of the murine Ly-6 family, is induced by retinoic acid during the differentiation of acute promyelocytic leukemia cell. Proc. Natl Acad. Sci. USA 93, 5910–5914 (1996). - PMC - PubMed
    1. Bacquin A et al. A cell fusion-based screening method identifies glycosylphosphatidylinositol-anchored protein Ly6e as the receptor for mouse endogenous retroviral envelope syncytin-A. J. Virol 91, e00832–17 (2017). - PMC - PubMed
    1. Schupp JC et al. Integrated single-cell atlas of endothelial cells of the human lung. Circulation 144, 286–302 (2021). - PMC - PubMed
    1. Tabula Muris C et al. Single-cell transcriptomics of 20 mouse organs creates a Tabula Muris. Nature 562, 367–372 (2018). - PMC - PubMed

Publication types