. 2023 Aug;26(8):1417-1428.
doi: 10.1038/s41593-023-01390-9. Epub 2023 Jul 13.

Antipsychotic drug efficacy correlates with the modulation of D1 rather than D2 receptor-expressing striatal projection neurons

Affiliations

Antipsychotic drug efficacy correlates with the modulation of D1 rather than D2 receptor-expressing striatal projection neurons

Seongsik Yun et al. Nat Neurosci. 2023 Aug.

Abstract

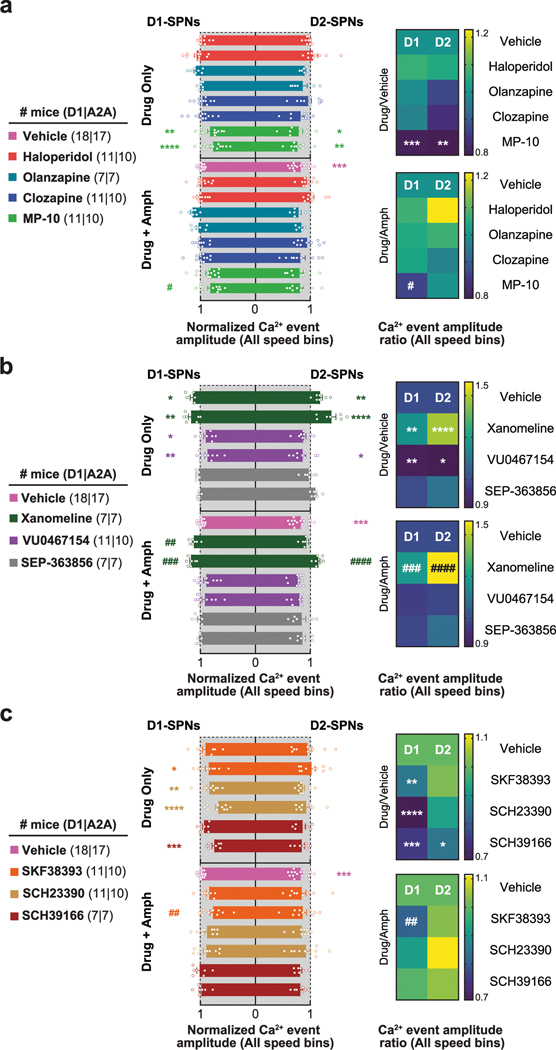
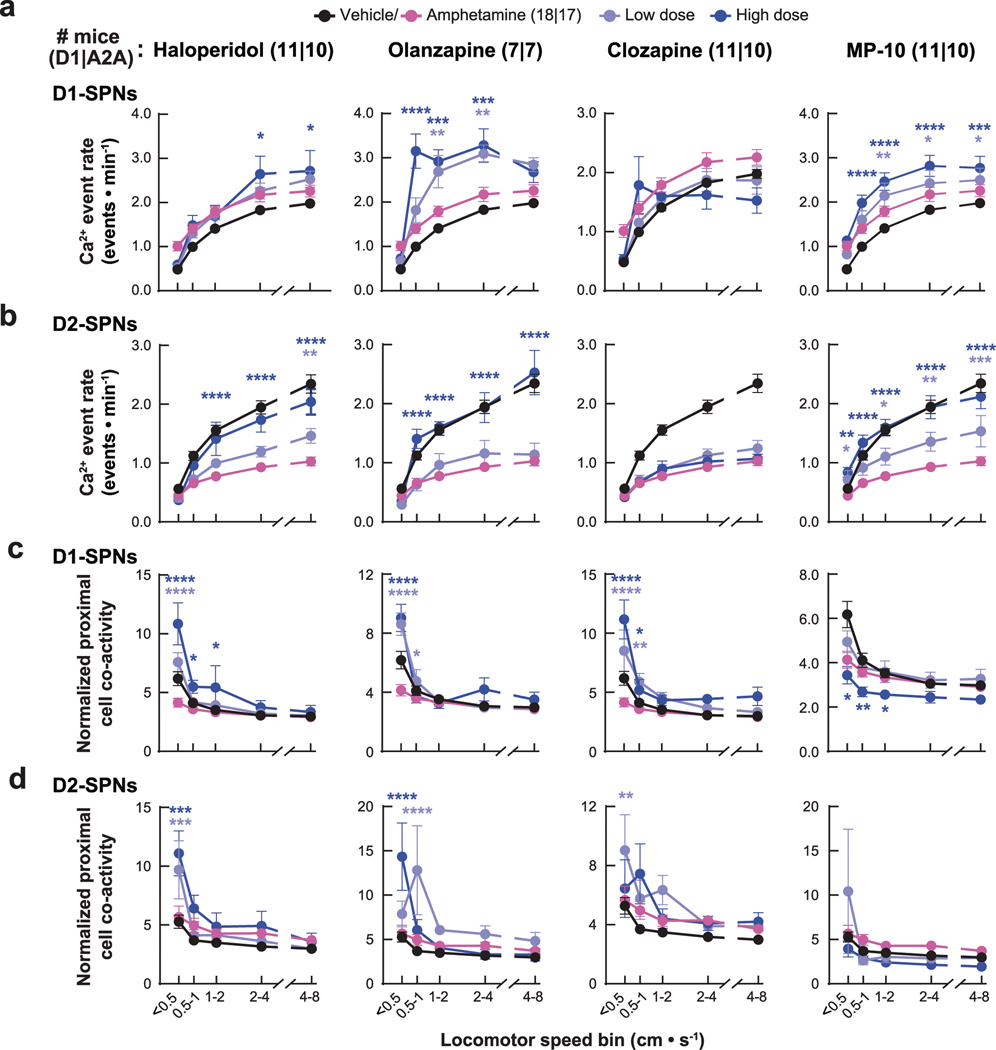
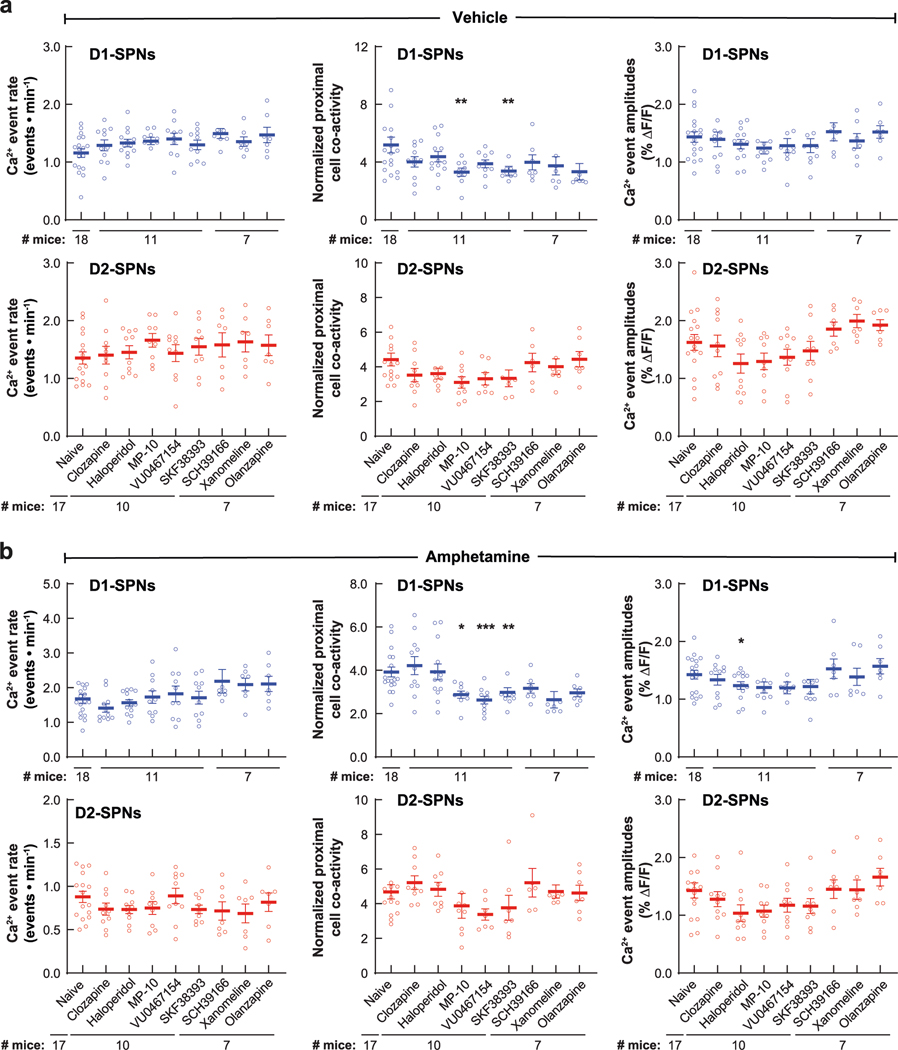
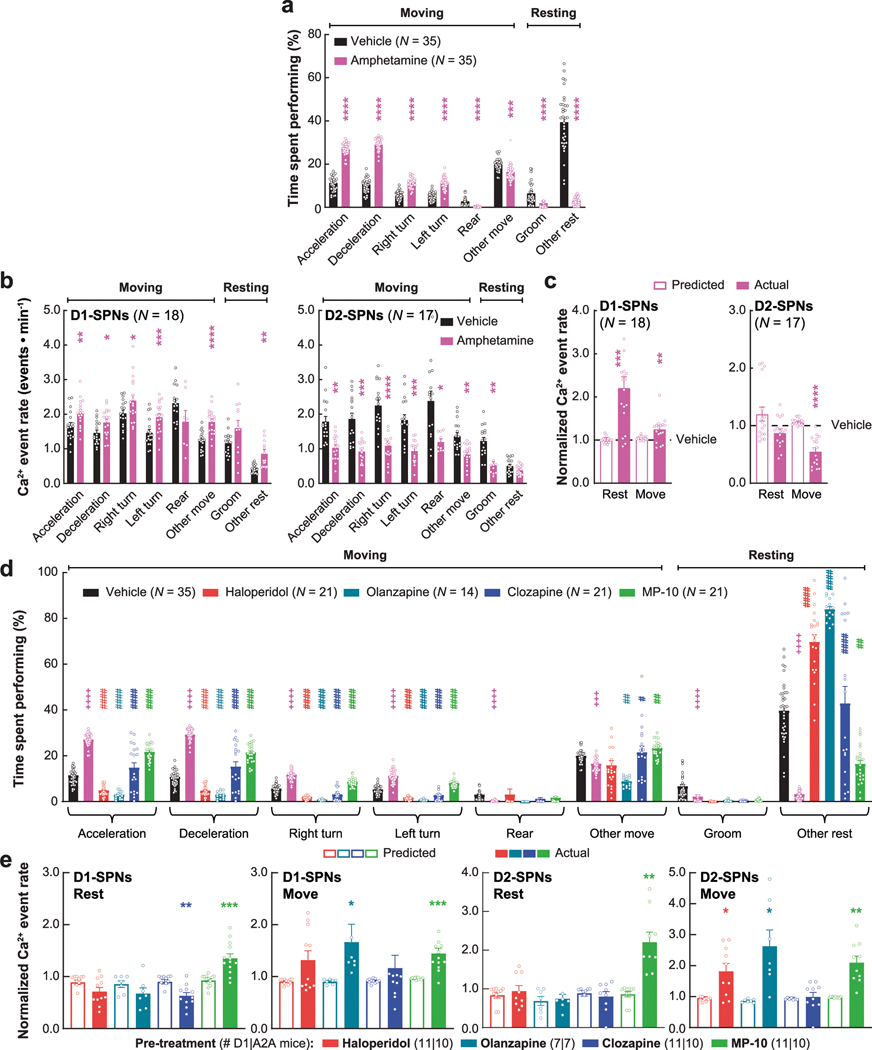
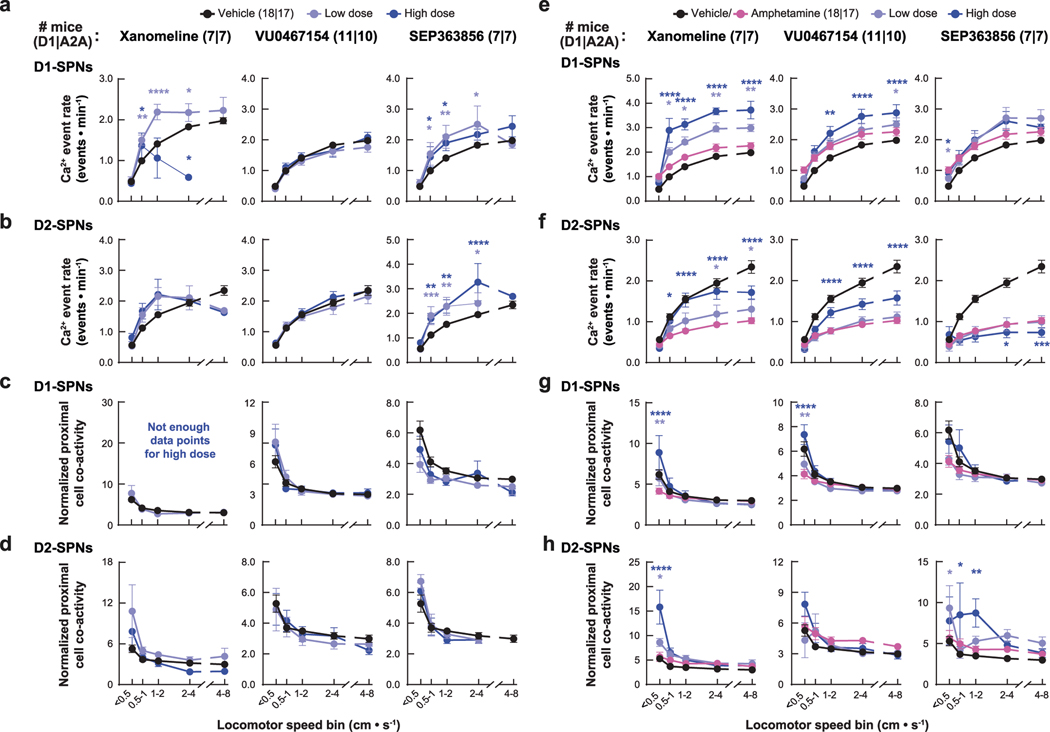
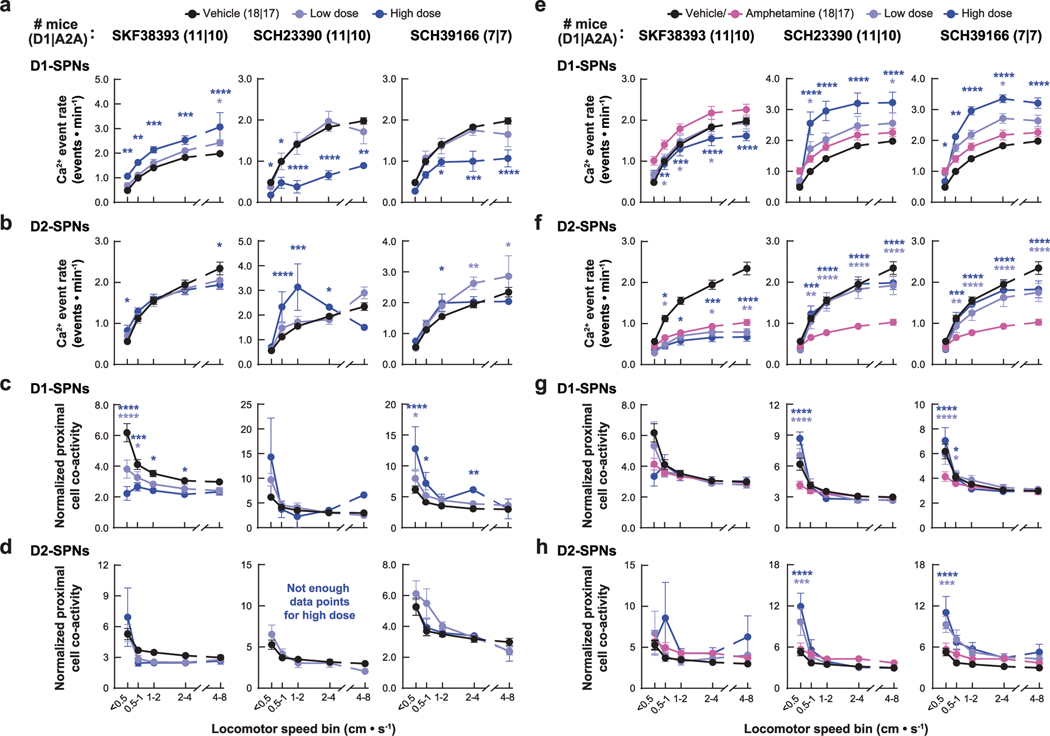
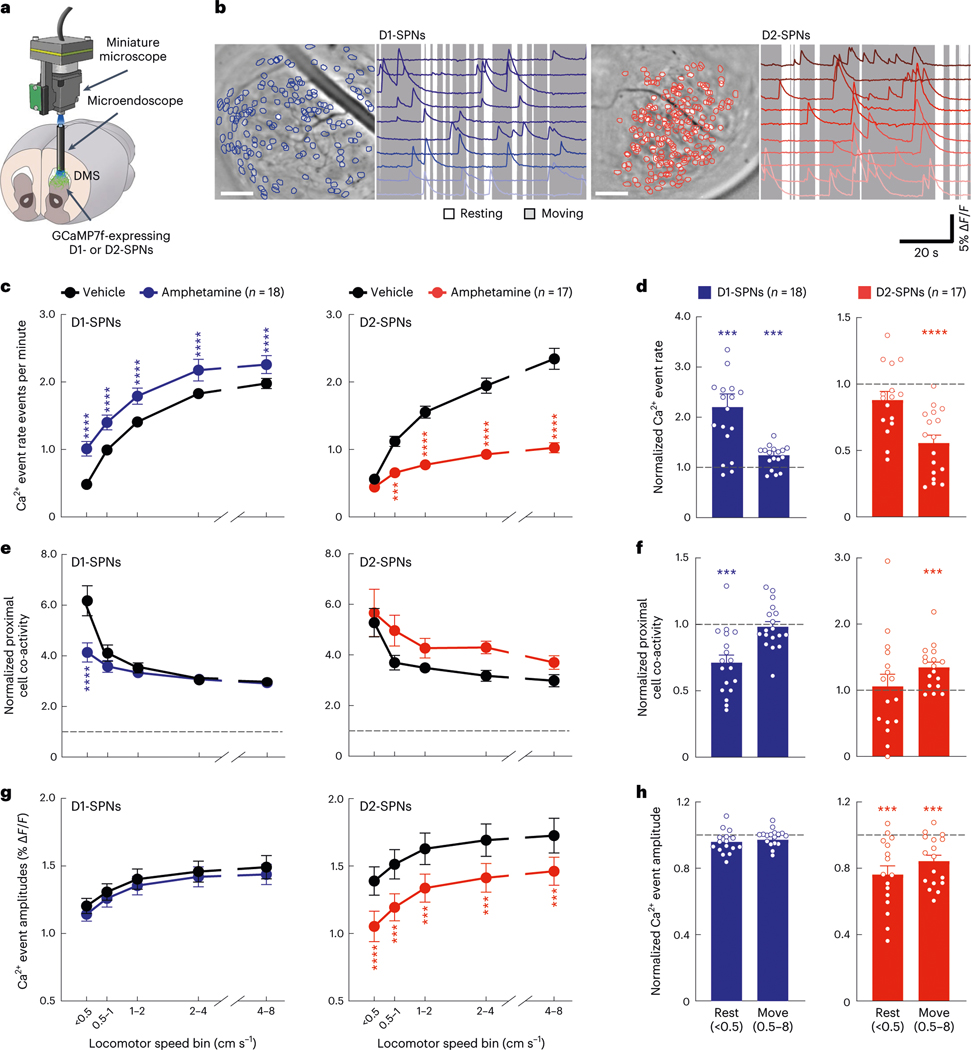
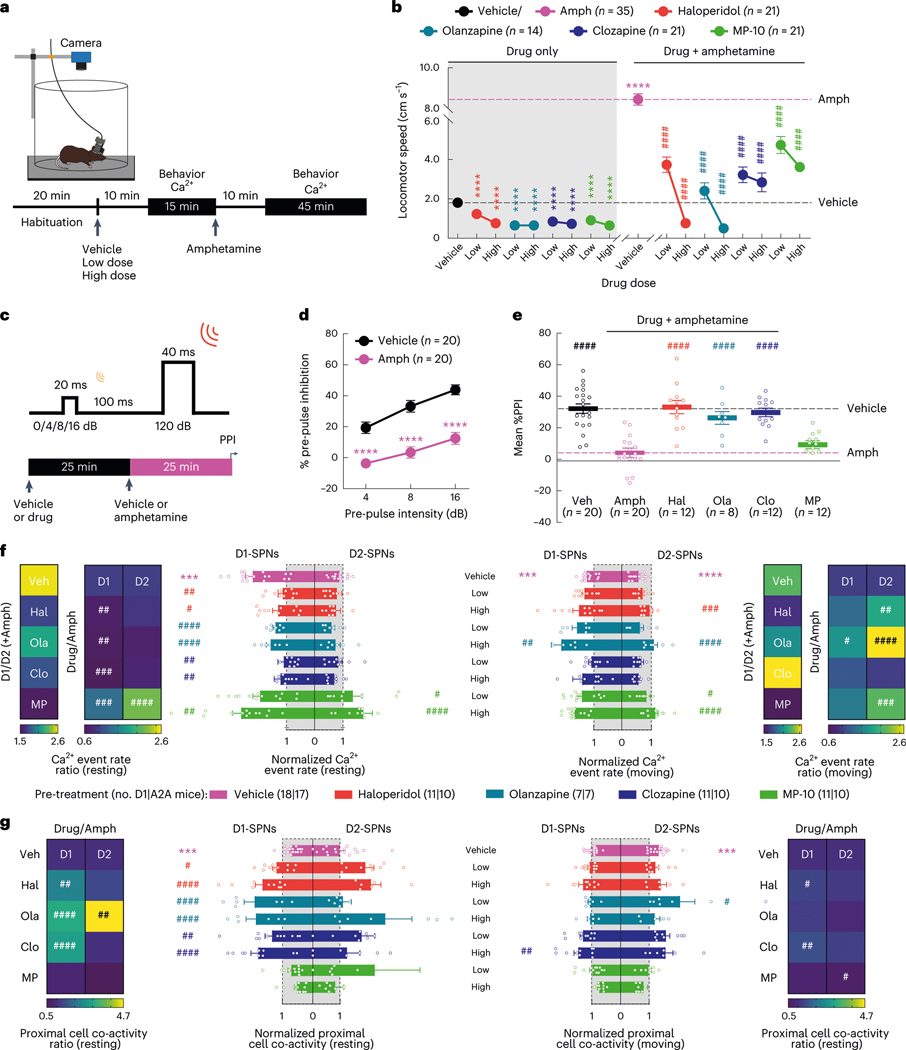
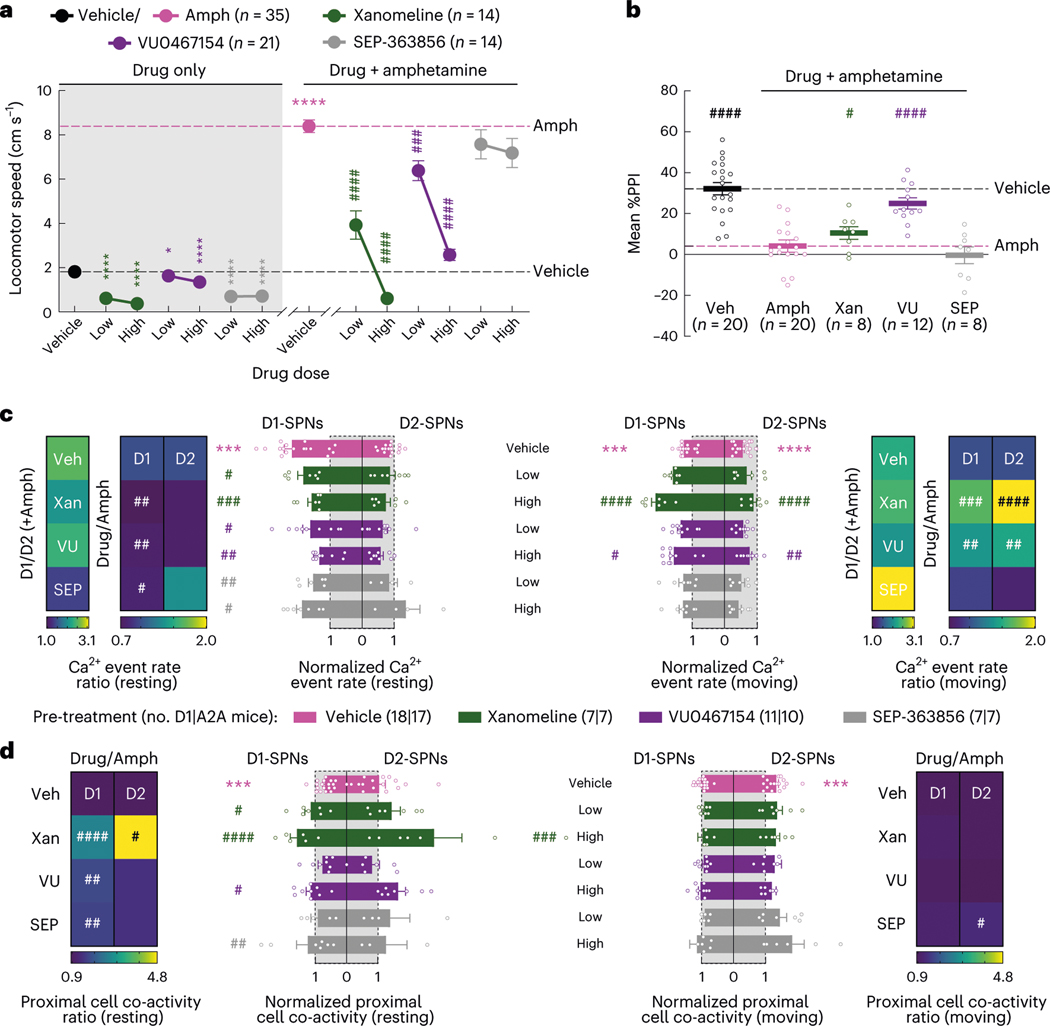
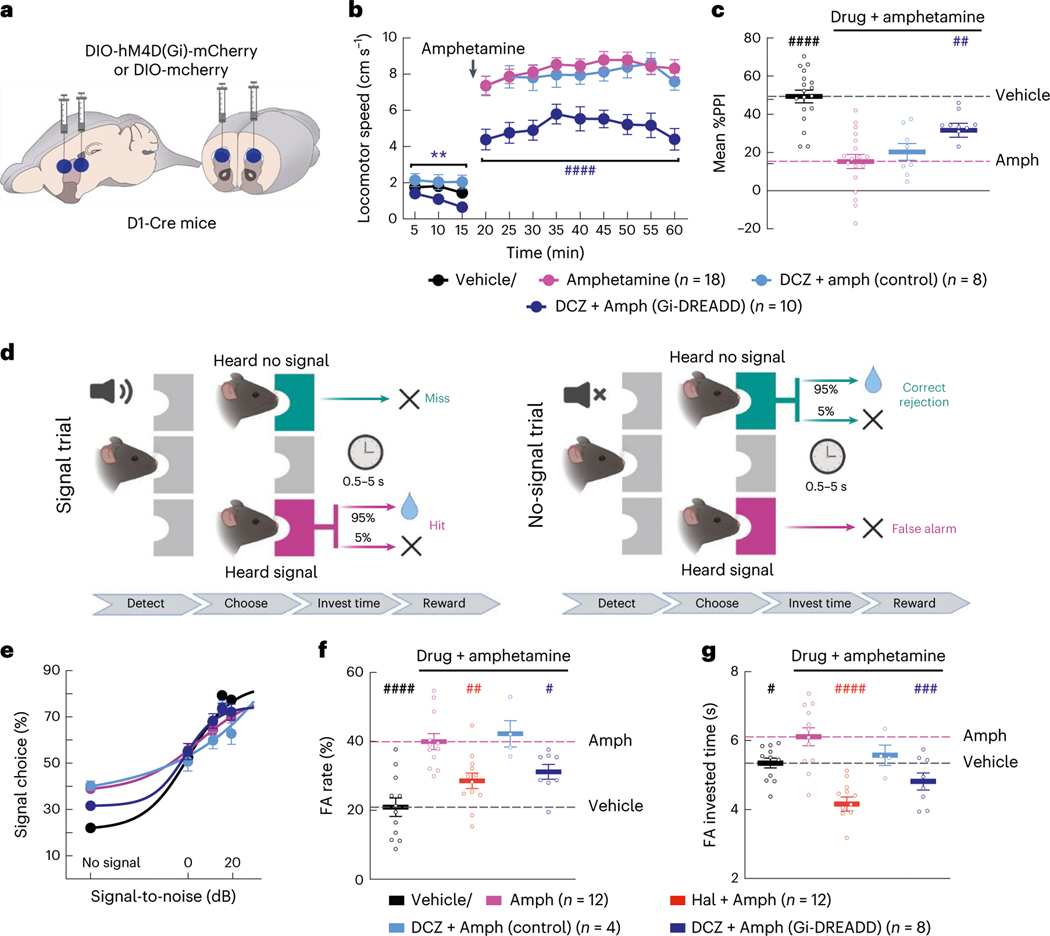
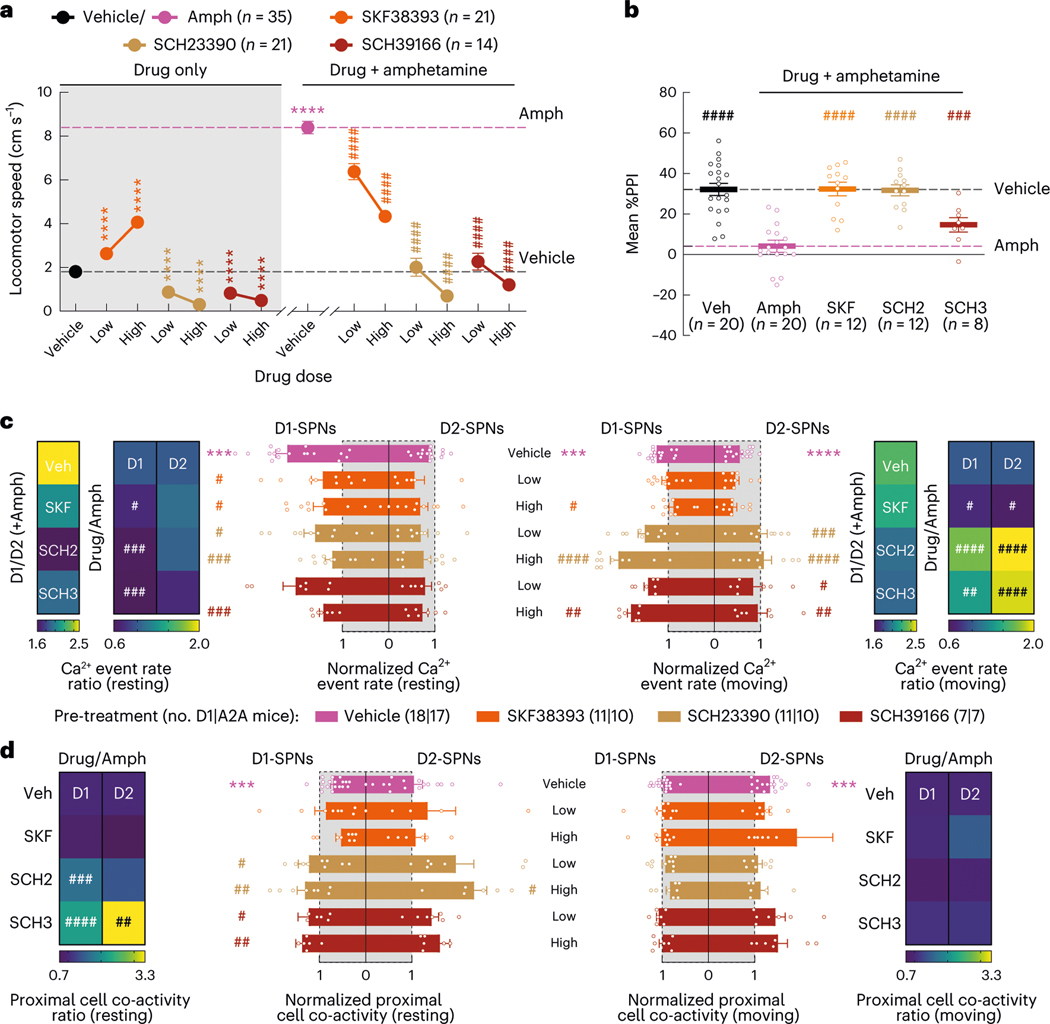
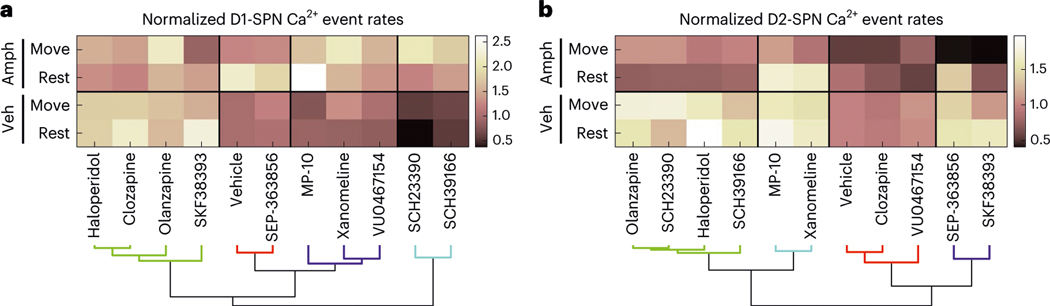
Elevated dopamine transmission in psychosis is assumed to unbalance striatal output through D1- and D2-receptor-expressing spiny-projection neurons (SPNs). Antipsychotic drugs are thought to re-balance this output by blocking D2 receptors (D2Rs). In this study, we found that amphetamine-driven dopamine release unbalanced D1-SPN and D2-SPN Ca2+ activity in mice, but that antipsychotic efficacy was associated with the reversal of abnormal D1-SPN, rather than D2-SPN, dynamics, even for drugs that are D2R selective or lacking any dopamine receptor affinity. By contrast, a clinically ineffective drug normalized D2-SPN dynamics but exacerbated D1-SPN dynamics under hyperdopaminergic conditions. Consistent with antipsychotic effect, selective D1-SPN inhibition attenuated amphetamine-driven changes in locomotion, sensorimotor gating and hallucination-like perception. Notably, antipsychotic efficacy correlated with the selective inhibition of D1-SPNs only under hyperdopaminergic conditions-a dopamine-state-dependence exhibited by D1R partial agonism but not non-antipsychotic D1R antagonists. Our findings provide new insights into antipsychotic drug mechanism and reveal an important role for D1-SPN modulation.


Conflict of interest statement

Competing interests

The authors declare no competing interests.

Figures

Extended Data Fig. 1 |
Extended Data Fig. 1 |. Histological validation and characterization of normal D1-/D2-SPN ensemble dynamics and hM4Di-mCherry functionality.
a, Representative coronal brain sections of DMS and substantia nigra reticulata (SNr) from GCaMP7f-expressing D1- or A2A-Cre mice (green: anti-GFP; blue: DAPI nuclear stain; scale bar: 1 mm). White lines indicate the position of the implanted microendoscope and boundaries of brain areas. b, Ca2+ event rates in D1- and D2-SPNs across increasing running speed bins. c, Co-activity ( Jaccard index) of D1- or D2-SPN pairs during movement (locomotor speed >= 0.5 cm·s−1) versus the separation of cell pairs, normalized to temporally shuffled datasets (dashed line). Cyan shading indicates proximal (25–125 μm) cell pairs. d, Co-activity of proximal D1- and D2-SPN pairs across increasing running speed bins, normalized to temporally shuffled comparisons (dashed line). e, Ca2+ event amplitudes in D1- and D2-SPNs across increasing locomotor speed bins (for be, N = 18 D1-Cre and N = 17 A2A-Cre mice; data were averaged across all recordings following vehicle only treatment; **P < 0.01 comparing D1-SPNs to D2-SPNs; Two-way ANOVA with Holm-Sidak’s multiple comparison test). f, Representative coronal brain sections of DMS and subtantia nigra from hM4Di-mCherry expressing D1-Cre mice (red: mCherry; blue: DAPI nuclear stain; scale bar: 1 mm). g, We performed patch-clamp electrophysiological recordings from hM4Di-mCherry-expressing neurons in the DMS of D1-Cre mice. h, Representative traces of action potential responses to 250 pA current injection. i, Number of evoked action potentials following vehicle, DCZ or CNO treatment (N = 4 cells; *P < 0.05 compared to vehicle treatment; One-way ANOVA with Holm-Sidak’s multiple comparison test). All data are mean ± s.e.m. Exact P values for these and all other analyses are in the Supplementary Table. All N values refer to number of mice for all figures unless otherwise specified.
Extended Data Fig. 2 |
Extended Data Fig. 2 |. Antipsychotic drug dose selection based on locomotor activity.
a–c, Locomotor activity in untethered, C57BL6/J mice during 15 min following vehicle or drug treatment and 45 min following amphetamine treatment (see Fig. 2a). Effects of haloperidol, olanzapine, clozapine, or MP-10 (a), xanomeline, VU0467154, or SEP-363856 (b), and SKF39393, SCH23390, or SCH39166 (c) on baseline and amphetamine-driven locomotion. The ‘low’ and ‘high’ doses we subsequently used for Ca2+ imaging experiments are indicated in red. Data are expressed as mean ± s.e.m. (****P < 10−4 ***P < 10−3, **P < 10−2 and *P < 0.05 for comparison to vehicle treatment; ####P < 10−4 and ##P < 10−2 compared to vehicle + amphetamine treatment; One-way ANOVA with Holm-Sidak’s multiple comparison test).
Extended Data Fig. 3 |
Extended Data Fig. 3 |. Effects of drug treatments on D1-/ D2-SPN dynamics under baseline conditions.
a–f, Bar plots depict the mean ± s.e.m Ca2+ event rates (a, c, e) and proximal co-activity (b, d, f) of D1- and D2-SPNs, normalized to values following vehicle only treatment during periods of rest (left) or movement (right) following haloperidol, olanzapine, clozapine, or MP-10 (a, b), xanome line, VU0467154, or SEP-363856 (c, d), and SKF39393, SCH23390, or SCH39166 (e, f) treatment. Heat maps display either the effects of drugs on the ratio of D1- to D2-SPN Ca2+ event rates (D1/D2; left in a, c, e) or the ratio of drug to vehicle treatment on the rates (Drug/Vehicle; right in a, c, e) or proximal co-activity (b, d, f) of D1- and D2-SPN activity during periods or rest (left) or movement (right) (****P < 10−4, ***P < 10−3, **P < 10−2 and *P < 0.05 compared to vehicle treatment; One-way ANOVA with Holm-Sidak’s multiple comparison test).
Extended Data Fig. 4 |
Extended Data Fig. 4 |. Antipsychotic drug effects on D1-/D2-SPN Ca2+ dynamics under baseline conditions as a function of locomotor speed.
a, b, Drug effects on D1- (a) and D2-SPN (b) Ca2+ event rates across different speed bins following vehicle or drug only treatment. c, d, Drug effects on the proximal co-activity of D1- (c) and D2-SPNs (d) across different speed bins following vehicle or drug only treatment. Data are represented as mean ± s.e.m. (****P < 10−4, ***P < 10−3, **P < 10−2 and *P < 0.05 for comparison to vehicle treatment; Two-way ANOVA with Holm-Sidak’s multiple comparison test).
Extended Data Fig. 5 |
Extended Data Fig. 5 |. Drug effects on D1-/D2-SPN Ca2+ event amplitudes under normal and hyperdopaminergic conditions.
ac, Mean ± s.e.m. Ca2+ event amplitudes of D1- and D2-SPNs across all speeds following treatment with haloperidol, olanzapine, clozapine, or MP-10 (a), xanomeline, VU0467154, or SEP-363856 (b), and SKF39393, SCH23390, or SCH39166 (c), normalized to values following vehicle only treatment. Data are from periods before (top) or after (bottom) amphetamine treatment. Heat maps depict the mean D1- and D2-SPN Ca2+ event amplitudes, normalized to values following vehicle only treatment (Drug/Vehicle) and the vehicle-normalized values, normalized to the corresponding value following vehicle + amphetamine treatment (Drug/Amph; ****P < 10−4, ***P < 10−3, **P < 10−2 and *P < 0.05 for comparison to vehicle treatment; ####P < 10−4, ###P < 10−3, ##P < 10−2 and #P < 0.05 compared vehicle + amphetamine treatment; One-way ANOVA with Holm-Sidak’s multiple comparison test).
Extended Data Fig. 6 |
Extended Data Fig. 6 |. Antipsychotic drug effects on D1-/D2-SPN Ca2+ dynamics as a function of locomotor speed under hyperdopaminergic conditions.
a, b, Drug effects on Ca2+ event rates of D1- (a) and D2-SPNs (b) across different speed bins following vehicle or drug + amphetamine treatment. c, d, Drug effects on the proximal co-activity of D1- (c) and D2-SPNs (d) across different speed bins following vehicle or drug + amphetamine treatment. Data are represented as mean ± s.e.m. (****P < 10−4, ***P < 10−3, **P < 10−2 and *P < 0.05 for comparison to vehicle + amphetamine treatment; Two-way ANOVA with Holm-Sidak’s multiple comparison test).
Extended Data Fig. 7 |
Extended Data Fig. 7 |. Longitudinal stability of D1-/D2-SPN dynamics under normal and hyperdopaminergic conditions.
a, b, Ca2+ event rates (left), proximal co-activity (middle) and Ca2+ event amplitudes (right) of D1- (top) and D2-SPNs (bottom) across all locomotor speed bins and drug treatment blocks following vehicle (a) or amphetamine only (b) treatment. Data are represented as mean ± s.e.m. (***P < 10−3, **P < 10−2 and *P < 0.05 compared to naive; One-way ANOVA with Holm-Sidak’s multiple comparison test).
Extended Data Fig. 8 |
Extended Data Fig. 8 |. Drug effects on the time spent engaged in specific behaviors and their associated D1- and D2-SPN activity levels.
a, b, Proportion of time engaged in specific behaviors (a) and the D1- and D2-SPN Ca2+ event rates associated with those behaviors (b) following vehicle or amphetamine treatment. c, The predicted and actually observed Ca2+ event rates of D1- and D2-SPNs following amphetamine treatment during periods of rest or movement, normalized to values following vehicle treatment. Predicted values were computed from a weighted average of the event rates associated with each behavior following vehicle treatment in (b) and the proportion of time spent engaged in each behavior following amphetamine treatment in (a), where the specific behaviors were grouped into resting and moving types for comparison to the observed data here and reported in the main text (Figs. 1 and 2). d, Proportion of time spent in categorized resting and moving behaviors following vehicle, vehicle + amphetamine, or drug + amphetamine treatment. e, The predicted and actually observed Ca2+ event rates of D1- and D2-SPNs following drug + amphetamine treatment during periods of rest or movement, normalized to values following vehicle treatment. Predicted values were computed from the data in (b) and (d) as described in (c). All data are expressed as mean ± s.e.m. (****P < 10−4, ***P < 10−3, **P < 10−2 and *P < 0.05 compared to vehicle treatment (a, b) or predicted values (c, e); two-tailed Wilcoxon signed-rank test; ++++P < 10−4 and +++P < 10−3 comparing vehicle to vehicle + amphetamine treatment and ####P < 10−4, ###P < 10−3, ##P < 10−2 and #P < 0.05 comparing drug + amphetamine to vehicle + amphetamine treatment (d); One-way ANOVA with Holm-Sidak’s multiple comparison test).
Extended Data Fig. 9 |
Extended Data Fig. 9 |. Dopamine receptor-independent drug effects on D1-/D2-SPN Ca2+ dynamics as a function of locomotor speed under normal and hyperdopaminergic conditions.
a, b, Drug effects on D1- (a) and D2-SPN (b) Ca2+ event rates across different speed bins following vehicle or drug only treatment. c, d, Drug effects on the proximal co-activity of D1- (c) and D2-SPNs (d) across different speed bins following vehicle or drug only treatment. e, f, Drug effects on Ca2+ event rates of D1- (e) and D2-SPNs (f) across different speed bins following vehicle or drug + amphetamine treatment. g, h, Drug effects on the proximal co-activity of D1- (g) and D2-SPNs (h) across different speed bins following vehicle or drug + amphetamine treatment. Data are represented as mean ± s.e.m. (****P < 10−4, ***P < 10−3, **P < 10−2 and *P < 0.05 for comparison to vehicle treatment (a–d) or to vehicle + amphetamine treatment (e–h); Two-way ANOVA with Holm-Sidak’s multiple comparison test).
Extended Data Fig. 10 |
Extended Data Fig. 10 |. D1R-targeted drug effects on D1-/D2-SPN Ca2+ dynamics as a function of locomotor speed under normal and hyperdopaminergic conditions.
a, b, Drug effects on D1- (a) and D2-SPN (b) Ca2+ event rates across different speed bins following vehicle or drug only treatment. c, d, Drug effects on the proximal co-activity of D1- (c) and D2-SPNs (d) across different speed bins following vehicle or drug only treatment. e, f, Drug effects on Ca2+ event rates of D1- (e) and D2-SPNs (f) across different speed bins following vehicle or drug + amphetamine treatment. g, h, Drug effects on the proximal co-activity of D1- (g) and D2-SPNs (h) across different speed bins following vehicle or drug + amphetamine treatment. Data are represented as mean ± s.e.m. (****P < 10−4, ***P < 10−3, **P < 10−2 and *P < 0.05 for comparison to vehicle treatment (a–d) or to vehicle + amphetamine treatment (e–h); Two-way ANOVA with Holm-Sidak’s multiple comparison test).
Fig. 1 |
Fig. 1 |. Effects of amphetamine treatment on D1-SPN/D2-SPN Ca2+ activity in freely behaving mice.
a, We used a miniature microscope and microendoscope to image Ca2+ activity in D1-SPNs and D2-SPNs by expressing GCaMP7f in the DMS. b, Cell centroid locations overlaid on mean fluorescence images of DMS and example Ca2+ activity traces from D1-SPNs and D2-SPNs in representative D1-Cre (left) and A2A-Cre (right) mice. Scale bars, 100 μm. c,d, Effects of vehicle or amphetamine on D1-SPN and D2-SPN Ca2+ event rates across increasing locomotor speed bins (c) or averaged across resting (< 0.5 cm s−1) and moving (0.5–8 cm s−1) speed bins (d) and normalized to mean values after vehicle-only treatment. e,f, Effects of vehicle or amphetamine on the co-activity of proximal D1-SPN and D2-SPN pairs (25–125-μm separation), normalized to temporally shuffled comparisons, across different speed bins (e) or averaged across resting and moving speed bins (f) and normalized to mean values after vehicle-only treatment. g,h, Effects of vehicle or amphetamine on D1-SPN and D2-SPN Ca2+ event amplitudes across different speed bins (g) or averaged between resting and moving speed bins (h) and normalized to mean values after vehicle-only treatment. Data are expressed as mean ± s.e.m. (n = 18 D1-Cre and n = 17 A2A-Cre mice; ****P < 10−4 and ***P < 10−3 for comparison to vehicle treatment; two-way ANOVA with Holm–Sidak’s multiple comparison test for c,e,g; Wilcoxon, two-tailed signed-rank test for d,f,h). Exact P values for these and all other analyses are in the Supplementary Table. All n values reported within the actual figures or legends refer to the number of mice.
Fig. 2 |
Fig. 2 |. Effects of antipsychotic drugs or a failed drug candidate on behavior and D1-SPN/D2-SPN dynamics.
a, Schematic of recording behavior and Ca2+ activity. b, Mean ± s.e.m. locomotor speed during the 15-min recording period after vehicle or antipsychotic drug treatment and the 45-min recording period after amphetamine treatment (****P < 10−4 for comparison to vehicle treatment; ####P < 10−4 compared to vehicle + amphetamine treatment; one-way ANOVA with Holm–Sidak’s multiple comparison test). c, We injected vehicle or antipsychotic drug 25 min before amphetamine treatment and measured PPI 25 min after amphetamine treatment. d,e, Mean ± s.e.m. percent PPI of startle response at three pre-pulse intensities after vehicle or amphetamine-only treatment (d) and averaged across all pre-pulse intensities after vehicle or high dose of drug + amphetamine treatment (e) (****P < 10−4 for comparison to vehicle treatment; ####P < 10−4 compared to vehicle + amphetamine treatment; two-way ANOVA (d) and one-way ANOVA (e) with Holm–Sidak’s multiple comparison test). f, Mean ± s.e.m. D1-SPN and D2-SPN Ca2+ event rates after vehicle or low/high dose of drug + amphetamine treatment, normalized to values after vehicle-only treatment during periods of rest (left) and movement (right). Heat maps depict the ratio of D1-SPN/D2-SPN activity (D1/D2), normalized to the ratio after vehicle-only treatment, or the vehicle-normalized D1-SPN or D2-SPN event rate after vehicle or high dose of drug + amphetamine treatment, normalized to the corresponding value after vehicle + amphetamine treatment (Drug/Amph). g, Mean ± s.e.m. proximal co-activity of D1-SPNs and D2-SPNs after vehicle or low/high dose of drug + amphetamine treatment, normalized to values after vehicle-only treatment during periods of rest (left) and movement (right). Heat maps depict the vehicle-normalized D1-SPN or D2-SPN proximal co-activity after vehicle or high dose of drug + amphetamine treatment, normalized to the corresponding value after vehicle + amphetamine treatment (for f,g; ***P < 10−3 compared to vehicle treatment; ####P < 10−4, ###P < 10−3, ##P < 10−2 and #P < 0.05 compared to vehicle + amphetamine treatment; one-way ANOVA with Holm–Sidak’s multiple comparison test).
Fig. 3 |
Fig. 3 |. Effects of drugs lacking dopamine receptor affinity on behavior and D1-SPN/D2-SPN dynamics.
a, Mean ± s.e.m. locomotor speed during the 15-min recording period after vehicle or drug treatment and the 45-min recording period after amphetamine treatment (****P < 10−4 and *P < 0.05 for comparison to vehicle treatment; ####P < 10−4 and ###P < 10−3 compared to vehicle + amphetamine treatment; one-way ANOVA with Holm–Sidak’s multiple comparison test). b, Mean ± s.e.m. percent PPI, averaged across all pre-pulse intensities after vehicle or high dose of drug + amphetamine treatment (####P < 10−4 and #P < 0.05 compared to vehicle + amphetamine treatment; one-way ANOVA with Holm–Sidak’s multiple comparison test). c, Mean ± s.e.m. D1-SPN and D2-SPN Ca2+ event rates after vehicle or low/high dose of drug + amphetamine treatment, normalized to values after vehicle-only treatment during periods of rest (left) and movement (right). Heat maps depict the ratio of D1-SPN/D2-SPN activity (D1/D2), normalized to the ratio after vehicle-only treatment, or the vehicle-normalized D1-SPN or D2-SPN event rate after vehicle or high dose of drug + amphetamine treatment, normalized to the corresponding value after vehicle + amphetamine treatment (Drug/Amph). d, Mean ± s.e.m. proximal co-activity of D1-SPNs and D2-SPNs after vehicle or low/high dose of drug + amphetamine treatment, normalized to values after vehicle-only treatment during periods of rest (left) and movement (right). Heat maps depict the vehicle-normalized D1-SPN or D2-SPN proximal co-activity after vehicle or high dose of drug + amphetamine treatment, normalized to the corresponding value after vehicle + amphetamine treatment. ***P < 10−3 compared to vehicle treatment; ####P < 10−4, ###P < 10−3, ##P < 10−2 and #P < 0.05 compared to vehicle + amphetamine treatment; one-way ANOVA with Holm–Sidakʼs multiple comparison test.
Fig. 4 |
Fig. 4 |. Inhibiting D1-SPNs is sufficient to rescue amphetamine-driven behaviors.
a, We injected DIO-hM4D(Gi)-mCherry or DIO-mCherry virus bilaterally at two sites in the DMS of D1-Cre mice. b,c, Treatment with the DREADD agonist DCZ reduced baseline locomotion and attenuated amphetamine-driven hyperlocomotion (b) and PPI disruption (c) in DREADD, but not mCherry-expressing, mice (**P < 10−2 for comparison to vehicle-only treatment; ####P < 10−4 and ##P < 10−2 compared to vehicle + amphetamine treatment; two-way ANOVA (b) and one-way ANOVA (c) with Holm–Sidak’s multiple comparison test). d, Schematic of hallucination-like perception assay in which mice initiate trials by nose poking in the center port and choosing the left or right reward port depending on whether a tone is or is not embedded in the background white noise (created with BioRender). eg, Psychometric function of the percentage of ‘heard signal’ choice (e), false alarm (FA) rate (f) and FA investment times (g) after vehicle or amphetamine treatment with or without haloperidol or DCZ pre-treatment. Data in e are mean ± 1 s.d. binomial confidence intervals and mean ± s.e.m. in f and g (####P < 10−4, ###P < 10−3, ##P < 10−2 and #P < 0.05 compared to vehicle + amphetamine treatment; one-way ANOVA with Holm–Sidak’s multiple comparison test).
Fig. 5 |
Fig. 5 |. Effects of D1R-targeted compounds on behavior and D1-SPN/D2S-PN dynamics.
a, Mean ± s.e.m. locomotor speed during the 15-min recording period after vehicle or drug treatment and the 45-min recording period after amphetamine treatment (****P < 10−4 for comparison to vehicle treatment; ####P < 10−4 compared to vehicle + amphetamine treatment; one-way ANOVA with Holm–Sidak’s multiple comparison test). b, Mean ± s.e.m. percent PPI, averaged across all pre-pulse intensities after vehicle or high dose of drug + amphetamine treatment (####P < 10−4 and ###P < 10−3 compared to vehicle + amphetamine treatment; one-way ANOVA with Holm–Sidak’s multiple comparison test). c, Mean ± s.e.m. D1-SPN and D2-SPN Ca2+ event rates after vehicle or low/high dose of drug + amphetamine treatment, normalized to values after vehicle-only treatment during periods of rest (left) and movement (right). Heat maps depict the ratio of D1-SPN/D2-SPN activity (D1/D2), normalized to the ratio after vehicle-only treatment, or the vehicle-normalized D1-SPN or D2-SPN event rate after vehicle or high dose of drug + amphetamine treatment, normalized to the corresponding value after vehicle + amphetamine treatment (Drug/Amph). d, Mean ± s.e.m. proximal co-activity of D1-SPNs and D2-SPNs after vehicle or low/high dose of drug + amphetamine treatment, normalized to values after vehicle-only treatment during periods of rest (left) and movement (right). Heat maps depict the vehicle-normalized D1-SPN or D2-SPN proximal co-activity after vehicle or high dose of drug + amphetamine treatment, normalized to the corresponding value after vehicle + amphetamine treatment (***P < 10−3 compared to vehicle treatment; ####P < 10−4, ###P < 10−3, ##P < 10−2 and #P < 0.05 compared to vehicle + amphetamine treatment; one-way ANOVA with Holm–Sidak’s multiple comparison test).
Fig. 6 |
Fig. 6 |. Antipsychotic efficacy is better explained by a drug’s effects on D1-SPN than D2-SPN activity levels.
a,b, Hierarchical clustering of drugs based on their highest dose effects on D1-SPN (a) or D2-SPN (b) activity levels under normal and hyperdopaminergic conditions. Veh, vehicle.

References

    1. Carlsson A. & Lindqvist M. Effect of chlorpromazine or haloperidol on formation of 3methoxytyramine and normetanephrine in mouse brain. Acta Pharmacol. Toxicol. (Copenh.) 20, 140–144 (1963). - PubMed
    1. Creese I, Burt DR & Snyder SH Dopamine receptor binding predicts clinical and pharmacological potencies of antischizophrenic drugs. Science 192, 481–483 (1976). - PubMed
    1. Matthysse S. Dopamine and the pharmacology of schizophrenia: the state of the evidence. J. Psychiatr. Res. 11, 107–113 (1974). - PubMed
    1. Meltzer HY, Matsubara S. & Lee JC Classification of typical and atypical antipsychotic drugs on the basis of dopamine D-1, D-2 and serotonin2 pKi values. J. Pharmacol. Exp. Ther. 251, 238–246 (1989). - PubMed
    1. Davies MA, Sheffler DJ & Roth BL Aripiprazole: a novel atypical antipsychotic drug with a uniquely robust pharmacology. CNS Drug Rev. 10, 317–336 (2004). - PMC - PubMed

Publication types

LinkOut - more resources