. 2023 Aug;24(8):1331-1344.
doi: 10.1038/s41590-023-01553-7. Epub 2023 Jul 13.

Transcription factor EGR2 controls homing and pathogenicity of TH17 cells in the central nervous system

Affiliations

Transcription factor EGR2 controls homing and pathogenicity of TH17 cells in the central nervous system

Yuanyuan Gao et al. Nat Immunol. 2023 Aug.

Abstract

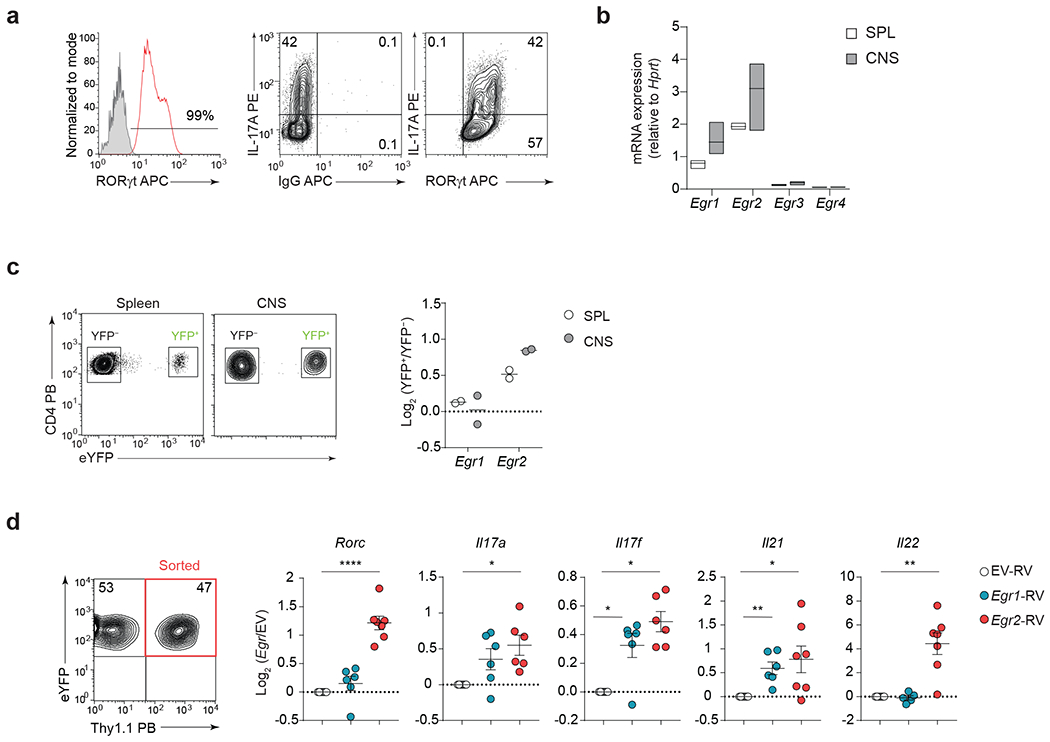
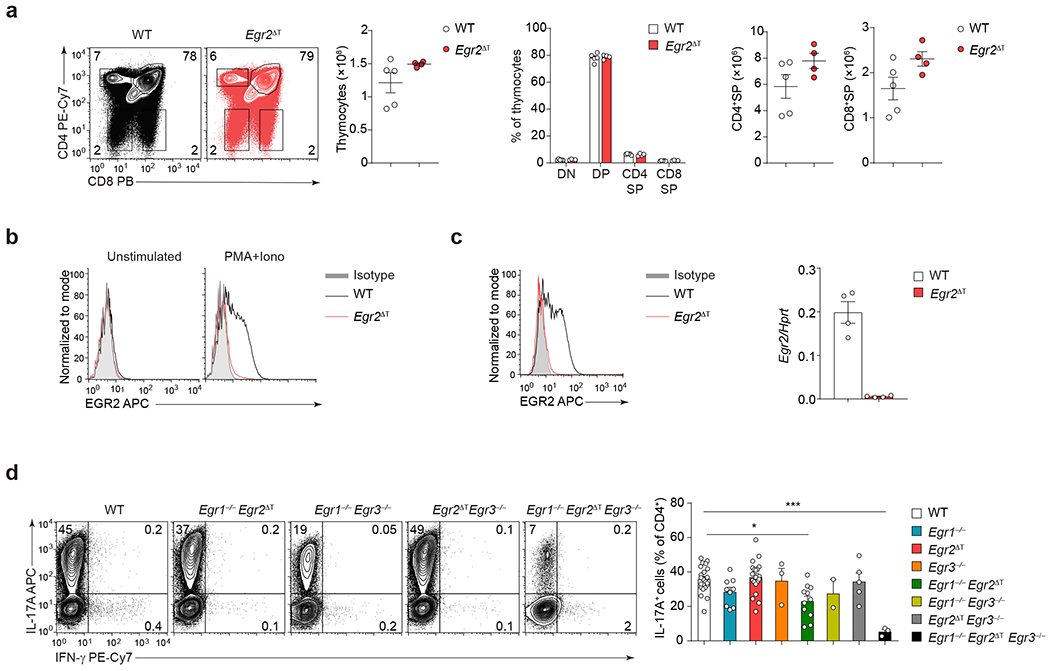
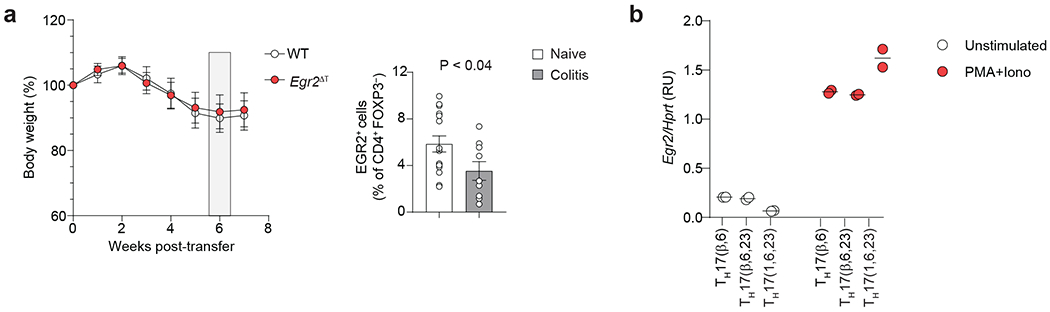
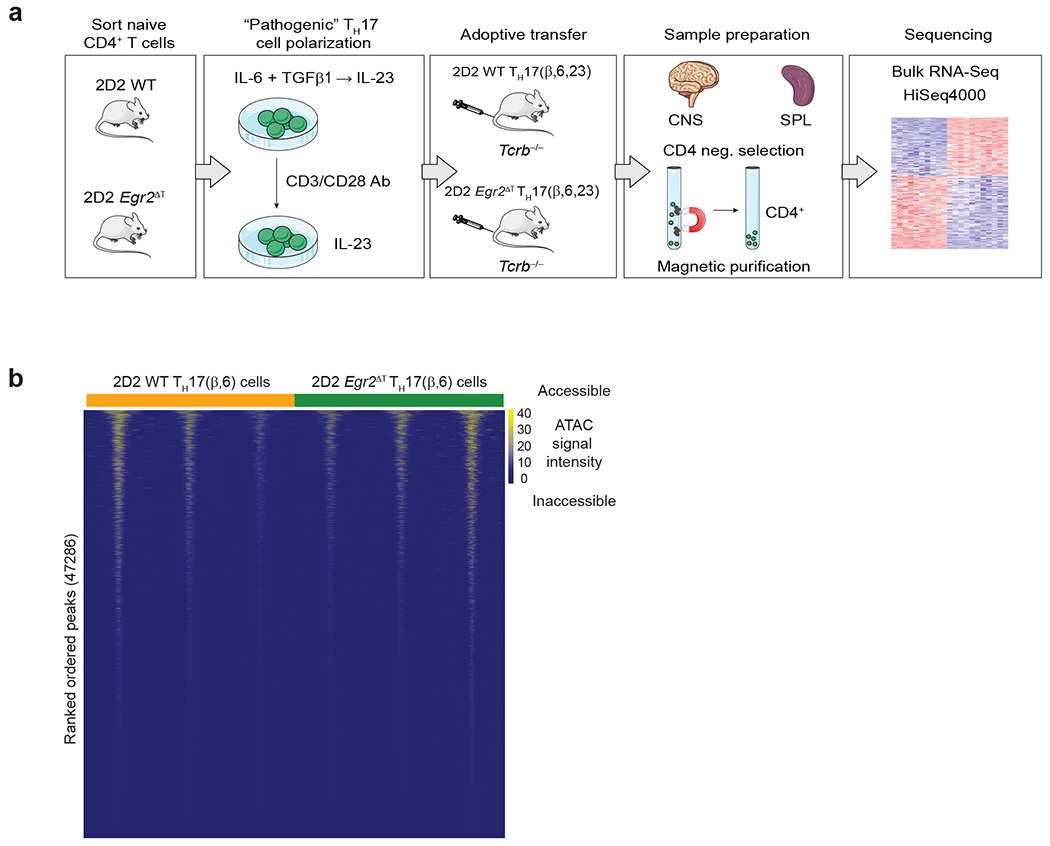
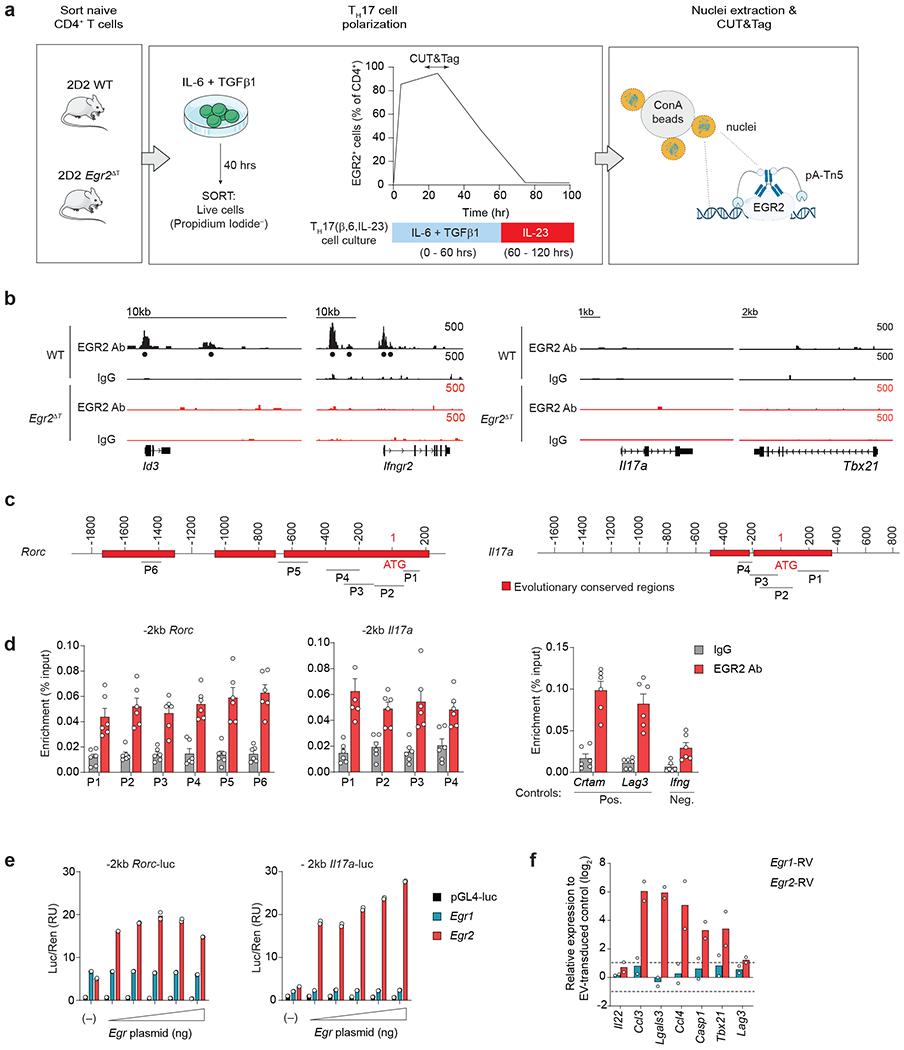
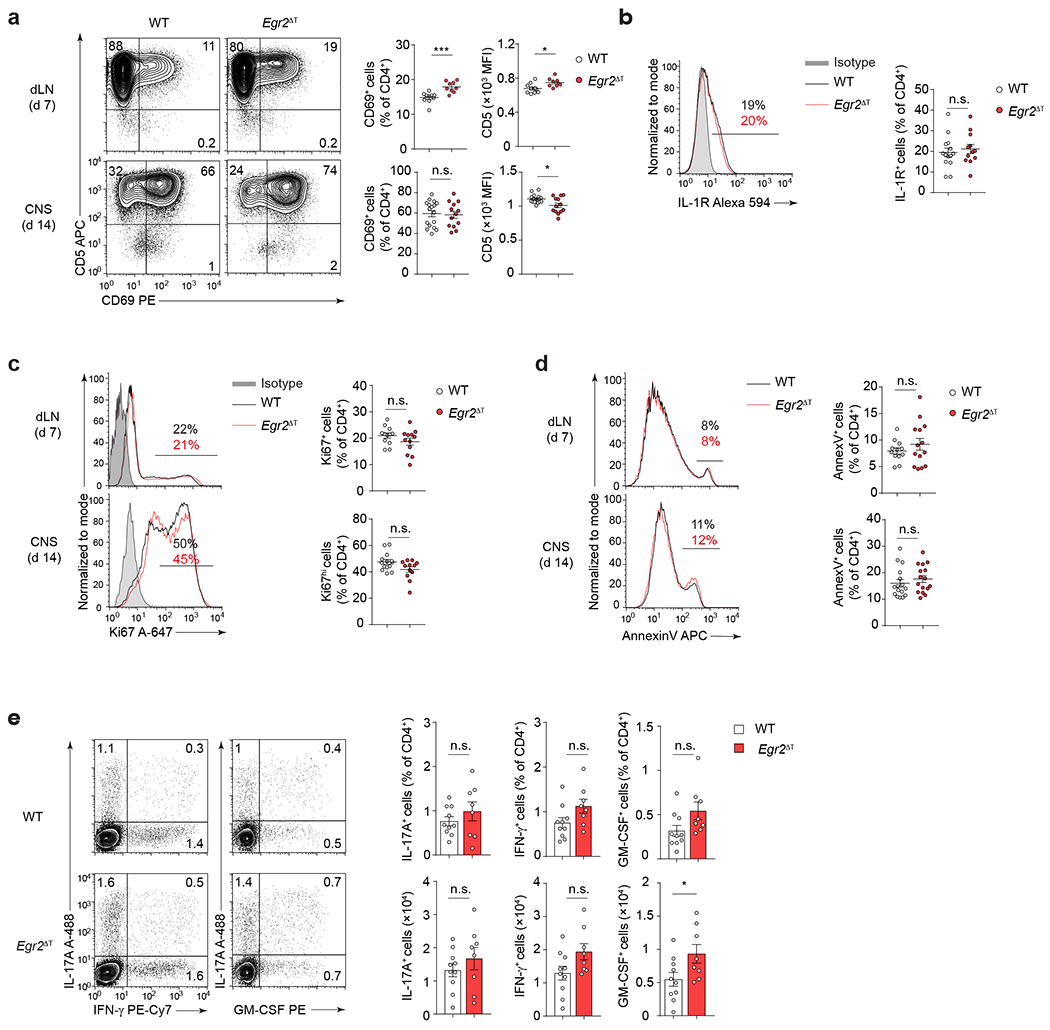
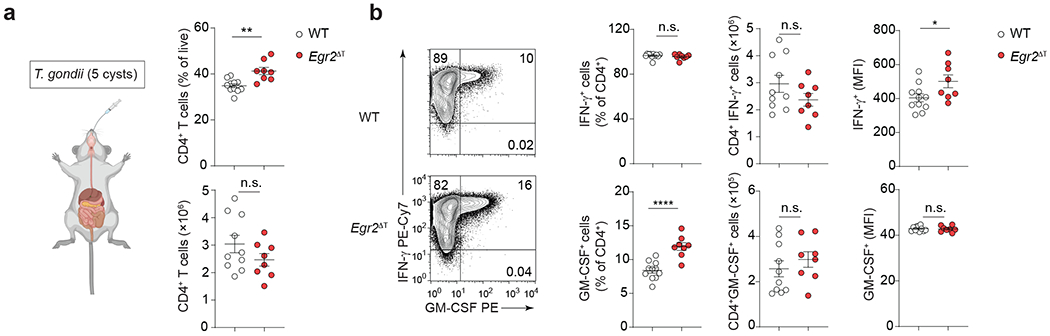
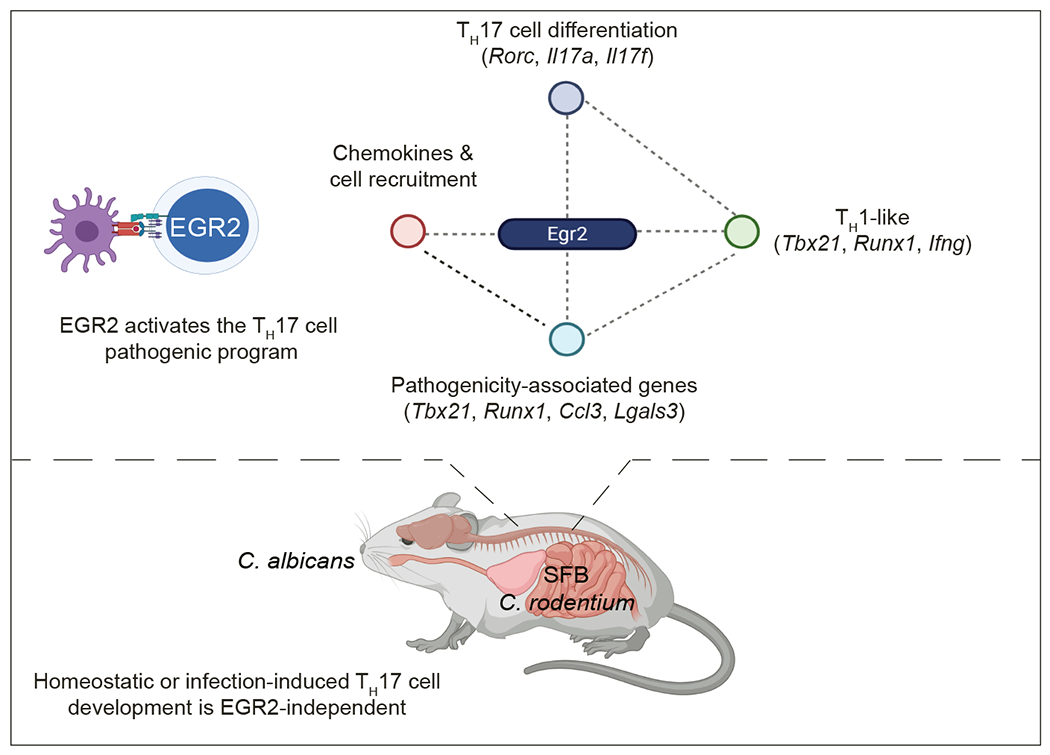
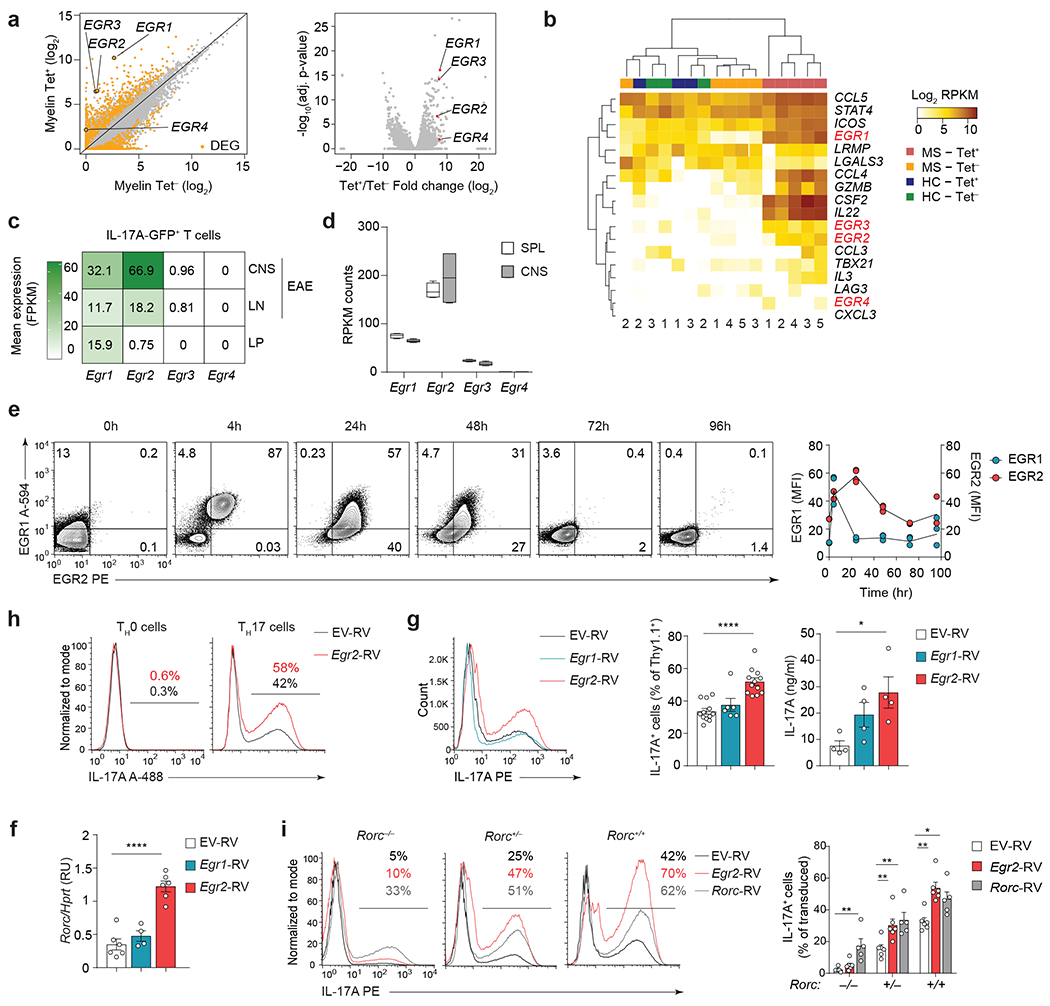
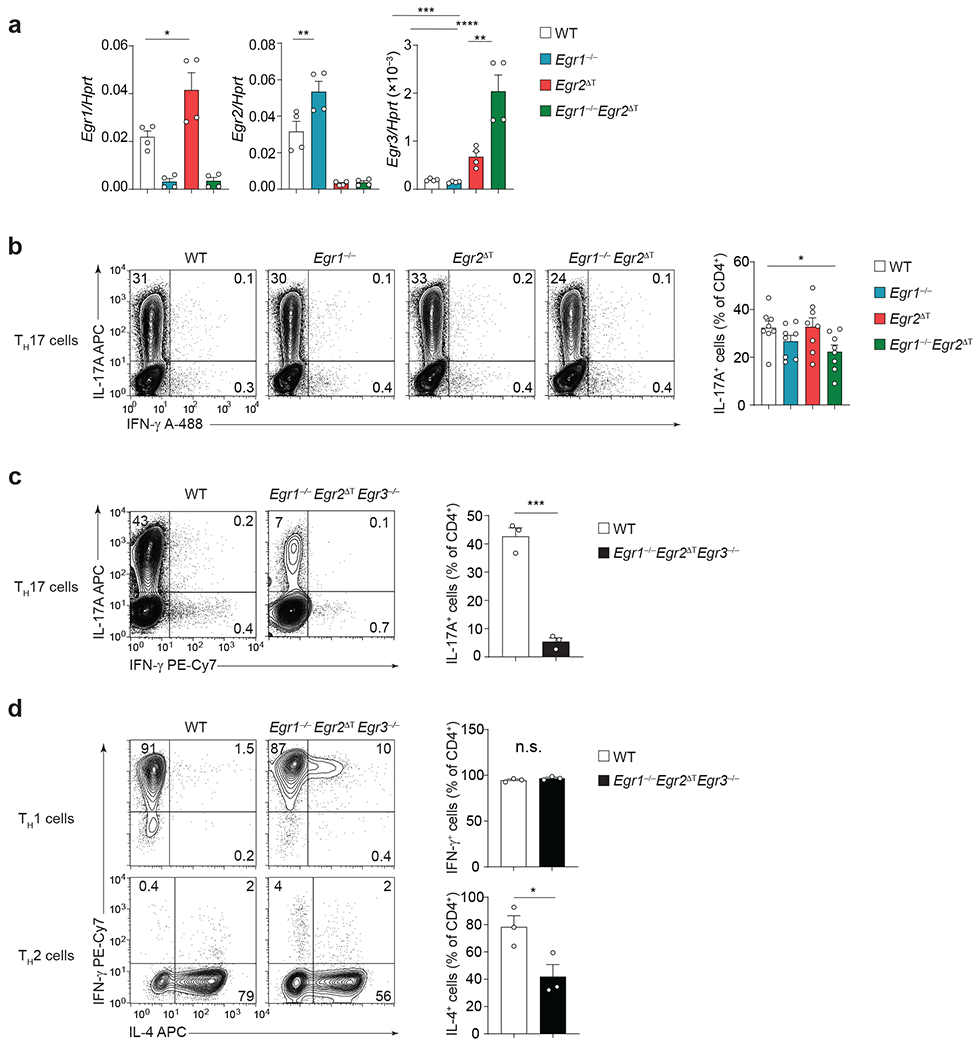
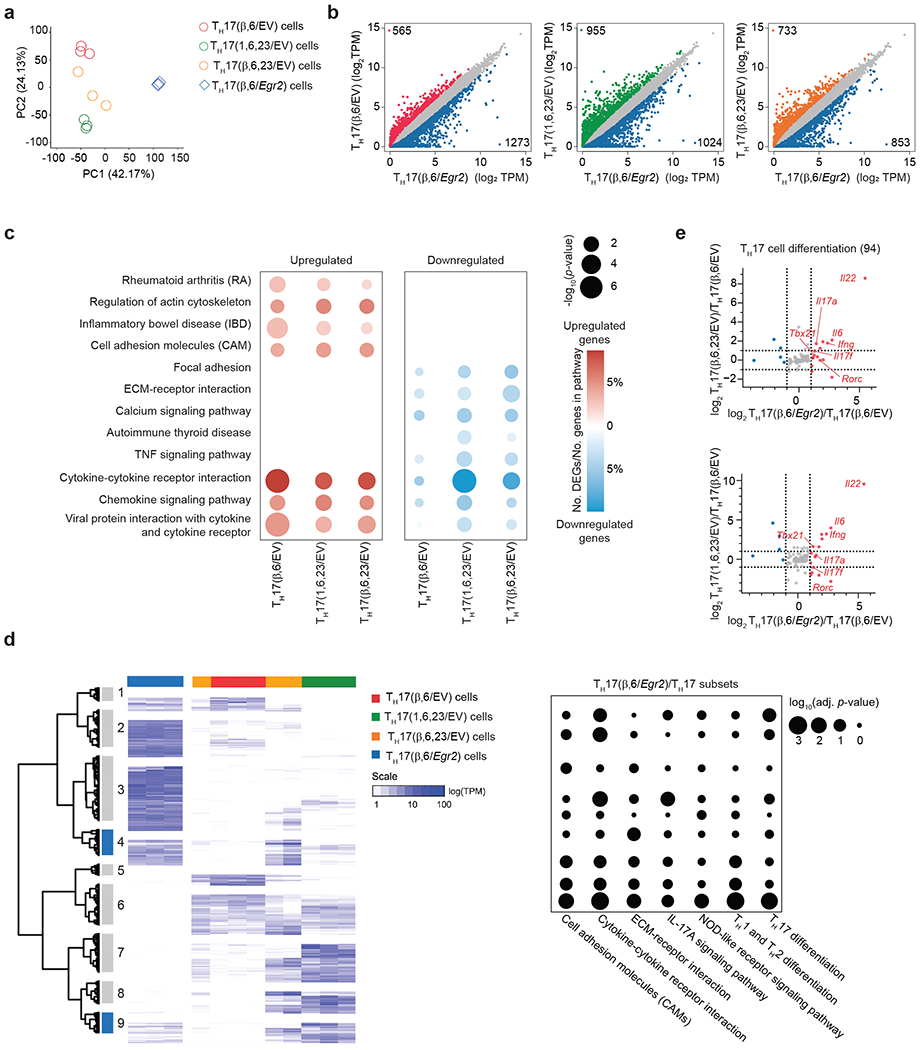
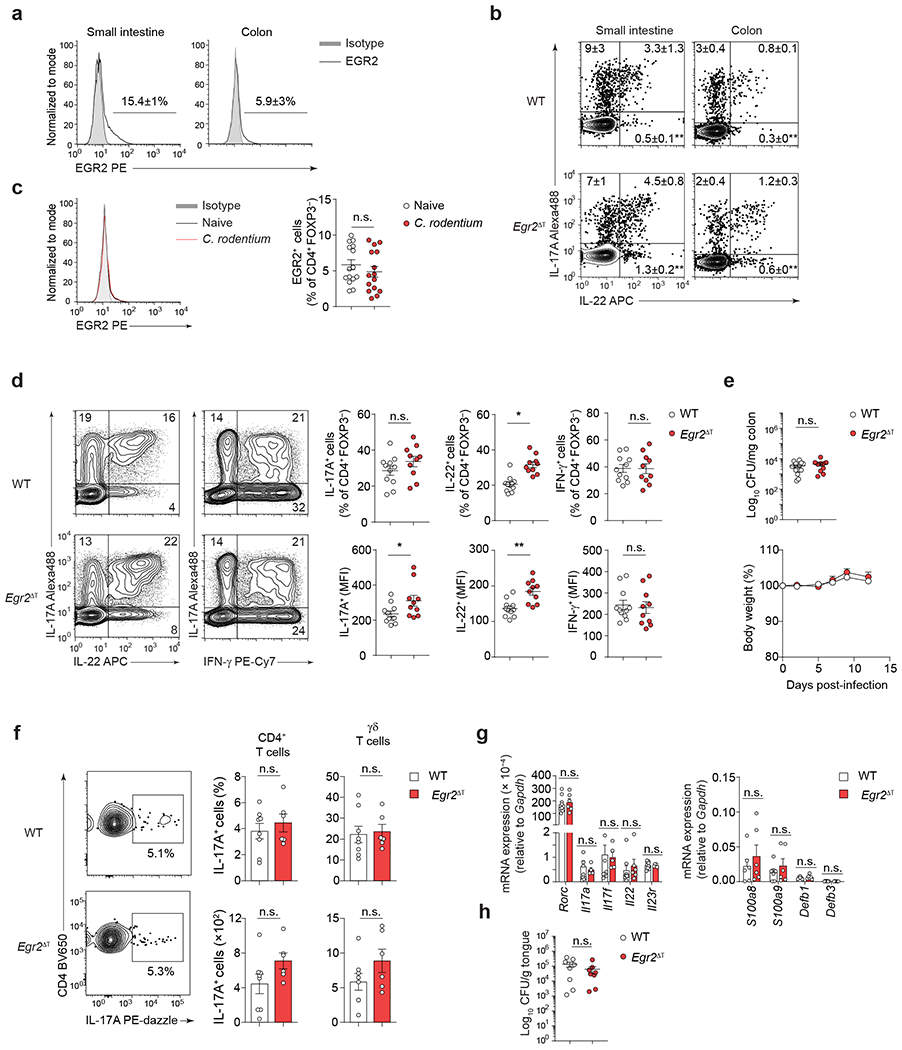
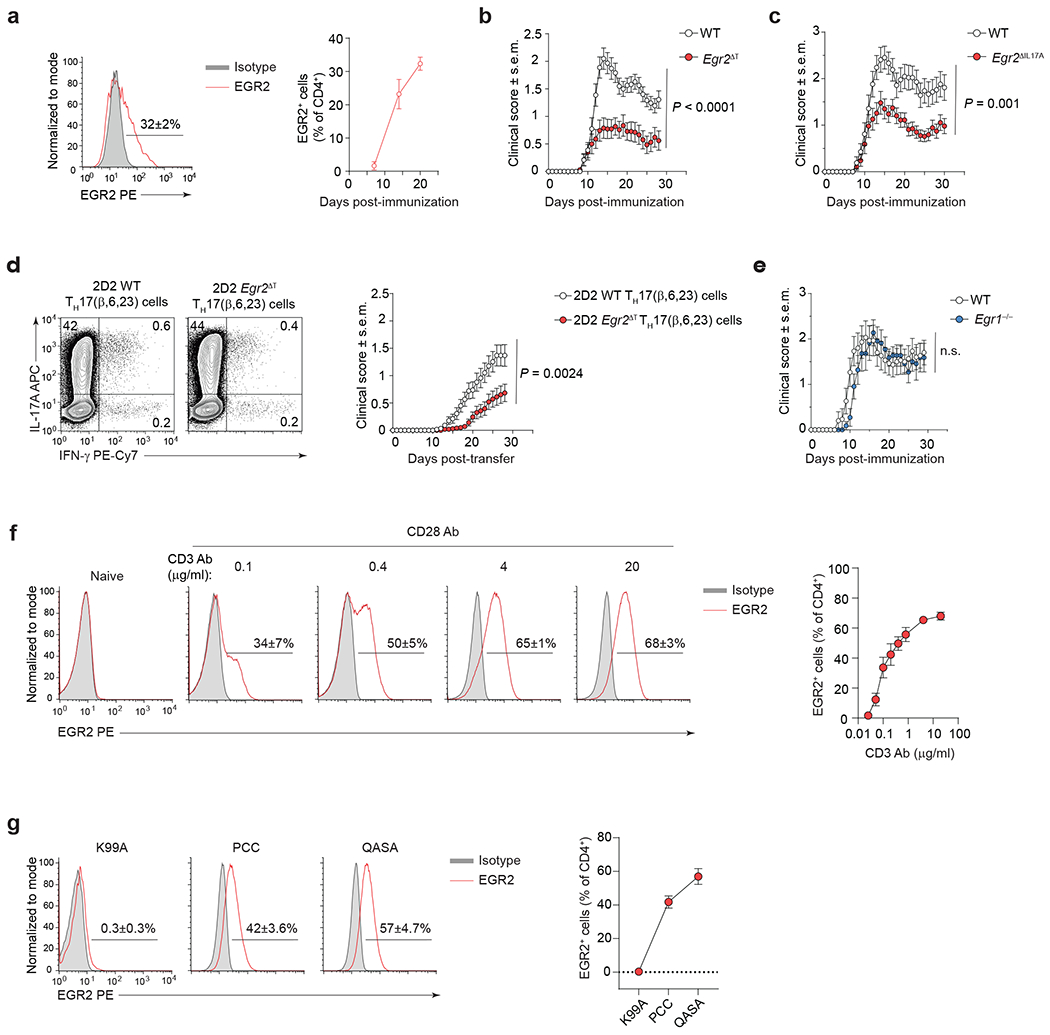
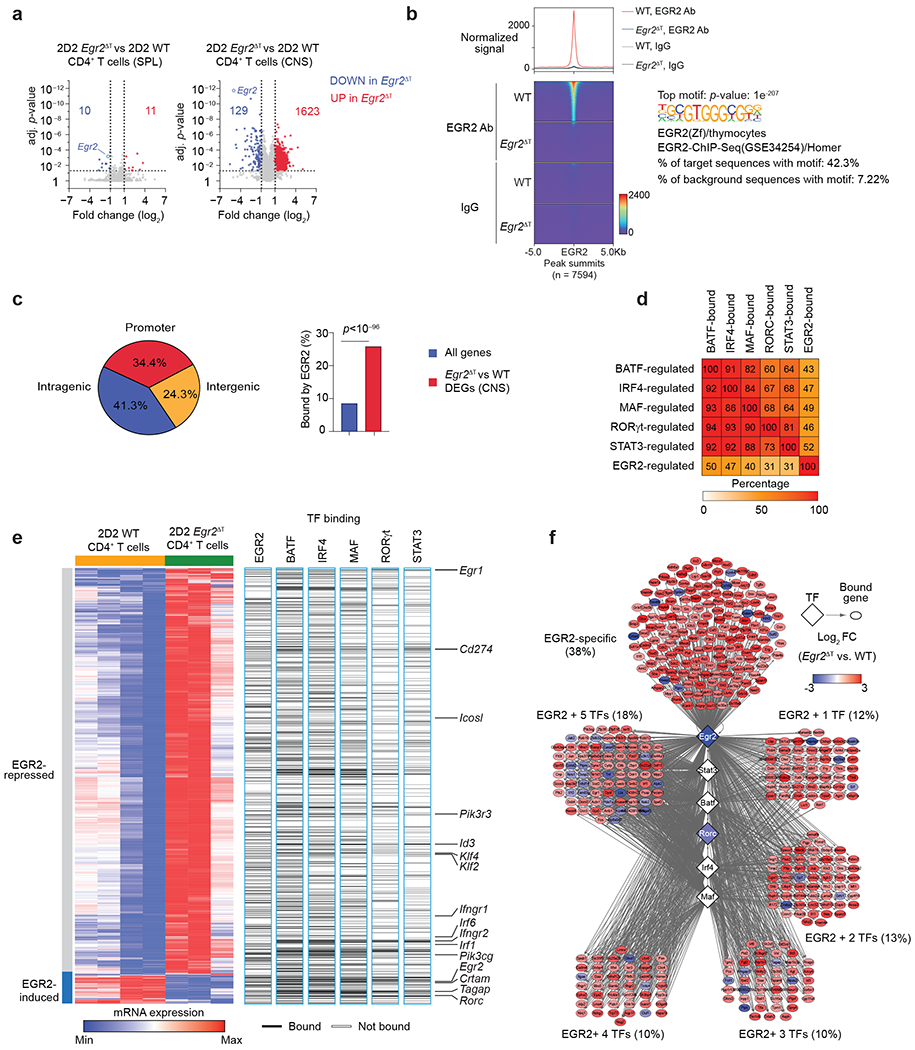
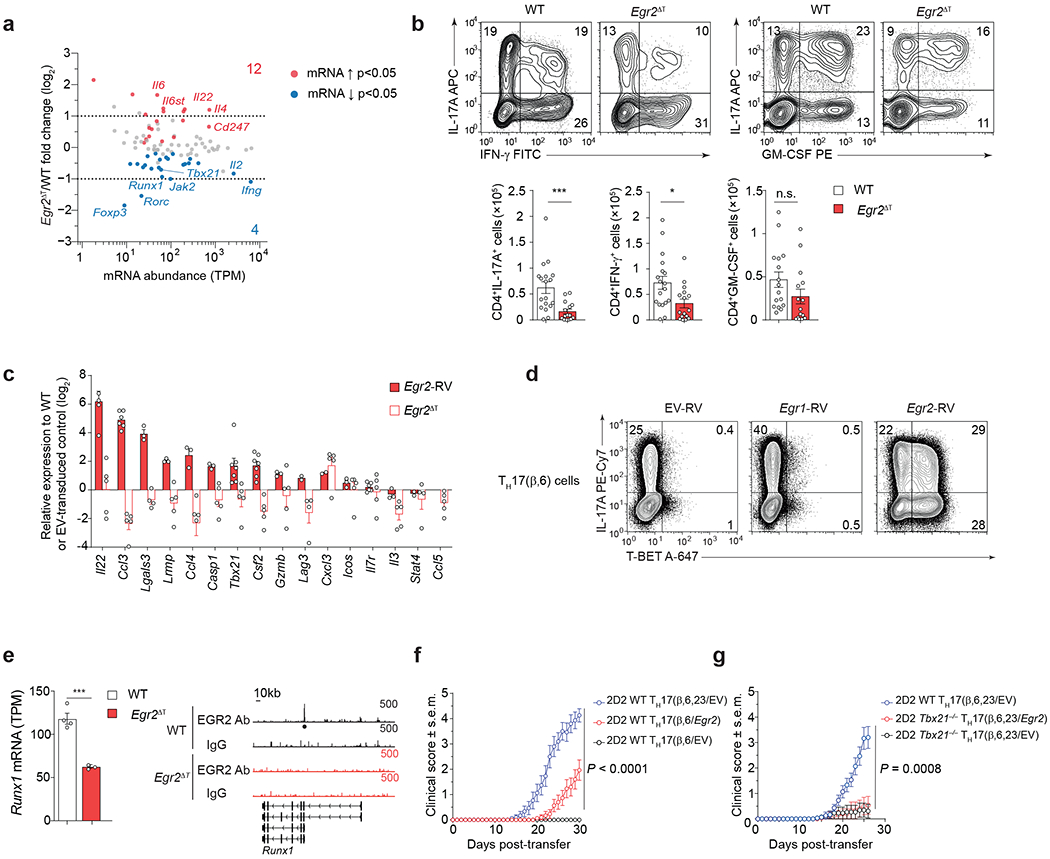
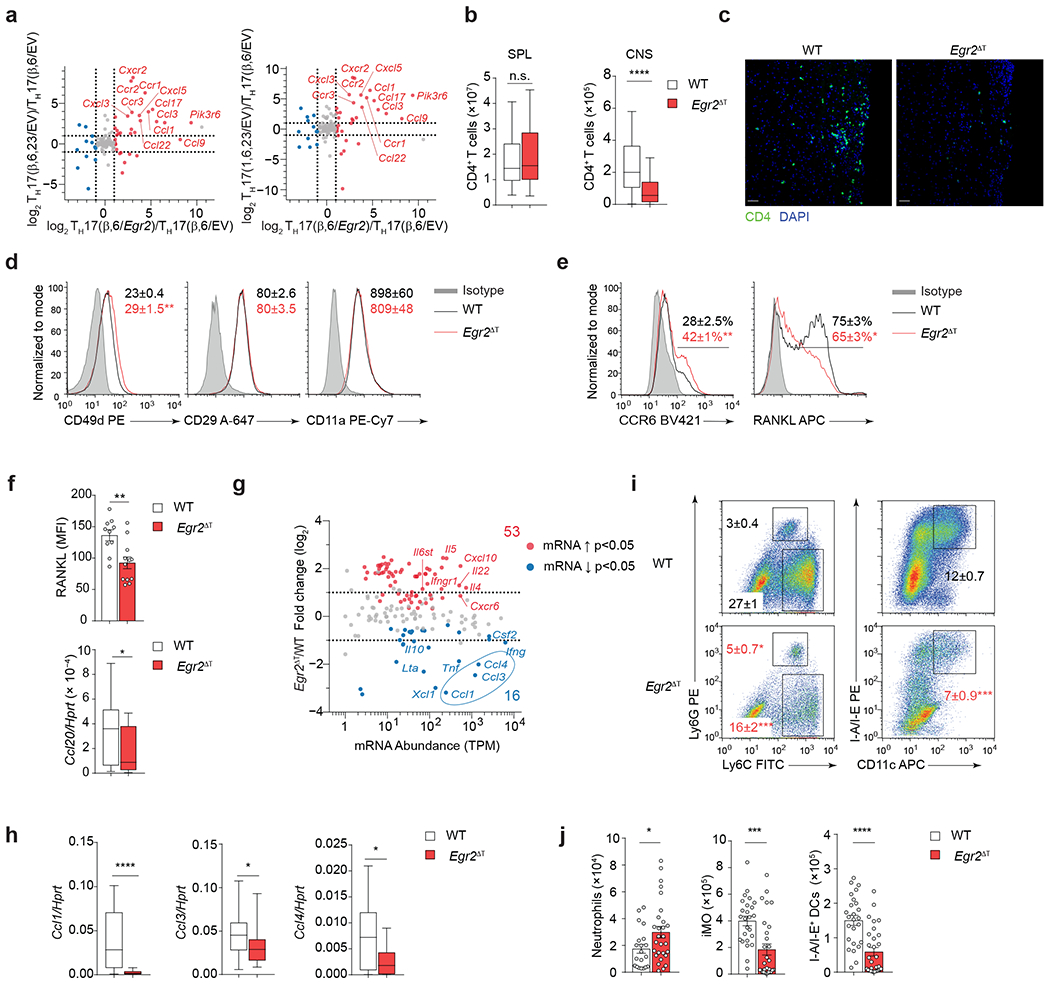
CD4+ T helper 17 (TH17) cells protect barrier tissues but also trigger autoimmunity. The mechanisms behind these opposing processes remain unclear. Here, we found that the transcription factor EGR2 controlled the transcriptional program of pathogenic TH17 cells in the central nervous system (CNS) but not that of protective TH17 cells at barrier sites. EGR2 was significantly elevated in myelin-reactive CD4+ T cells from patients with multiple sclerosis and mice with autoimmune neuroinflammation. The EGR2 transcriptional program was intricately woven within the TH17 cell transcriptional regulatory network and showed high interconnectivity with core TH17 cell-specific transcription factors. Mechanistically, EGR2 enhanced TH17 cell differentiation and myeloid cell recruitment to the CNS by upregulating pathogenesis-associated genes and myelomonocytic chemokines. T cell-specific deletion of Egr2 attenuated neuroinflammation without compromising the host's ability to control infections. Our study shows that EGR2 regulates tissue-specific and disease-specific functions in pathogenic TH17 cells in the CNS.


Conflict of interest statement

Competing Interest Statement

The authors declare no competing interests.

Figures

Extended Data Fig. 1
Extended Data Fig. 1. EGR2 reinforces TH17 differentiation program in a RORgt-dependent manner
a, Representative flow plots showing the frequencies of RORγt- and IL-17A-expressing 2D2 TH17(β,6,23) cells before the adoptive transfer. Data are representative of n = 3 independent experiments. b, Quantitative RT-PCR analysis of Egr1, Egr2, Egr3, and Egr4 mRNA expression in pathogenic 2D2 WT CD4+ T cells from the CNS of Tcrb−/− mice that received 2D2 WT TH17(β,6,23) cells (20 days post-transfer). Box plot depicts median (line), lower and upper quartiles. Data represent biologically independent replicates from n = 3 independent experiments. c, Quantitative RT-PCR analysis of Egr1 and Egr2 mRNA expression in sorted YFP+ and YFP CD4+ T cell populations isolated from the spleen and CNS of MOG35-55 immunized Il17a-Cre R26ReYFP fate-mapping mice. Data are presented as the log2 fold-change in the relative expression of Egr1 and Egr2 in YFP+ over YFP CD4+ T cells. Data represent biologically independent replicates from n = 2 independent experiments. d, Quantitative RT-PCR analysis of Rorc, Il17a, Il17f, Il21 and Il22 mRNA in TH17 (β,6) cells transduced with empty virus (EV-RV), or retroviruses expressing Egr1 (Egr1-RV) or Egr2 (Egr2-RV). Mean values ± s.e.m. are reported. Data represent biologically independent replicates from n = 6 independent experiments. ****P < 0.0001, **P < 0.01, *P < 0.05; two-tailed Student’s t-test.
Extended Data Fig. 2
Extended Data Fig. 2. EGRs function redundantly during TH17 cell differentiation
a, Frequency of DN (CD4CD8), DP (CD4+CD8+), CD4SP (CD4+CD8) and CD8SP (CD4CD8+) thymocytes, and absolute numbers of total thymocytes, CD4SP and CD8SP, in 8-wk old WT (n = 5) and Egr2ΔT (n = 4) mice from 2 independent experiments. b, Histograms showing ex vivo EGR2 protein expression in unstimulated and stimulated (PMA+Iono) splenic WT and Egr2ΔT CD4+ T cells; n = 2 independent experiments. c, EGR2 protein expression (left) and Egr2 mRNA abundance (right) in WT and Egr2ΔT TH17 cells (IL-6 + TGF-β1) following PMA+Iono stimulation. Data represent biologically independent replicates from (n = 4) independent experiments. d, Representative contour plots and bar graphs depict the frequency of IL-17A-producing WT (n = 22), Egr1−/− (n = 9), Egr2ΔT (n = 20), Egr3−/− (n = 3), Egr1−/−Egr2ΔT (n = 11), Egr1−/−Egr3−/− (n = 2), Egr2ΔTEgr3−/− (n = 5) and Egr1−/−Egr2ΔTEgr3−/− (n = 3) CD4+ T cells cultured under TH17-cell polarizing conditions as in c. **P < 0.01, *P < 0.05, two-tailed Student’s t-test. Mean values ± s.e.m. are shown in a, c, d.
Extended Data Fig. 3
Extended Data Fig. 3. EGR2 is not expressed in CD4+ T cells during colitis
a, (Left) Combined weight loss curve of Rag2−/− recipients after intraperitoneal injection of naive CD45RBhiCD25 CD4+ T cells isolated from WT (n = 15) or Egr2ΔT (n = 15) mice. Data are presented as percent of original body weight (measured on day 0). Combined data from n = 5 independent experiments. (Right) Bar graph depicts the frequency of EGR2+ CD4+FOXP3 T cells isolated from the colon of healthy (naive) WT (n = 15) mice and Rag2−/− recipients of naïve WT CD4+ T cells at 6 weeks post-transfer (colitis) (n = 9); combined data from 5 (naïve) and 3 (colitis) independent experiments. b, RT-PCR analysis of Egr2 mRNA expression in unstimulated or stimulated (PMA+Iono) TH17(β,6), TH17(β,6,23) and TH17(1,6,23) cells. Egr2 mRNA was normalized to the house-keeping Hprt gene. Data represent biologically independent replicates per condition from n = 2 independent experiments. Mean values ± s.e.m. are reported in a-b.
Extended Data Fig. 4
Extended Data Fig. 4. EGR2 does not control chromatin accessibility in TH17 cells
a, Bulk RNA-seq Workflow. Naïve 2D2 WT and 2D2 Egr2ΔT CD4+ T cells were activated and differentiated under pathogenic TH17 cell-polarizing conditions (TH17(β,6,23)) for 5 days. Differentiated TH17(β,6,23) cells were reactivated by plate-bound CD3+CD28 antibodies in the presence of IL-23 for 48h before adoptive transfer into Tcrb−/− recipients. At the peak of the disease (day 20 post-transfer), donor CD4+ T cells were purified from spleens and CNS of the Tcrb−/− recipient mice using CD4 negative selection for RNA profiling and library was sequenced on a HiSeq4000. Three independent experiments were performed. b, Heatmap illustrating dynamics of chromatin accessibility in 2D2 WT and 2D2 Egr2ΔT TH17(β,6) cells (GSE224960). Data represent n = 3 biologically independent replicates per condition.
Extended Data Fig. 5
Extended Data Fig. 5. EGR2 binds to and transactivates Rorc and Il17a promoters
a, CUT&Tag Workflow. CUT&Tag sequencing was performed on nuclei isolated from live (propidium iodide sorted) 2D2 WT and 2D2 Egr2ΔT TH17(β,6) cells at the peak of EGR2 expression (40h post-activation) using EGR2 antibody or IgG control. b, (Left) Genome browser tracks at Id3 and Ifngr2, showing EGR2 binding in 2D2 WT TH17(β,6) cells. (Right) Genome browser tracks at Il17a and Tbx21 showing no EGR2 binding in 2D2 WT TH17(β,6) cells. c, Evolutionary conserved regions (ECRs) and EGR binding sites within each ECR of Rorc and Il17a genes were analyzed using ECR browser (https://ecrbrowser.dcode.org/) and JASPAR (http://jaspar.genereg.net/). ChIP primers (P) to determine EGR2 binding to predicted EGR binding sites were designed using Primer3 (http://bioinfo.ut.ee/primer3-0.4.0/). d, EGR2 ChIP-PCR analysis of 2D2 TH17(β,6) cells 48h after activation with plate-bound CD3+CD28 antibodies, showing EGR2-specific binding to Rorc and Il17a promoters. Crtam intron and Lag3 core promoters were used as positive controls. Ifng promoter and IgG control antibody were used as negative controls. Results are presented as percent of input DNA. Data are shown as mean ± s.e.m. and represent biologically independent replicates from n = 3 independent experiments. e, Firefly luciferase activity (normalized to Renilla) driven by the 2kb genomic DNA sequences upstream of the start codon (ATG) of Rorc and Il17a was measured in the presence of increasing doses of Egr1- or Egr2-expressing plasmids in HEK293 cells. Data represent technical duplicates and are representative of n = 3 independent experiments. f, Quantitative RT-PCR analysis of ‘pathogenicity-associated’ genes in TH17(β,6) cells transduced with Egr1-RV or Egr2-RV and normalized to empty virus (EV-RV)-transduced control TH17(β,6) cells. RT-PCR analysis was performed on RNA isolated from sorted retrovirally-transduced cells. Data represent biologically independent replicates per condition from n = 2 independent experiments.
Extended Data Fig. 6
Extended Data Fig. 6. EGR2 is not required for CD4+ T cell activation
a, CD5 and CD69 protein expression (MFI, frequency) in CD4+ T cells isolated from draining lymph nodes (dLN) and CNS of WT (n = 17) and Egr2ΔT (n = 13) mice following immunization with MOG35-55/CFA and Pertussis toxin. ***P < 0.001, *P < 0.05, n.s. = not significant, two-tailed Mann-Whitney U test. b, IL-1R expression in CNS-infiltrating CD4+ T cells from WT (n = 14) and Egr2ΔT (n = 12) mice 14 days post-immunization as in a. n.s. = not significant, two-tailed Student’s t-test. c-d, Expression of Ki67 marker of proliferation (c) and Annexin V marker of apoptosis (d) in CD4+ T cells isolated from draining lymph nodes and CNS of WT (n = 14, Ki67; n = 16, AnnexinV) and Egr2ΔT (n = 12, Ki67; n = 16, AnnexinV) mice post-immunization as in a. n.s. = not significant, two-tailed Student’s t-test. e, Contour plots depict representative intracellular cytokine staining for IL-17A, IFN-γ and GM-CSF and bar graphs summarize the frequency and the absolute numbers of IL-17A-, IFN-γ- and GM-CSF-producing CD4+ T cells in the draining lymph nodes of WT (n = 10) and Egr2ΔT (n = 8) mice 7 days post-immunization as in a; Data are represented as mean± s.e.m. and are combined from 3 (a-d) and 2 (e) independent experiments.
Extended Data Fig. 7
Extended Data Fig. 7. EGR2 is not required for TH1 cell migration to CNS
a, Percentage and number of CD4+ T cells in the CNS of Toxoplasma gondii infected WT (n = 10) and Egr2ΔT (n = 8) mice (14 days post-infection). **P < 0.01, n.s. = not significant, two-tailed unpaired Student t-test. b, Cytokine production by CD4+ T cells in spleen and CNS of WT (n = 10) and Egr2ΔT (n = 8) mice (14 days post-infection). Mean values ± s.e.m. are reported, combined data from 2 independent experiments (a-b). ****P < 0.0001, *P < 0.05, n.s. = not significant, two-tailed Student’s t-test.
Extended Data Fig. 8
Extended Data Fig. 8. EGR2 drives regulatory network in pathogenic TH17 cells.
EGR2-regulated module of the TH17 differentiation program controls TH17 cell migration, recruitment of myelomonocytic cells, and the expression of pathogenicity-associated genes.
Extended Data Fig. 9
Extended Data Fig. 9. Gating strategy
Live cells were identified by their negative staining for the live/dead marker in comparison to FSC-H. Single cells were gated based on their FSC-W versus FSC-H parameters, while lymphocytes were distinguished by their size, using SSC-H versus FSC-H. CD4+ T cells were further characterized by their co-expression of CD4 and TCRβ, and in the intestine, they were further classified as FOXP3 Teff cells or FOXP3+ Treg cells. Monocytes, neutrophils, and dendritic cells were identified using the previously described gating strategy.
Fig. 1 |
Fig. 1 |. EGR2 reinforces the TH17 transcriptional program
a, Scatter plot (left) and volcano plot (right) showing expression of EGR transcription factors in CCR6+ CD4+ T memory cells from HLA-DR4+ MS patients that bind to MOG97-109-loaded DR4 tetramers (Tet+) compared to CCR6+ memory CD4+ T cells from the same patients that do not bind to MOG97-109-loaded DR4 tetramers (Tet) (GSE66763). b, Clustering of EGR transcription factors with previously defined TH17 cell pathogenicity-associated genes in MOG97-109-Tet+ or Tet CCR6+ CD4+ T memory cells from HLA-DR4+ MS patients (MS Tet+ vs MS Tet) and MOG97-109-Tet+ or Tet CCR6+ CD4+ T memory cells from HLA-DR4+ healthy controls (HC Tet+ vs HC Tet) (GSE66763). c, Expression levels of Egr1, Egr2, Egr3 and Egr4 transcripts in sorted IL-17A-GFP+ CD4+ T cells isolated from the CNS and LNs of MOG35-55-immunized Il17a-GFP reporter mice at the peak of EAE disease (day 15 post- immunization), and IL-17A-GFP+ CD4+ T cells isolated from the lamina propria of healthy Il17a-GFP reporter mice (GSE75105, GSE75106). Data are shown as fragments per kilobase of exon per million mapped fragments (FPKM). d, Expression levels of Egr1, Egr2, Egr3 and Egr4 transcripts in pathogenic MOG35-55 TCR transgenic (2D2) WT CD4+ T cells from the CNS of Tcrb−/− mice that received 2D2 WT TH17(β,6,23) cells (20 days post-transfer). Box plot depicts median (line), lower and upper quartiles, and whiskers depict 1 and 99 percentile values; n = 4 independent experiments (GSE168288). Data are shown as reads per kilobase per million (RPKM). e, Intranuclear staining of EGR1 and EGR2 proteins in wild-type naive CD62LhiCD25 2D2 CD4+ T cells and 2D2 CD4+ T cells activated with plate-bound CD3+CD28 antibodies in the presence of TH17 cell-polarizing cytokines (IL-6+TGF-β1); n = 2 TH17 cultures examined in 2 independent experiments. f, Quantitative RT-PCR analysis of Rorc mRNA in TH17 cells transduced with empty virus (EV-RV), or retroviruses expressing Egr1 (Egr1-RV) or Egr2 (Egr2-RV). Combined data from n = 6 (EV-RV), n = 4 (Egr1-RV) and n = 6 (Egr2-RV) independent experiments. ****P < 0.0001; One-way ANOVA, followed by two-tailed unpaired Student’s t-test. g, Frequency of IL-17A+ cells (left) and production of IL-17A as measured by ELISA (right) in TH17 cells (IL-6+TGF-β1) transduced with EV-RV, Egr1-RV or Egr2-RV following 4h PMA+Iono stimulation. Combined data from n = 11 (EV-RV), n = 6 (Egr1-RV) and n = 11 (Egr2-RV) independent experiments and from n = 4 independent experiments (ELISA). ****P < 0.0001, *P < 0.05; One-way ANOVA, followed by two-tailed unpaired Student’s t-test. h, Intracellular staining for IL-17A in CD4+ T cells transduced with EV-RV, Egr1-RV or Egr2-RV under TH0 (IL-2) or TH17 cell-polarizing conditions (IL-6+TGF-β1). Histograms represent the frequency of IL-17A-producing cells within retrovirally-transduced CD4+ T cells. Data are representative for n = 3 independent experiments. i, IL-17A production in Rorc−/−, Rorc+/− and Rorc+/+ CD4+ T cells (on Bcl2l1Tg background) transduced with EV-RV, Egr2-RV or Rorc-RV under TH17 cell-polarizing conditions (IL-6+TGF-β1). The histograms and bar graphs represent the frequency of IL-17A-producing cells within retrovirally-transduced CD4+ T cells; n = 6 independent experiments. **P < 0.01, *P < 0.05; One-way ANOVA, followed by two-tailed unpaired Student’s t-test. Data are presented as mean ± s.e.m. in f,g, and i.
Fig. 2 |
Fig. 2 |. EGR2 is not required for TH17 lineage commitment
a, Quantitative RT-PCR analysis of Egr1, Egr2 and Egr3 mRNA expression in wild-type (WT), Egr1−/−, Egr2ΔT and Egr1−/−Egr2ΔT CD4+ T cells cultured with IL-6+TGF-β1 (TH17 cell-polarizing conditions) for 5 days, following ex vivo 4h stimulation with PMA+Iono; n = 4 from 2 independent experiments. *P < 0.05, **P = 0.0011, ***P = 0.0001, ****P < 0.0001; One-way ANOVA, followed by two-tailed unpaired Student’s t-test. b, IL-17A and IFN-γ production by WT, Egr1−/−, Egr2ΔT and Egr1−/−Egr2ΔT CD4+ T cells cultured with IL-6+TGF-β1 as in a was measured by flow cytometry following 4h stimulation with PMA+Iono. n = 7 independent experiments. *P < 0.05; One-way ANOVA, followed by two-tailed unpaired Student’s t-test. c-d, Frequency of cytokine-producing WT and Egr1−/−Egr2ΔTEgr3−/− CD4+ T cells cultured with IL-6+TGF-β1 as in a (c) and TH1- (IL-2+IL-12) or TH2 (IL-2+IL-4) polarizing conditions (d) following ex vivo 4h stimulation with PMA+Iono. n = 3 independent experiments. ***P < 0.001, n.s. = not significant; One-way ANOVA, followed by two-tailed unpaired Student’s t-test. Data are presented as mean ± s.e.m. in a-d.
Fig. 3 |
Fig. 3 |. EGR2-specific transcriptional regulatory network in TH17 cells
a, Scatter plot showing principal component analysis (PCA) of complete transcriptomes of TH17(β,6/EV), TH17(β,6/Egr2), TH17(β,6,23/EV) and TH17(1,6,23/EV) subsets. b, Scatter plot of differentially-expressed genes (DEGs) between TH17(β,6/Egr2) versus TH17(β,6/EV), TH17(β,6,23/EV) and TH17(1,6,23/EV) subsets. c, Dot-plot of selected Gene Ontology (GO) pathways that were up-regulated or down-regulated in TH17(β,6/Egr2) versus non-pathogenic TH17(β,6/EV) or pathogenic TH17(β,6,23/EV) and TH17(1,6,23/EV) subsets. Color indicates the percentage of DEGs in the selected GO pathways and the size indicates the −log10(p-value). d, Hierarchical clustering of DEGs in TH17(β,6/Egr2), non-pathogenic TH17(β,6/EV) or pathogenic TH17(β,6,23/EV) and TH17(1,6,23/EV) subsets. Clusters marked in blue contain genes induced in TH17(β,6/Egr2) cells and are highly expressed in TH17(β,6,23/EV) and TH17(1,6,23/EV) subsets, but not TH17(β,6) cells. Heat map shows log10-normalized transcript per million (TPM) expression level. Dot-plot shows adjusted p-value for selected KEGG pathway enrichments across all gene clusters. e, Ratio-ratio plots of log2 fold-change between TH17(β,6/Egr2) and TH17(β,6/EV) cells on x-axis versus fold-change between TH17(β,6,23/EV) (top) or TH17(1,6,23/EV) (bottom) and TH17(β,6/EV) on y-axis for all genes from the KEGG TH17 differentiation pathway (mmu04659). a-e Data represent biologically independent replicates per condition from n = 3 independent experiments.
Fig. 4 |
Fig. 4 |. EGR2 is not essential for homeostatic TH17 cells
a, Percentage of EGR2-expressing CD4+FOXP3 T cells in the small intestine (n = 5) and colon (n = 15) of SFB-colonized mice at steady-state; 3 independent experiments. b, Percentage of IL-17A- and IL-22-producing CD4+FOXP3 T cells in the small intestine and colon of SFB-colonized WT (n = 5, small intestine; n = 8, colon) and Egr2ΔT (n = 5, small intestine; n = 7, colon) mice was determined by flow cytometry following ex vivo PMA+Iono stimulation; 2 (small intestine) and 3 (colon) independent experiments. **P < 0.01; two-tailed Student’s t-test. c, Percentage of EGR2-expressing CD4+FOXP3 T cells in the colon of naïve (n = 15) and Citrobacter rodentium-infected (n = 15) mice (12 days p.i.); 3 independent experiments. n.s. = not significant; two-tailed Student’s t-test. d, Frequency and MFI of IL-17A, IL-22 and IFN-γ production by colonic CD4+FOXP3 T cells from C.rodentium-infected WT (n = 11) and Egr2ΔT (n = 10) mice (day 12 p.i.) was determined by flow cytometry following ex vivo PMA+Iono stimulation; 3 independent experiments. **P < 0.01, *P < 0.05, n.s. = not significant; two-tailed Student’s t-test. e, Bacterial burden in the colon (12 days p.i.) and body weight (2, 5, 7, 9, 12 days p.i.) of Citrobacter rodentium-infected WT (n = 15) and Egr2ΔT (n = 10) mice, calculated as the percent difference between the original body weight (day 0) and the body weight on any given day; 3 independent experiments. n.s., not significant; two-tailed Student’s t-test. f, Frequency and absolute number of IL-17A-producing CD4+ T cells and γδ T cells in the gingiva of Candida albicans-infected WT (n = 8) and Egr2ΔT (n = 6) mice; 2 independent experiments. n.s., not significant; two-tailed Student’s t-test. g, Quantitative RT-PCR analysis of TH17 cell signature genes and IL-17-dependent antimicrobial peptide-encoding genes from tongue homogenates of WT (n = 9) and Egr2ΔT (n = 6) mice infected with Candida albicans; 2 independent experiments. n.s., not significant; Mann-Whitney U test. h, Candida albicans colony forming units (CFU) per gram of tongue tissue at day 5 post-infection; WT (n = 8) and Egr2ΔT (n = 6) mice; 2 independent experiments. n.s., not significant; two-tailed Student’s t-test. Data are presented as mean ± s.e.m. in a-h.
Fig. 5 |
Fig. 5 |. EGR2 is required for TH17 cell pathogenicity
a, Intranuclear staining for EGR2 protein in CNS-infiltrating WT CD4+ T cells (red histogram) at the peak of EAE disease (20 days post-immunization with MOG35-55/CFA and Pertussis toxin). n = 10 mice per time point, 2 independent experiments. b, Mean clinical scores of WT (n = 31) and Egr2ΔT (n = 33) mice following MOG35-55-immunization as in a; 3 independent experiments. P < 0.0001; Two-way ANOVA. c, Mean clinical scores of WT (n = 21) and Egr2ΔIL17A (Egr2f/f × Il17a-Cre+) (n = 27) mice following MOG35-55-immunization as in a; 3 independent experiments. P = 0.001; Two-way ANOVA. d, Frequency of IL-17A- and IFN-γ-expressing 2D2 WT and 2D2 Egr2ΔT TH17(β,6,23) cells before the adoptive transfer following ex vivo PMA+Iono stimulation (left) and mean clinical scores of WT mice that received 7.5 x 10⁶ 2D2 WT (n = 59) or 2D2 Egr2ΔT (n = 49) TH17(β,6,23) cells intravenously (right); 5 independent experiments. P = 0.0024; Two-way ANOVA. e, Mean clinical scores of WT (n = 15) and Egr1−/− (n = 11) mice following MOG35-55-immunization as in a; 2 independent experiments. n.s. = not significant; Two-way ANOVA. f, Frequency of EGR2-expressing 2D2 (Vβ11+) TH17(β,6) cells (red histogram) 48h post-stimulation with increasing doses of plate-bound CD3 antibody and a fixed concentration of CD28 antibody (4 μg/ml) in the presence of TH17 cell-polarizing cytokines (IL-6+TGFβ1). g, Frequency of EGR2-expressing AND (Vβ3+) TH17(β,6) cells (red histogram) 48h post-stimulation with irradiated B10.BR splenocytes pulsed with a 6 μM concentration of PCC, K99A, or QASA peptide, in the presence of TH17 cell-polarizing cytokines (IL-6+TGFβ1). Combined data of 3 independent experiments (f,g). Data are presented as mean ± s.e.m. in a-g.
Fig. 6 |
Fig. 6 |. EGR2 drives regulatory network in pathogenic TH17 cells
a, Volcano plots showing log2 fold-change on x-axis and adjusted p-value on y-axis for all measured transcripts. Red and blue points denote genes that were significantly up- or down-regulated in 2D2 Egr2ΔT CD4+ T cells compared to 2D2 WT CD4+ T cells from the spleen and CNS of T-cell-deficient (Tcrb−/−) mice that received either 2D2 WT or 2D2 Egr2ΔT TH17(β,6,23) cells (20 days post-transfer). Dotted lines indicate fold-change and p-value thresholds for DEGs. Data represent biologically independent replicates from n = 3 independent experiments. b, Histogram (top) and heatmap (bottom) of EGR2 signals, centered on peaks in 2D2 WT versus 2D2 Egr2ΔT TH17 (β,6) cells 40h post-activation with plate-bound CD3+CD28 antibodies (GSE226795). Both EGR2 antibody (top) and IgG controls (below) are shown. Right, the enrichment of the top motif underlying peaks in EGR2 Ab-fraction of 2D2 WT TH17 cells. c, Pie chart showing the distribution of EGR2-bound loci across the genome (promoter, intragenic, intergenic) (left) and bar graph of the proportion of DEGs bound by EGR2 versus all genes across the genome (right). d, Heatmap showing the percentage of BAT-, IRF4-, MAF-, RORγt-, STAT3 and EGR2-regulated genes that are also co-bound by each transcription factor. e, Heatmap showing DEGs between 2D2 WT and 2D2 Egr2ΔT CD4+ T cells from the CNS of Tcrb−/− mice that received either 2D2 WT or 2D2 Egr2ΔT TH17(β,6,23) cells (20 days post-transfer) as in a, and the binding of EGR2, BATF, IRF4, MAF, RORγt, and STAT3. f, Network diagram depicting EGR2-dependent genes bound by EGR2 alone or by EGR2 in combination with 1, 2, 3, 4, or all 5 core TH17-lineage specific transcription factors.
Fig. 7 |
Fig. 7 |. EGR2 controls pathogenesis-associated genes in TH17 cells
a, MA plot showing transcript abundance in TPM (x-axis) and log2 fold-change (y-axis) for all genes included in KEGG pathway TH17 cell differentiation (mmu04659). Red and blue dots show genes significantly (p-value < 0.05) up- and down-regulated in 2D2 Egr2ΔT CD4+ T cells compared to 2D2 WT CD4+ T cells from the CNS of Tcrb−/− mice that received either 2D2 WT or 2D2 Egr2ΔT TH17(β,6,23) cells (20 days post-transfer). Data represent biologically independent replicates from n = 3 independent experiments. TPM, transcript per million. b, Intracellular cytokine staining of CD4+ T cells isolated from the CNS of WT (n = 15) and Egr2ΔT (n = 15) mice at the peak of disease (14 days post-immunization with MOG35-55/CFA and pertussis toxin). Representative contour plots show the frequency of IL-17A-, IFN-γ- and GM-CSF-producing CD4+ T cells following ex vivo PMA+Iono stimulation. Bar graphs represent the numbers of cytokine producing CD4+ T cells from 3 independent experiments. ***P < 0.001, *P < 0.05; two-tailed unpaired Student’s t-test. c, Expression levels of ‘pathogenicity-associated’ genes in TH17(β,6/Egr2) cells was measured by RT-PCR and normalized to TH17(β,6/EV) cells (solid red bars). Data represent biologically independent replicates per condition from n = 3 independent experiments. Quantitative RT-PCR analysis of ‘pathogenicity-associated’ genes in 2D2 Egr2ΔT CD4+ T cells isolated from the CNS of Tcrb−/− recipients at the peak of disease (20 days post-transfer) and normalized to CNS-infiltrating 2D2 WT CD4+ T cells (white bars). Data represent biologically independent replicates per condition from n = 4 independent experiments. d, Frequency of IL-17A-producing and T-BET-expressing TH17(β,6) cells transduced with EV-RV, Egr1-RV and Egr2-RV was measured by flow cytometry following ex vivo PMA+Iono stimulation; n = 2 independent experiments. e, Abundance of Runx1 transcripts in 2D2 WT and 2D2 Egr2ΔT CD4+ T cells from the CNS of Tcrb−/− mice that received either 2D2 WT or 2D2 Egr2ΔT TH17(β,6,23) cells (20 days post-transfer); Genome browser tracks at the Runx1 locus, showing EGR2 binding by CUT&Tag. The black dot represents EGR2 peak in 2D2 WT TH17(β,6) 40h post-stimulation with plate-bound CD3+CD28 antibodies. Track heights are labeled at the top-right corner of each track. f, Mean clinical scores of Tcrb−/− mice that received 3.75 x 10⁶ 2D2 WT TH17(β,6/EV) cells, 2D2 WT TH17(β,6/Egr2) cells or 2D2 WT TH17(β,6,23/EV) cells; n = 14 mice per group; 2 independent experiments. P < 0.0001; Two-way ANOVA. g, Mean clinical scores of Tcrb−/− mice that received 3.75 x 10⁶ 2D2 WT TH17(β,6,23/EV) cells, 2D2 Tbx21−/− TH17(β,6,23/EV) cells or 2D2 Tbx21−/− TH17(β,6,23/Egr2) cells; n = 14 mice per group; 2 independent experiments. P = 0.0008; Two-way ANOVA.
Fig. 8 |
Fig. 8 |. EGR2 controls CNS homing of encephalitogenic TH17 cells
a, Ratio-ratio plot of log2 fold-change between TH17(β,6/Egr2) and TH17(β,6/EV) cells on x-axis versus fold-change between TH17(β,6,23/EV) cells (left) or TH17(1,6,23/EV) cells (right) and TH17(β,6/EV) on y-axis for all genes from the KEGG chemokine signaling pathway (mmu04062). b, Absolute numbers of CD4+ T cells isolated from spleens and CNS of MOG35-55 peptide immunized WT (n = 55) and Egr2ΔT (n = 51) mice 14 days post-immunization. Box plot depicts median (line), lower and upper quartiles, and whiskers depict 1 and 99 percentile values; combined data from 12 independent experiments. ****P < 0.0001, n.s. = not significant; two-tailed unpaired Student t-test. c, Longitudinal spinal cord sections of MOG35-55-peptide immunized WT (n = 4) and Egr2ΔT (n = 5) mice stained with CD4 antibody (green) and nuclear dye DAPI (blue) 14 days post-immunization. Line = 50 μm; representative images from 2 independent experiments. d, Mean fluorescence intensity ± s.e.m. of CD49d (integrin α4), CD29 (β1 integrin), CD11a (integrin αL) on CD4+ T cells from the CNS of WT (n = 18) and Egr2ΔT (n = 18) mice 14 days post-immunization as in c. e, Frequency of CCR6- and RANKL-expressing CD4+ T cells from the CNS of WT (n = 10) and Egr2ΔT (n = 10) mice 14 days post-immunization as in c. Representative staining from 4 independent experiments in d and e; **P < 0.01, *P < 0.05, two-tailed unpaired Student t-test. f, RANKL expression (MFI) on CNS-infiltrating CD4+ T cells from the CNS of WT (n = 10) and Egr2ΔT (n = 10) 14 days post-immunization as in c (top). **P < 0.01, *P < 0.05, two-tailed unpaired Student t-test. Quantitative RT-PCR of Ccl20 mRNA expression in spinal cord homogenates of MOG35-55-peptide immunized WT (n = 28) and Egr2ΔT (n = 18) mice 14 days post-immunization (bottom). Box plot depicts median (line), lower and upper quartiles, and whiskers depict 1 and 99 percentile values; combined data from 3 independent experiments. *P < 0.05; Mann-Whitney U test. g, MA plot showing transcript abundance in TPM (x-axis) and log2 fold-change (y-axis) for all genes included in the KEGG cytokine-cytokine receptor pathway (mmu04060). Red and blue dots show genes significantly (p-value < 0.05) up- and down-regulated in 2D2 Egr2ΔT CD4+ T cells compared to 2D2 WT CD4+ T cells from the CNS of Tcrb−/− mice that received either 2D2 WT or 2D2 Egr2ΔT TH17(β,6,23) cells (20 days post-transfer). h, Quantitative RT-PCR of Ccl1, Ccl3 and Ccl4 mRNA expression in spinal cord homogenates of MOG35-55-peptide immunized WT (n = 28) and Egr2ΔT (n = 18) mice 14 days post-immunization; combined data from 3 independent experiments. ****P < 0.0001, *P < 0.05, Mann-Whitney U test. i-j, Frequency (i) and numbers (j) of neutrophils (Ly6G+Ly6C+), inflammatory monocytes (Ly6GLy6C+) and MHC Class II-expressing dendritic cells (I-A/I-E+ CD11c+). Cells originated from the CNS of MOG35-55 peptide immunized WT (n = 20) and Egr2ΔT (n = 28) mice 14 days post-immunization; combined data from 4 independent experiments. ***P < 0.001, *P < 0.05, two-tailed Mann-Whitney U test. Mean values ± s.e.m. are reported in b, d-f, i-j.

Comment in

References

    1. Bettelli E, Carrier Y, Gao W, Korn T, Strom TB, Oukka M, Weiner HL & Kuchroo VK Reciprocal developmental pathways for the generation of pathogenic effector TH17 and regulatory T cells. Nature 441, 235–238 (2006). - PubMed
    1. Mangan PR, Harrington LE, O’Quinn DB, Helms WS, Bullard DC, Elson CO, Hatton RD, Wahl SM, Schoeb TR & Weaver CT Transforming growth factor-beta induces development of the T(H)17 lineage. Nature 441, 231–234 (2006). - PubMed
    1. Veldhoen M, Hocking RJ, Atkins CJ, Locksley RM & Stockinger B TGFbeta in the context of an inflammatory cytokine milieu supports de novo differentiation of IL-17-producing T cells. Immunity 24, 179–189 (2006). - PubMed
    1. Ghoreschi K, Laurence A, Yang XP, Tato CM, McGeachy MJ, Konkel JE, Ramos HL, Wei L, Davidson TS, Bouladoux N, Grainger JR, Chen Q, Kanno Y, Watford WT, Sun HW, Eberl G, Shevach EM, Belkaid Y, Cua DJ, Chen W & O’Shea JJ Generation of pathogenic T(H)17 cells in the absence of TGF-beta signalling. Nature 467, 967–971 (2010). - PMC - PubMed
    1. Langrish CL, Chen Y, Blumenschein WM, Mattson J, Basham B, Sedgwick JD, McClanahan T, Kastelein RA & Cua DJ IL-23 drives a pathogenic T cell population that induces autoimmune inflammation. J Exp Med 201, 233–240 (2005). - PMC - PubMed

Publication types