. 2023 Aug;25(8):1101-1110.
doi: 10.1038/s41556-023-01178-w. Epub 2023 Jul 13.

The Troyer syndrome protein spartin mediates selective autophagy of lipid droplets

Affiliations

The Troyer syndrome protein spartin mediates selective autophagy of lipid droplets

Jeeyun Chung et al. Nat Cell Biol. 2023 Aug.

Abstract

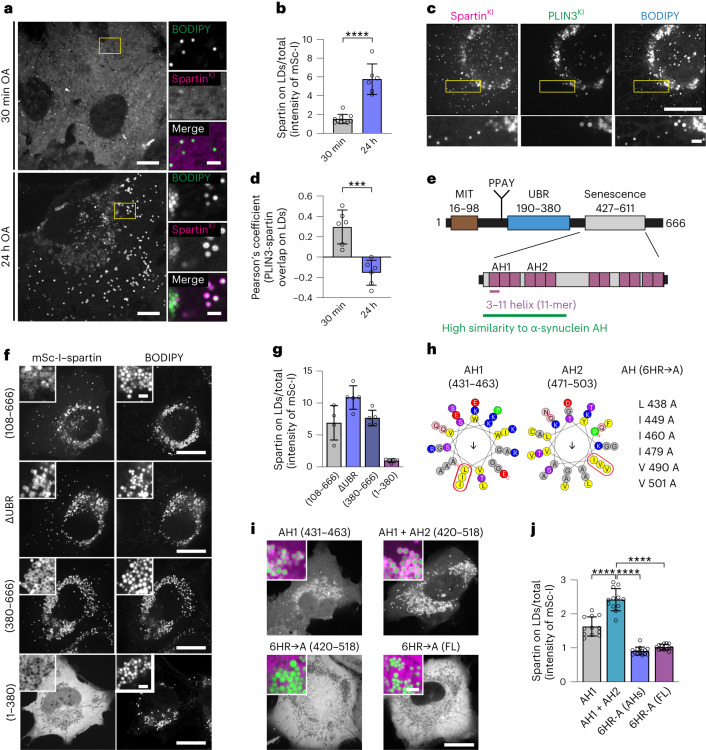
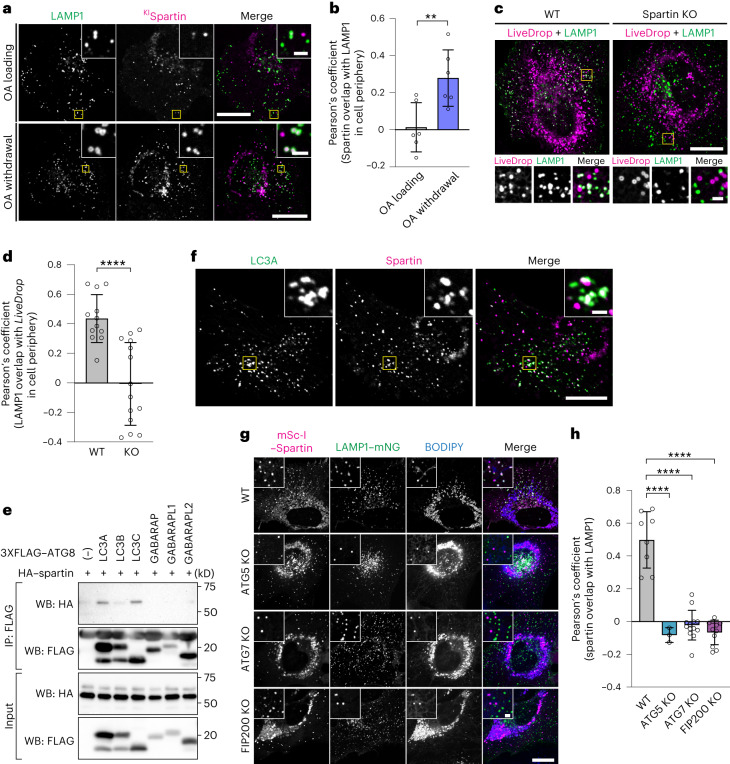
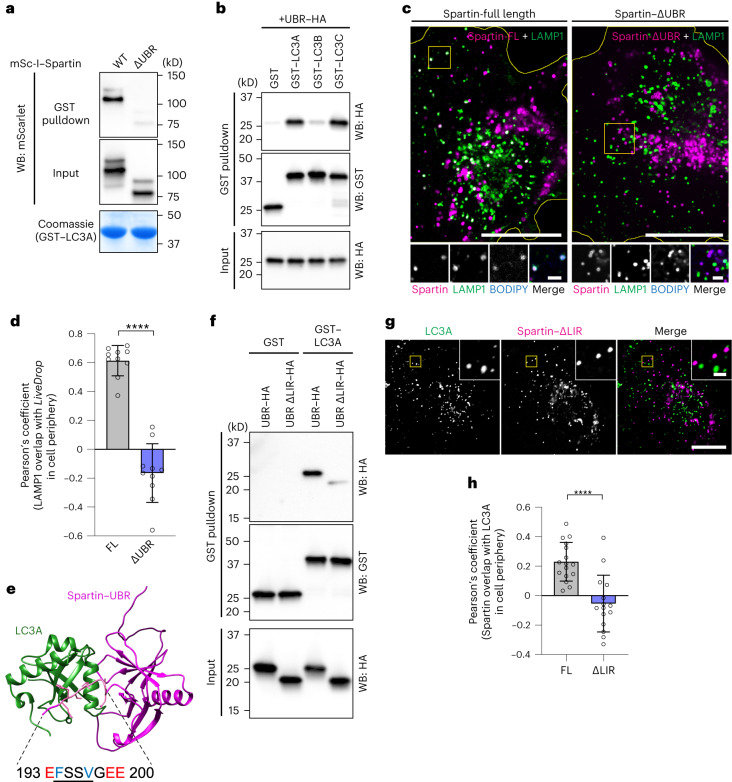
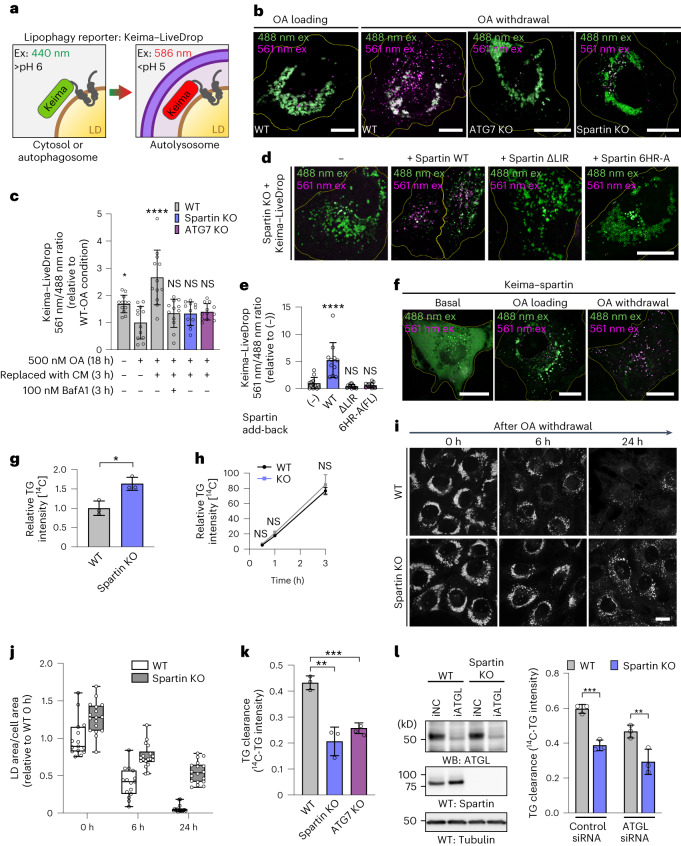
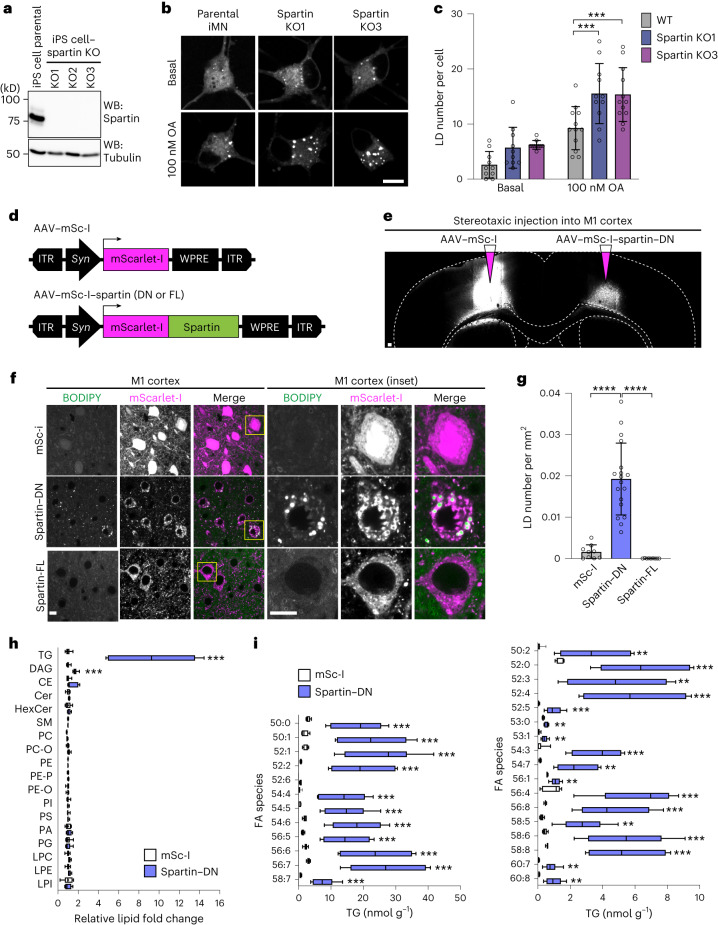
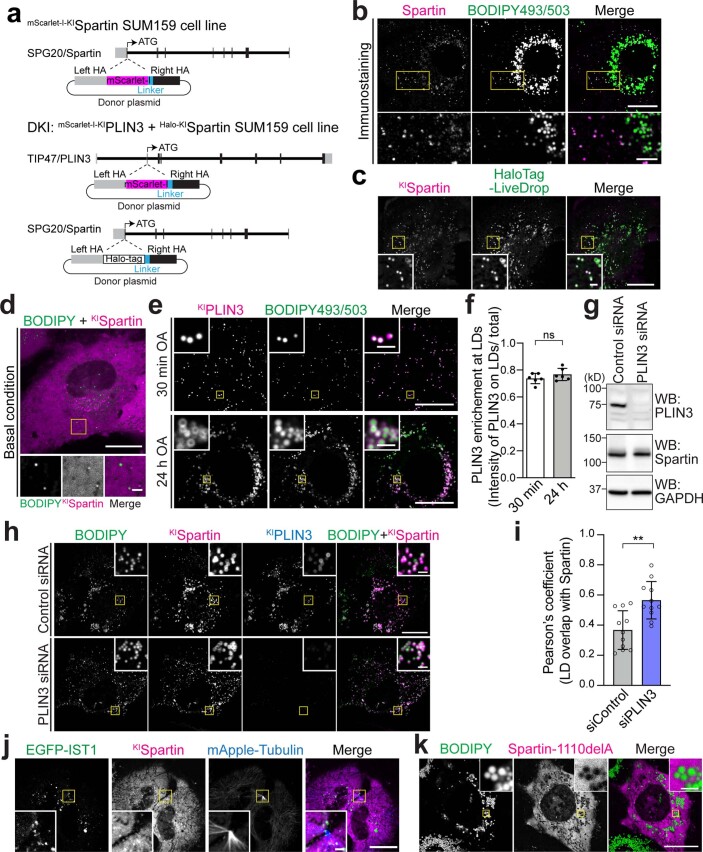
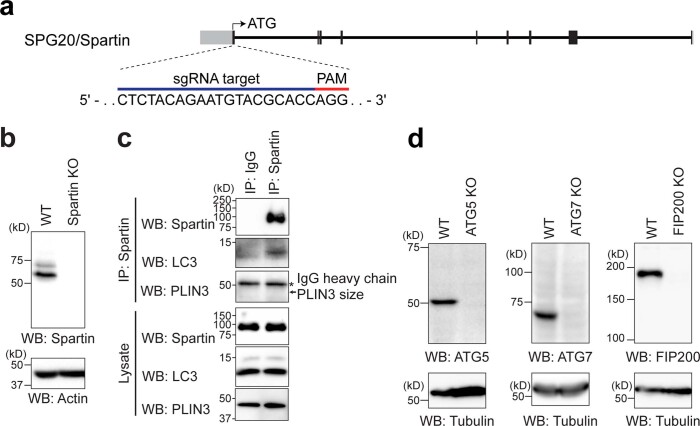
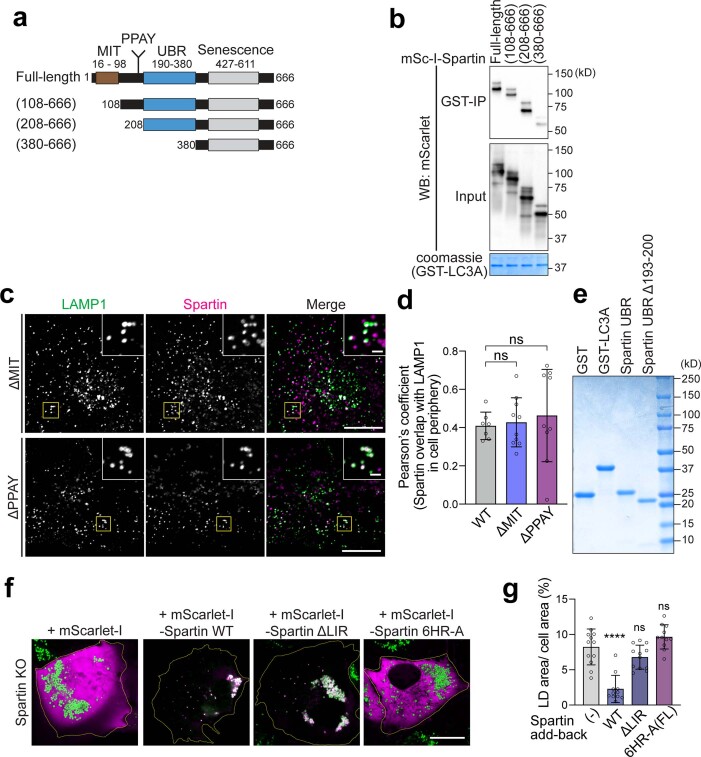
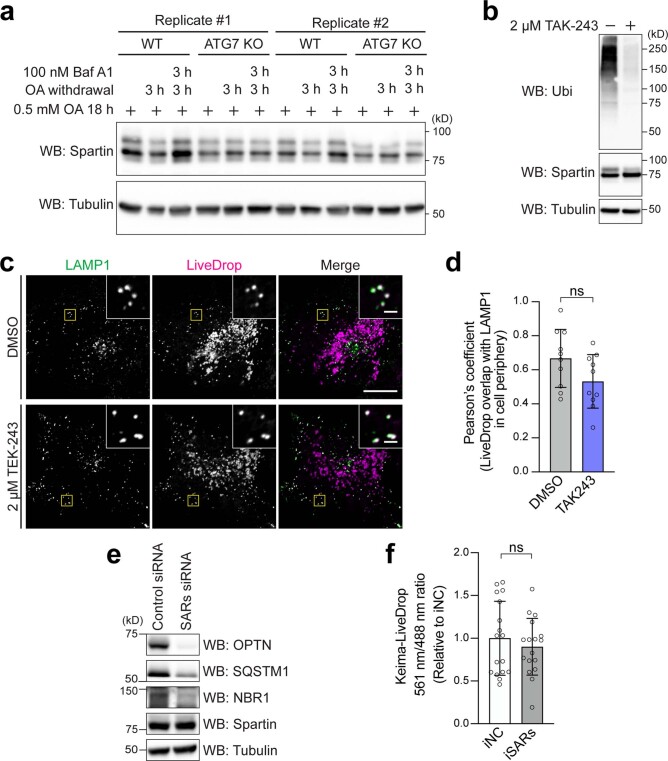
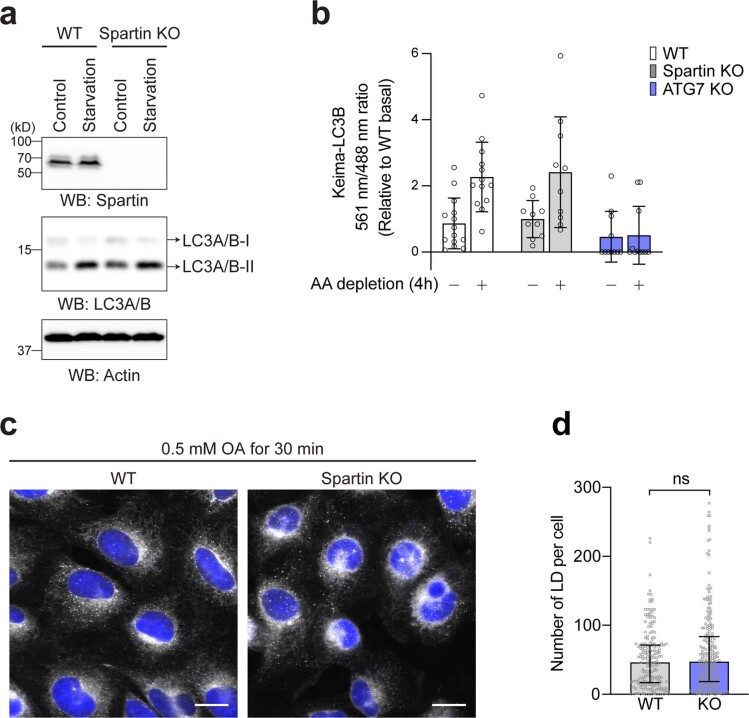
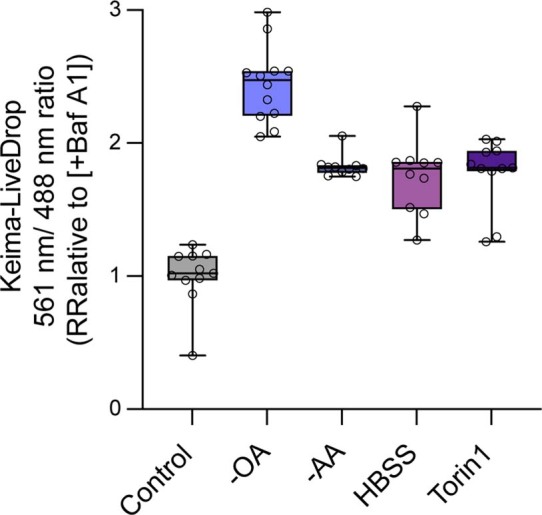
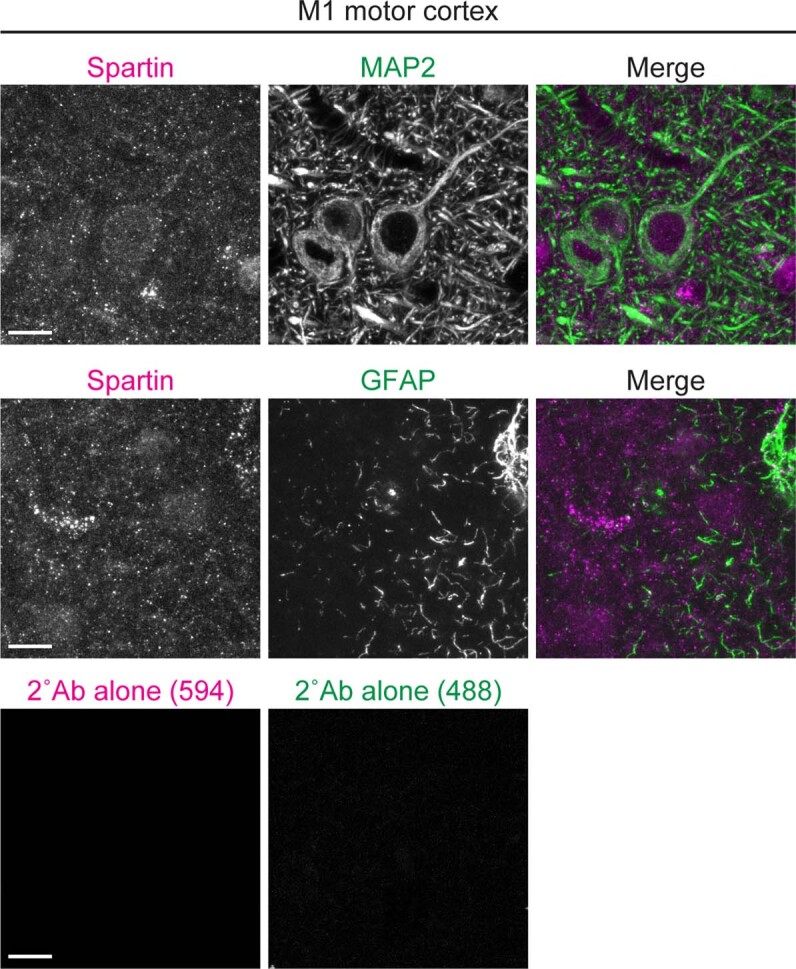
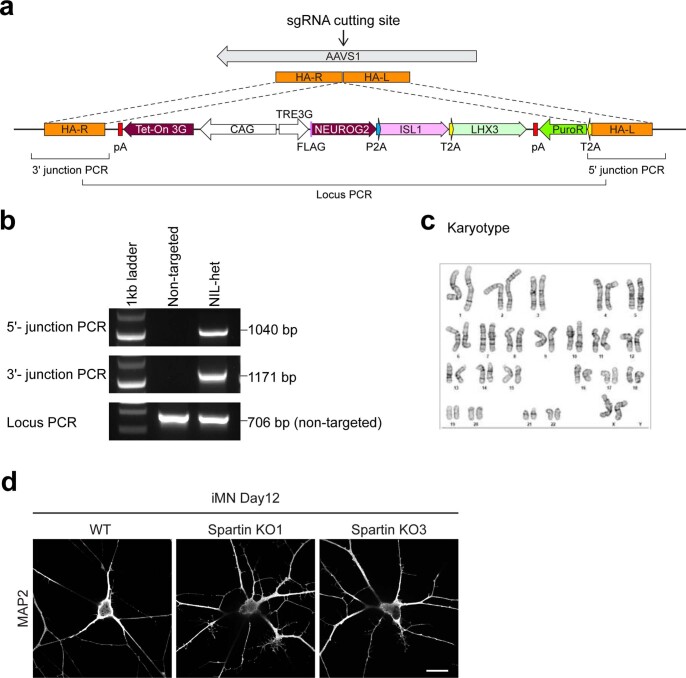
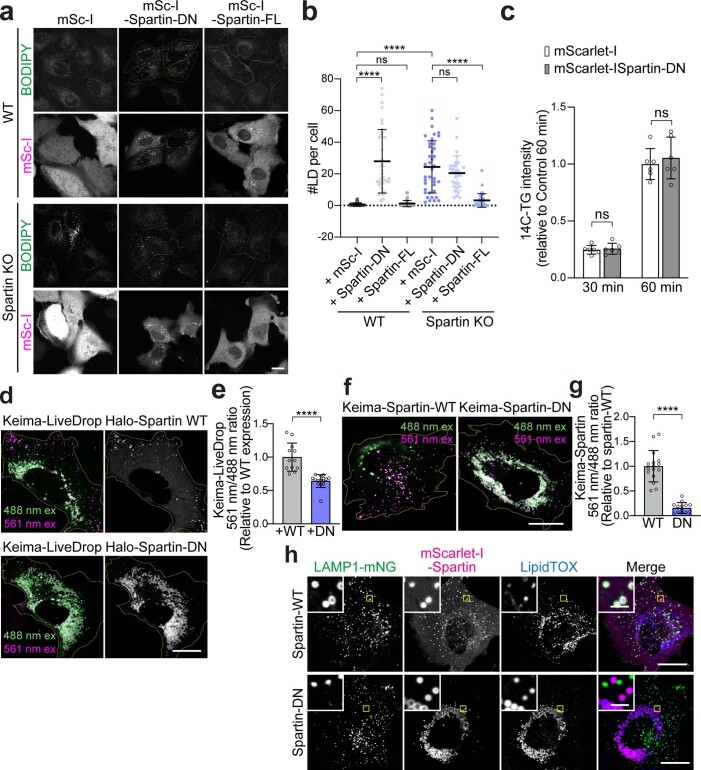
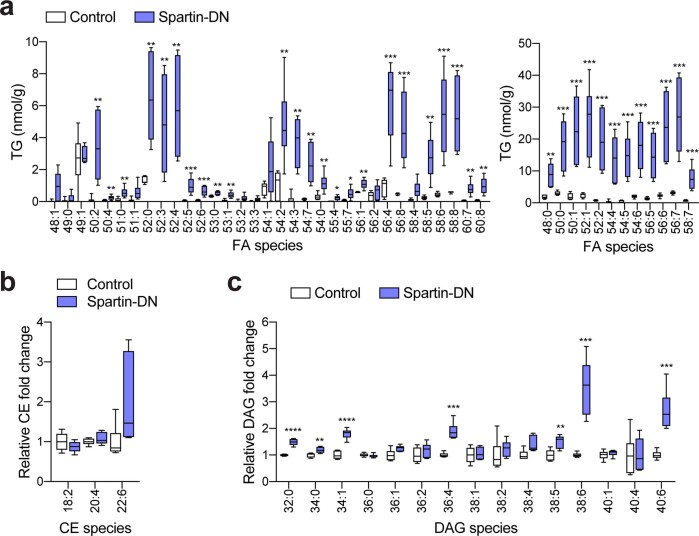
Lipid droplets (LDs) are crucial organelles for energy storage and lipid homeostasis. Autophagy of LDs is an important pathway for their catabolism, but the molecular mechanisms mediating LD degradation by selective autophagy (lipophagy) are unknown. Here we identify spartin as a receptor localizing to LDs and interacting with core autophagy machinery, and we show that spartin is required to deliver LDs to lysosomes for triglyceride mobilization. Mutations in SPART (encoding spartin) lead to Troyer syndrome, a form of complex hereditary spastic paraplegia1. Interfering with spartin function in cultured human neurons or murine brain neurons leads to LD and triglyceride accumulation. Our identification of spartin as a lipophagy receptor, thus, suggests that impaired LD turnover contributes to Troyer syndrome development.


Conflict of interest statement

The authors declare no competing interests.

Figures

Fig. 1
Fig. 1. Spartin targets to mature LDs via AH repeats in the senescence domain.
a, Cells expressing endogenously tagged spartin (with mScarlet-I) reveal preferential targeting to mature LDs. SUM159 cells treated with 0.5 mM OA for 30 min (top) or 24 h (bottom) and stained with BODIPY493/503. Scale: full-size, 20 μm; insets, 2 μm. b, Quantification of a. Mean ± s.d., n = 6 fields of view (24 h), 10 fields of view (30 min), three independent experiments, ****P = 0.0003, two-tailed unpaired t-test. c, Spartin and PLIN3 localize to different LD subpopulations. Cells expressing endogenously tagged spartin (with HaloTag) and PLIN3 (with mScarlet-I) treated with 0.5 mM OA (24 h) and stained with BODIPY493/503. HaloTag pre-labelled with 100 nM JF646. Scale bars as in a. d, Overlap of PLIN3 and spartin on LDs after 0.5 mM OA treatment, Pearson’s coefficient analysis. Mean ± s.d., n = fields of view, three independent experiments, ***P < 0.001, two-tailed unpaired t-test. e, Schematic representation of spartin (top) with long AH regions (purple) in the senescence domain (bottom). f, Localization of expressed spartin truncation mutants (with mScarlet-I tag) reveals spartin senescence domain is required for LD localization. Cells were treated with 0.5 mM OA (24 h) and stained with BODIPY493/503. Scale bars: full-size, 20 μm; insets, 2 μm. g, Quantification of f. Mean ± s.d., n = 4 cells (108–666), 5 cells (ΔUBR), 5 cells (380–666) and 5 cells (1–380). h, Helical wheel plot of spartin 33-mer repeats of AH1 (amino acids 431–463) and AH2 (amino acids 471–503), plotted as a 3–11 helix (36). AH(6HR→A), six mutations introduced into AH1 + AH2 (amino acids 431–503) and full length (FL). i, Cells expressing mScarlet-I-tagged spartin as in h show that AH1 and AH2 are sufficient for LD binding. Cells were treated with 0.5 mM OA (24 h) and stained with BODIPY493/503. Insets, overlay of spartin (magenta) and LDs (green). Scale bars as in a. j, Quantification of h. Mean ± s.d., n = 12 fields of view (AH1), 12 fields of view (AH1 + AH2), 14 fields of view (6HR-A[AHs]) and 13 fields of view (6HR-A[FL]), three independent experiments, ****P < 0.0001, one-way analysis of variance, Tukey’s multiple comparisons test. Source numerical data are available in source data. Source data
Fig. 2
Fig. 2. Spartin mediates autophagy-dependent LD delivery to lysosomes.
a, Cells expressing endogenously tagged spartin (with mScarlet-I) and transiently expressing LAMP1–mNG reveal spartin and LAMP1 co-localization after oleate withdrawal. SUM159 cells treated with 0.5 mM OA for 24 h (top) and chased for 3 h after OA withdrawal (bottom). Scale bars: full-size, 20 μm; insets, 2 μm. b, Overlap of spartin and LAMP1 in cell periphery with or without OA withdrawal for 2 h after 18 h OA addition as shown in a (Pearson’s coefficient analysis). Mean ± s.d., n = 6 fields of view, three independent experiments, **P = 0.0091, two-tailed unpaired t-test. c, WT or spartin KO cells transiently co-expressing HaloTag–LiveDrop (pre-labelled with 100 nM JF549) and LAMP1–mNG reveal spartin deficiency impairs LD targeting to lysosomes. Cells treated with 0.5 mM OA (24 h) and chased for 3 h after OA withdrawal. Scale bars as in a. d, Overlap of LiveDrop and LAMP1 in cell periphery shown in c quantified by Pearson’s coefficient analysis. Mean ± s.d., n = 12 cells (WT) and 14 cells (KO) from three independent experiments, ****P < 0.001, two-tailed unpaired t-test. e, Spartin interacts with LC3A and LC3C. HEK293T cells transiently co-expressing HA-spartin together with 3xFLAG–ATG8 (LC3A, LC3B, LC3C, GABARAP, GABARAPL1 or GABARAPL2) were subjected to immunoprecipitation with anti-FLAG antibody and analysed by immunoblot with anti-HA and anti-FLAG antibodies. f, Spartin co-localizes with LC3A. Cells expressing mScarlet-I–spartin full-length and HaloTag–LC3A (pre-labelled with 100 nM JF646) were treated with 0.5 mM OA for 24 h and chased for 3 h after OA withdrawal. Scale bars: full-size, 20 μm; insets, 2 μm. g, Delivery of spartin-coated LDs to lysosomes is autophagy-dependent. Co-localization analyses between transiently overexpressed mScarlet-I–spartin and LAMP1–mNG in SUM159 cells lacking ATG5, ATG7 or FIP200. Scale bars: full-size, 20 μm; insets, 2 μm. h, Overlap of spartin and LAMP1 in cell periphery shown in g (Pearson’s coefficient analysis). Mean ± s.d., n = 6 cells (WT), 11 cells (FIP200 KO), 13 cells (ATG7 KO) and 3 cells (ATG5 KO) cells from three independent experiments, ****P < 0.001, one-way analysis of variance, Dunnett’s multiple comparisons test. Source numerical data and unprocessed blots are available in source data. Source data
Fig. 3
Fig. 3. UBR domain contains an LIR motif responsible for the interaction between spartin and LC3.
a, UBR domain is required for the interaction between spartin and LC3A. HEK293T WT cell lysates transiently expressing mScarlet-I–spartin WT or ΔUBR were incubated with recombinant GST–LC3A, followed by GST pulldown and detected with anti-mScarlet/mCherry antibody. Cells were treated will 0.5 mM OA for 24 h before lysate preparation. b, Recombinant UBR domain directly interacts with recombinant LC3A and LC3C. Recombinant spartin-UBR–HA was incubated with recombinant GST, GST–LC3A, GST–LC3B or GST–LC3C, followed by GST pulldown and detected with anti-GST and anti-HA antibodies. c, SUM159 cells lacking spartin, transiently expressing LAMP1–mNG and mScarlet-I–spartin full-length (FL) or mScarlet-I–spartin–ΔUBR. Cells were treated with 0.5 mM OA for 24 h, then replaced to the complete medium 3 h before image acquisition. LDs were stained with BODIPY493/504. Scale bars: full-size, 20 μm; insets, 5 μm. d, Overlap of spartin FL or ΔUBR and LAMP1 in cell periphery, quantified by Pearson’s coefficient analysis. Mean ± s.d., n = 10 cells from three independent experiments, ****P < 0.0001, two-tailed unpaired t-test. e, AlphaFold2-based ColabFold structural prediction of the interaction between the UBR domain of spartin and LC3A. f, Recombinant spartin–UBR–HA or spartin-UBR ΔLIR (deletion of residues 193–200)–HA was incubated with recombinant GST or GST–LC3A, followed by GST pulldown and detected with anti-GST and anti-HA antibodies. g, Confocal imaging of live SUM159 cells lacking spartin, transiently expressing EGFP–LC3A and mScarlet-I–spartin FL or mScarlet-I–spartin–ΔLIR. Cells were treated with 0.5 mM OA for 24 h, then replaced to the complete medium 3 h before image acquisition. Scale bars: full-size, 20 μm; insets, 2 μm. h, Overlap between spartin FL or ΔLIR and LC3A in cell periphery shown in g was quantified by Pearson’s coefficient analysis. Mean ± s.d., n = 16 cells (Spartin FL) and 15 cells (ΔLIR) from three independent experiments, ****P < 0.0001, two-tailed unpaired t-test. Source numerical data and unprocessed blots are available in source data. Source data
Fig. 4
Fig. 4. Spartin deficiency causes defects in TG and LD turnover in cells.
a, Schematic illustration for Keima–LiveDrop showing excitation spectrum conversion of Keima in various conditions. b, Overlay images of Keima–LiveDrop, expressed in SUM159 WT, ATG7 KO and spartin KO cells. Scale bars, 10 μm. c. Ratiometric fluorescence measurements of Keima–LiveDrop in SUM159 WT, ATG7 KO and spartin KO in various conditions. Mean ± s.d., n = 12 cells from three independent experiments, *P = 0.0223; ****P < 0.0001, one-way analysis of variance (ANOVA), Dunnett’s multiple comparisons test. d, Overlay images of Keima–LiveDrop expressed in spartin KO, transiently transfected with Halo–spartin constructs as described. Scale bars, 20 μm. e, Ratiometric fluorescence measurements of Keima–LiveDrop in spartin KO with transient expression of Halo–spartin constructs. ****P < 0.0001. one-way ANOVA, Dunnett’s multiple comparisons test. Mean ± s.d., n = (left to right) 12, 11, 12 and 11 cells, three independent experiments. f, Overlay images of Keima–spartin expressed in WT cells. g,h, WT and spartin KO SUM159 cells pulse-labelled with [14C]-OA; incorporation into TG was measured after 0.5 mM OA treatment for 24 h (g), 0.5–3 h (h). Values calculated relative to WT (d) and spartin KO cells’ highest value at 3 h. Mean ± s.d., n = 3 independent experiments, *P = 0.0121; NS, not significant; two-tailed unpaired t-test (d) and two-way ANOVA with repeated measurements (e). i, Confocal imaging showing LDs (BODIPY493/503) in WT or spartin KO cells reveals impaired LD turnover. Cells were treated with 0.5 mM OA for 24 h and chased for 6 or 24 h after OA withdrawal. Scale bar, 20 μm. j, Area of LDs stained by BODIPY493/503 quantified from images shown in g. Median ± the 25th to 75th percentiles, the whiskers extended to the minima and the maxima, n = 15 cells (WT; 0 h, 6 h and 24 h), 17 cells (spartin KO; 0 h), 18 cells (spartin KO; 6 h, 24 h), three independent experiments. k, Reduced TG degradation in spartin KO cells. WT, spartin KO or ATG7 KO SUM159 cells pulse-labelled with [14C]-OA, and incorporation into TG measured after treatment with 0.5 mM OA for 24 h and subsequent 3 h OA withdrawal. l, Reduced TG clearance is independent of ATGL. ATGL knockdown in WT and spartin KO cells for 48 h before [14C]-OA labelling is shown in the left panel. Mean ± SD, n = 3 independent experiments, **P = 0.0022 and ***P = 0.0006, one-way ANOVA, Dunnett’s multiple comparisons test. Source numerical data and unprocessed blots are available in source data. Excitation (ex); emission (em); complete medium (CM). Source data
Fig. 5
Fig. 5. Interfering with spartin function leads to TG and LD accumulation in cultured human neurons or murine brain neurons.
a, Generation of spartin KO–iPS cell lines. b, Confocal imaging of fixed iMNs showing LD accumulation in spartin KO–iMN compared with parental cell line (day 12 post-differentiation). Cells were incubated with 100 nM OA for 24 h. Scale bar, 10 μm. c, Quantification of b. Mean ± s.d., n = 10 cells (Basal; WT, Spartin KO1, Spartin KO2), 12 cells (100 nM; WT and Spartin KO2) and 11 cells (100 nM Spartin KO1), three independent experiments, ***P = 0.006 (for comparison of WT and Spartin KO1); ***P = 0.007 (for comparison of WT and Spartin KO1), one-way analysis of variance, Dunnett’s multiple comparisons test. d, AAV constructs to express mScarlet-I or mScarlet-I–spartin FL as controls or a dominant-negative form of spartin (spartin-DN) under a pan-neuronal synapsin promoter (Syn). e, Expression of mScarlet-I and mScarlet-I-fused spartin-DN in the mouse motor cortex. AAV–mSc-I or AAV–mSc-I–spartin-DN was stereotaxically injected into different hemispheres of the M1 motor cortex in 7–8-week-old WT mice. Scale bar, 100 μm. f,g, Accumulation of BODIPY493/503 in spartin-DN-expressing neurons of the mouse M1 motor cortex. Representative images of the AAV-infected M1 cortex slices stained with BODIPY493/503 10–11 days after AAV injection (f). Scale bar, 10 μm. Quantification of LD numbers of the cell bodies of M1 cortex slices (g). Mean ± s.d., n = 9 fields of view from n = 3 mice, ****P < 0.0001, two-tailed unpaired t-test. h,i, Lipidomic profiles of the AAV-infected M1 cortices show increased amounts of TG and DAG in neurons where spartin function was disrupted. Lipids were extracted from tissues and analysed by liquid chromatography–mass spectrometry (LC–MS) as described in Methods. Relative fold-changes are shown in (h). Triglyceride (TG); diacylglycerol (DAG); cholesterol ester (CE); ceramide (Cer); hexosylceramide (HexCer); sphingomyelin (SM); phosphatidylcholine (PC); ether-linked phosphatidylcholine (PC-O); phosphatidylethanolamine (PE); phosphatidylethanolamine plasmalogens (PE-P); ether-linked phosphatidylethanolamine (PE-O); phosphatidylinositol (PI); phosphatidylserine (PS); phosphatidic acid (PA); phosphatidylglycerol (PG); lysophosphatidylcholine (LPC); lysophosphatidylethanolamine (LPE); lysophosphatidylinositol (LPI); fatty acid (FA). LC–MS analysis verified widespread elevations in TGs from spartin-DN-expressing neurons of the M1 cortex (Spartin-DN), compared with a control (mSc-I) (i). Box-and-whisker plot, median ± the 25th to 75th percentiles, the whiskers extended to the minima and the maxima, n = 6 mice, **P < 0.01, ***P < 0.001 (h, TAG = 0.000506, DAG = 0.000081; i, 50:0 = 0.000782, 50:1 = 0.000688, 52:1 = 0.000452, 52:2 = 0.000516, 52:6 = 0.000860, 54:4 = 0.000849, 54:6 = 0.000463, 56:5 = 0.000738, 56:6 = 0.000444, 56:7 = 0.000393, 58:7 = 0.000754, 50:2 = 0.002913, 52:0 = 0.000684, 52:3 = 0.002428, 52:4 = 0.000621, 52:5 = 0.000911, 53:0 = 0.002413, 53:1 = 0.001690, 54:3 = 0.000166, 54:7 = 0.001090, 56:1 = 0.001576, 65:4 = 0.000350, 56:8 = 0.000765, 58:5 = 0.001099, 58:6 = 0.000570, 58:8 = 0.000339, 60:7 = 0.001566, 60:8 = 0.001432); two-tailed unpaired t-test in each row; multiple comparisons test using the two-stage step-up method of Benjamini, Krieger and Yekutieli. Source numerical data and unprocessed blots are available in source data. Source data
Extended Data Fig. 1
Extended Data Fig. 1. Endogenous spartin targets to LDs at the cell periphery.
a, Strategy for the endogenous tagging of SPG20/spartin and TIP47/PLIN3. Individual rectangular bar represents exon (gray color, untranslated region; black color, translated region). A donor plasmid was co-transfected with appropriate gRNA/Cas9 plasmid to induce homologous recombination of mScarlet-I or HaloTag into upstream of SPG20/spartin or TIP47/PLIN3. b, Confocal imaging of fixed SUM159 cells stained with endogenous spartin antibody and BODIPY493/503. Cells were treated with 0.5 mM OA for 24 h. Scale bars: full-size, 20 μm; insets, 2 μm. c,d, Confocal imaging of live SUM159 cells expressing endogenously fluorescent-tagged spartin (with mScarlet-I) at their gene locus. HaloTag–LiveDrop was transiently expressed and stained with 100 nM JF646 (c) and BODIPY493/503 (d). Cells were treated with 0.5 mM OA for 24 h (c). Scale bars: full-size, 20 μm; insets, 2 μm. e, Confocal imaging of live SUM159 cells expressing endogenously fluorescent-tagged spartin (HaloTag) and PLIN3 (mScarlet-I). Cells were pre-incubated with 0.5 mM OA for 30 min or 24 h prior to confocal live-cell microscopy. Scale bars: full-size, 20 μm; insets, 2 μm. f, Quantification of PLIN3 enrichment at LDs in PLIN3 and spartin double-KI SUM159 cells shown in (e). Mean ± SD, n = 6 fields of view from three independent experiments, n.s. not significant, two-tailed unpaired t-test. g, Immunoblot analyses of SUM159 PLIN3 (mScarlet-I) and spartin (HaloTag) double KI cells. Cells were treated with 20 nM negative control siRNA or PLIN3 siRNA for 72 h prior to lysate preparation. h, Confocal imaging of live SUM159 PLIN3 (mScarlet-I) and spartin (HaloTag) double KI cells. Cells were treated with 20 nM negative control siRNA or PLIN3 siRNA for 72 h prior to imaging. Cells were pre-incubated with 0.5 mM OA for 24 h and chased for 3 h after OA withdrawal, stained with JF646 (for HaloTag KI–spartin) and BODIPY493/503. Scale bars: full-size, 20 μm; insets, 2 μm. i, Quantification of spartin enrichment at LDs in PLIN3 and spartin double-KI SUM159 cells shown in (h). Mean ± SD, n = 11 cells from three independent experiments, **p = 0.0015, two-tailed unpaired t-test. j, Confocal imaging of live SUM159 cells expressing endogenously fluorescent-tagged spartin (with mScarlet-I) at their gene locus. EGFP–IST1 and mApple–Tubulin were transiently expressed. Scale bars: full-size, 20 μm; insets, 2 μm. k, Confocal imaging of live SUM159 spartin KO cells transiently expressing mScarlet-I–spartin-1110delA. Cells were treated with 0.5 mM OA for 24 h and stained with BODIPY493/503. Scale bars: full-size, 20 μm; insets, 2 μm. Source numerical data and unprocessed blots are available in source data. Source data
Extended Data Fig. 2
Extended Data Fig. 2. Spartin is associated with lysosomes and autophagy machineries.
a, Strategy for the knockout of SPG20/spartin. Individual rectangular bar represents exon (gray color, untranslated region; black color, translated region). An sgRNA target sequence is shown with PAM sequence. b, Immunoblot analyses of SUM159 cells, wild-type and cells lacking spartin. c, Endogenous spartin interacts with endogenous LC3. Endogenous spartin was immunoprecipitated with anti-spartin antibody in SUM159 wild-type cells and analyzed by immunoblot with anti-spartin, anti-LC3, and anti-PLIN3 antibodies. * denotes IgG heavy change. d, Immunoblot analyses of SUM159 cells wild-type and cells lacking ATG5, ATG7, or FIP200. Unprocessed blots are available in source data. Source data
Extended Data Fig. 3
Extended Data Fig. 3. Domain mapping of interaction between spartin and ATG8 proteins.
a, Schematic representation of spartin truncation mutants used in GST pull-down analysis. b, SDS-PAGE analysis of recombinant GST and GST–LC3A purified from bacteria (after size-exclusion column). Proteins were visualized by Coomassie blue staining. c, Confocal imaging of live SUM159 cells transiently expressing LAMP1–mNG and mScarlet-I–spartin-ΔMIT (top) or mScarlet-I–spartin-ΔPPAY (bottom). Cells were treated with 0.5 mM OA for 24 h and chased for 3 h after OA withdrawal. Scale bars: full-size, 20 μm; insets, 2 μm. d, Overlap between spartin and LAMP1 in cell periphery shown in (c) was quantified by Pearson’s coefficient analysis. Mean ± SD, n = 7 cells (FL), 10 cells (dMIT), and 9 cells (dPPAY) from two independent experiments, n.s. not significant, one-way ANOVA, Tukey’s multiple comparisons test. e, SDS-PAGE analysis of recombinant proteins purified from bacteria. 12XHis-SUMO tag of spartin constructs were removed by SUMO protease and all proteins were further purified by size-exclusion column. Protein was visualized by Coomassie blue staining. f, Confocal imaging of live SUM159 spartin KO cells, transiently transfected with either mScarlet-I or mScarlet-I–spartin constructs as annotated in the image (shown in magenta color). Cells were stained with BODIPY493/503 (shown in green color) prior to image acquisition. Mean ± SD, n = 17 cells from two independent experiments. Scale bars: full-size, 20 μm. g, Area of LDs stained by BODIPY493/503 was quantified per cell in SUM159 spartin KO, transiently transfected with mScarlet-I–spartin constructs as annotated below the graph. Mean ± SD, n = 12 cells (no transfection), 11 cells (+ Spartin WT), 12 cells (+ Spartin ΔLIR), and 11 cells (+Spartin 6HR-A) from two independent experiments. one-way ANOVA, Dunnett’s multiple comparisons test, ****p < 0.0001, n.s. not significant. Source numerical data and unprocessed blots are available in source data. Source data
Extended Data Fig. 4
Extended Data Fig. 4. Spartin-mediated lipophagy is ubiquitination-independent.
a. Immunoblot analysis of SUM159 cells wild-type and cells lacking ATG7 with the indicated antibodies. b, Immunoblot analysis of SUM159 wild-type cells with the indicated antibodies. Cells were treated with DMSO (vehicle) or 2 μM TAK-243 for 2 h prior to cell lysis. c, Confocal imaging of live SUM159 cells transiently expressing LAMP1–mNG and mCherry–LiveDrop. Cells were treated with 0.5 mM OA for 24 h and chased for 3 h after OA withdrawal, with DMSO (vehicle) or 2 μM TAK-243 for 2 h prior to imaging. Scale bars: full-size, 20 μm; insets, 2 μm. d, Overlap between LiveDrop and LAMP1 in cell periphery shown in (c) was quantified by Pearson’s coefficient analysis. Mean ± SD, n = 10 cells from two independent experiments, n.s. not significant, two-tailed unpaired t-test. e, Immunoblot analyses of SUM159 wild-type cells with indicated antibodies. Cells were treated with 20 nM negative control siRNA or selective autophagy receptors (SARs; OPTN, NBR1, SQSTM1/p62) siRNAs for 72 h prior to lysate preparation. f, Ratiometric fluorescence measurement of Keima–LiveDrop in SUM159 wild-type cells treated with control siRNA (iNC) or SARs siRNAs for 72 h, n.s. not significant, two-tailed unpaired t-test. Mean ± SD, n = 17 cells from three independent experiments. Source numerical data and unprocessed blots are available in source data. Source data
Extended Data Fig. 5
Extended Data Fig. 5. Spartin deficiency does not affect general autophagy machinery and LD biogenesis.
a, Immunoblot analyses of SUM159 wild-type and spartin KO cells. Starvation samples were incubated in serum-free and low-glucose medium (1 g/L) for 3 h prior to lysate preparation. b, Ratiometric fluorescence measurement of Keima-LC3B in SUM159 wild-type, ATG7 KO, and spartin KO in basal or amino acid depletion for 4 h. Mean ± SD, n = 14 cells (WT-Basal), 13 cells (WT-AA depletion), 10 cells (Spartin KO-Basal), 10 cells (Spartin KO-AA depletion), 11 cells (ATG7 KO-Basal), and 11 cells (ATG7 KO-AA depletion) from two independent experiments. c, Confocal imaging of fixed SUM159 wild-type and spartin KO cells stained with BODIPY493/503 and Hoechst 33342. Cells were treated with 0.5 mM OA for 30 min prior to fixation. Scale bar: 20 μm. d, Quantification of number of LDs per cell in wild-type and spartin KO SUM159 cells shown in (c) The images were taken on high-throughput confocal microscope. n = 202 cells (WT) and 240 cells (Spartin KO) from three independent experiments, median with interquartile range, n.s. not significant, two-tailed unpaired Welch’s t-test. Source numerical data and unprocessed blots are available in source data. Source data
Extended Data Fig. 6
Extended Data Fig. 6. Activation of spartin-mediated lipophagy in different metabolic perturbations.
Ratiometric fluorescence measurement of Keima–spartin in SUM159 wild-type cell in various conditions annotated below the graph. Cells were treated with 0.5 mM OA for 24 h and chased for 4 h after OA withdrawal together with metabolic perturbations (100 nM Baf A1 treatment, amino acid depletion, HBSS, or 250 nM Torin 1 addition). Median ± the 25th to 75th percentiles, the whiskers extended to the minima and the maxima, n = 11 cells (Baf A1), 12 cells (OA withdrawal), 10 cells (AA depletion), 10 cells (HHBS), and 11 cells (Torin1) from two independent experiments. Source numerical data are available in source data. Source data
Extended Data Fig. 7
Extended Data Fig. 7. Spartin is expressed in neurons of the mouse motor cortex.
Confocal micrographs of the M1 motor cortex slices from 9-week-old wild-type mice. PFA-fixed sagittal sections were co-stained with anti-spartin (magenta) and anti-MAP2 (a neuronal marker; green in the top panels) or anti-GFAP (an astrocyte marker; green in the lower panels). Spartin signals localized on neuronal cell bodies and projections (top). Slices stained with secondary antibodies alone (Alexa Fluor 488 and 594; bottom) were used as background signal controls. Scale bar: 10 μm.
Extended Data Fig. 8
Extended Data Fig. 8. Spartin deficiency does not affect motor neuron differentiation.
a, Scheme of the strategy used to target TRE3G-NIL to the AAVS1 locus. b, Genotyping PCR results for iPSC-AAVS1-TRE3G-NIL cell line. c, Karyotype of iPSC-AAVS1-TRE3G-NIL cell line. d, Parental and spartin KO iPSC clones were differentiated to motor neurons in the differentiation medium for 12 days. The cells were fixed and stained with MAP2 antibody. Scare bar: 10 μm.
Extended Data Fig. 9
Extended Data Fig. 9. Spartin-DN impairs LD turnover in SUM159 cells.
a, Confocal imaging of live SUM159 wild-type (top panel) and spartin KO (bottom panel) cells transiently expressing mScarlet-I-tagged spartin-DN or spartin full-length (Spartin-FL) proteins. LDs were stained with BODIPY493/503. Transfected cells were marked with yellow outline. Scale bars: 20 μm. b, Quantification of LD numbers per cell shown in (a). Mean ± SD, n = 58 cells (WT+mSc-I), 39 cells (WT+Spartin-DN), 37 cells (WT+Spartin-FL), 39 cells (Spartin KO+Spartin-DN), 33 cells (Spartin KO+Spartin-DN), and 30 cells (Spartin KO+Spartin-FL) from three independent experiments, n.s., not significant, ****p < 0.0001, one-way ANOVA, Dunnett’s multiple comparisons test. c, SUM159 wild-type cells transiently expressing mScarlet-I or mScarlet-I-spartin DN were pulse-labeled with [14C]-OA, and incorporation into TG was measured after treatment with 0.5 mM OA for 30 and 60 min. Values were calculated relative to cells expressing mScarlet-I highest value at 60 min. Mean ± SD, n = 6 independent experiments, n.s. not significant, two-way ANOVA, multiple comparisons test. d, Overlay live-cell confocal images of Keima–LiveDrop acquired by 488 nm (green) and 561 nm (magenta) excitations collected with a 607/36 nm emission filter, expressed in SUM159 wild-type, transiently transfected with Halo–spartin WT and DN constructs as described. Scale bars: 20 μm. e, Ratiometric fluorescence measurement of Keima–LiveDrop per cell shown in (d). Mean ± SD, n = 12 cells from three independent experiments, ****p < 0.0001, two-tailed unpaired t-test. f, Overlay live-cell confocal images of Keima–spartin-WT and Keima–spartin-DN acquired by 488 nm (green) and 561 nm (magenta) excitations collected with a 607/36 nm emission filter, expressed in SUM159 wild-type cells. g, Ratiometric fluorescence measurement of Keima signal per cell shown in (f). Mean ± SD, n = 14 cells from three independent experiments, ****p < 0.0001, two-tailed unpaired t-test. h, Confocal imaging of live SUM159 cells transiently expressing LAMP1-mNG and mScarlet-I–spartin-WT (top) or mScarlet-I–spartin-DN (bottom). Cells were treated with 0.5 mM OA for 24 h and chased for 3 h after OA withdrawal. Scale bars: full-size, 20 μm; insets, 2 μm. Source numerical data are available in source data. Source data
Extended Data Fig. 10
Extended Data Fig. 10. Major lipid class changes in the spartin-DN-infected M1 cortices.
ac, Lipidomic profiles of the AAV-infected M1 cortices. Lipids were extracted from tissues using an MTBE method and analyzed by LC-MS/MS positive ion mode. Absolute amounts of detected TG species, normalized by tissue weight (a). Relative fold changes of CE (b) and DAG (c) lipid classes. Box-and-whisker plot, Median ± the 25th to 75th percentiles, the whiskers extended to the minima and the maxima, n = 6 mice, **p < 0.01, ***p < 0.001, ****p < 0.0001 (a, 58:7 = 0.000754, 56:7 = 0.000393, 56:6 = 0.000444, 56:5 = 0.000738, 54:6 = 0.000463, 54:5 = 0.000426, 54:4 = 0.000849, 52:2 = 0.000516, 52:1 = 0.000452, 50:1 = 0.000688, 50:0 = 0.000782, 48:0 = 0.001107, 60:8 = 0.001432, 60:7 = 0.001566, 58:8 = 0.000339, 58:6 = 0.00057, 58:5 = 0.001099, 56:8 = 0.000765, 56:4 = 0.00035, 56:1 = 0.001576, 55:7 = 0.012073, 55:4 = 0.011659, 54:0 = 0.00632, 54:7 = 0.00109, 54:3 = 0.000166, 54:2 = 0.004482, 53:1 = 0.00169, 53:0 = 0.002413, 52:6 = 0.00086, 52:5 = 0.000911, 52:4 = 0.000621, 52:3 = 0.002428, 52:0 = 0.000684, 51:0 = 0.008827, 50:4 = 0.008494, 50:2 = 0.002913; c, 40:6 = 0.000276, 38:6 = 0.000118, 38:5 = 0.003104, 36:4 = 0.000045, 34:1 = 0.00001, 34:0 = 0.006981, 32:0 = 0.000003), Two-tailed unpaired t-test on each row, multiple comparisons test using the two-stage step-up method of Benjamini, Krieger and Yekutieli. Source numerical data are available in source data. Source data

Comment in

References

    1. Patel H, et al. SPG20 is mutated in Troyer syndrome, an hereditary spastic paraplegia. Nat. Genet. 2002;31:347–348. doi: 10.1038/ng937. - DOI - PubMed
    1. Olzmann JA, Carvalho P. Dynamics and functions of lipid droplets. Nat. Rev. Mol. Cell Biol. 2019;20:137–155. doi: 10.1038/s41580-018-0085-z. - DOI - PMC - PubMed
    1. Cruz ALS, et al. Lipid droplets: platforms with multiple functions in cancer hallmarks. Cell Death Dis. 2020;11:105–16. doi: 10.1038/s41419-020-2297-3. - DOI - PMC - PubMed
    1. Walther TC, Farese RV. Lipid droplets and cellular lipid metabolism. Annu. Rev. Biochem. 2012;81:687–714. doi: 10.1146/annurev-biochem-061009-102430. - DOI - PMC - PubMed
    1. Zechner R, Madeo F, Kratky D. Cytosolic lipolysis and lipophagy: two sides of the same coin. Nat. Rev. Mol. Cell Biol. 2017;18:671–684. doi: 10.1038/nrm.2017.76. - DOI - PubMed

Publication types

Supplementary concepts