. 2023 Jul 13;14(1):4165.
doi: 10.1038/s41467-023-39808-4.

Crosstalk between regulatory elements in disordered TRPV4 N-terminus modulates lipid-dependent channel activity

Affiliations

Crosstalk between regulatory elements in disordered TRPV4 N-terminus modulates lipid-dependent channel activity

Benedikt Goretzki et al. Nat Commun. .

Abstract

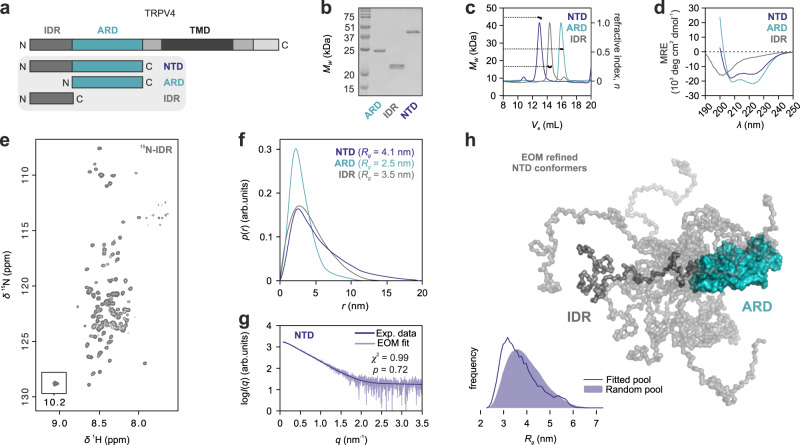
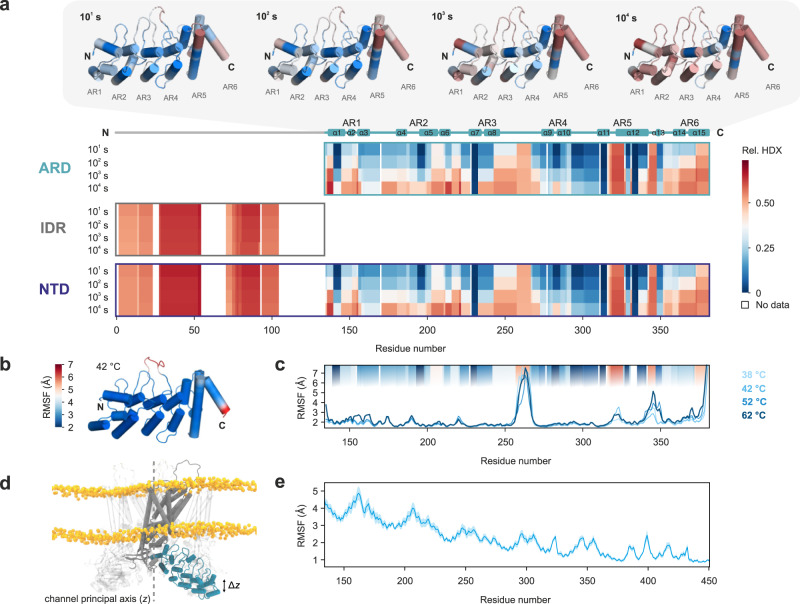
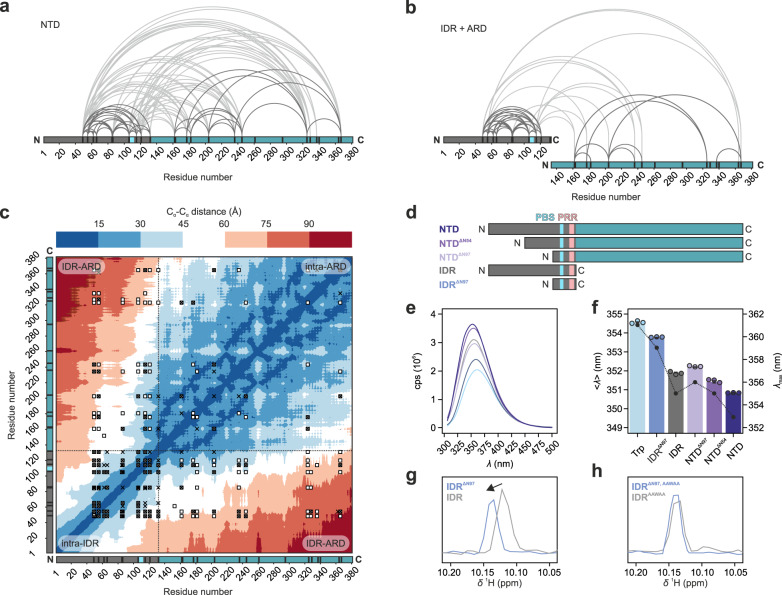
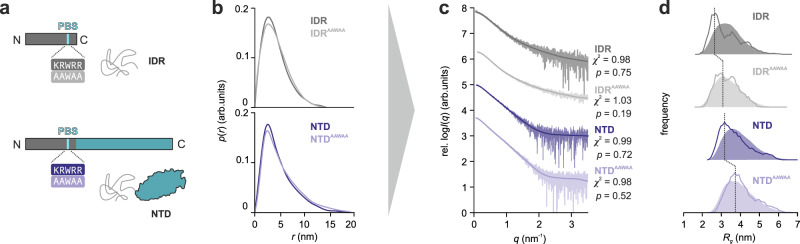
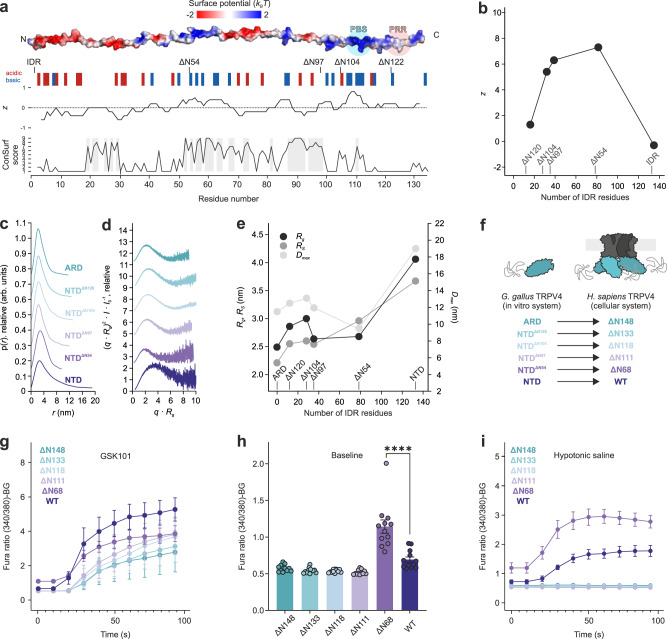
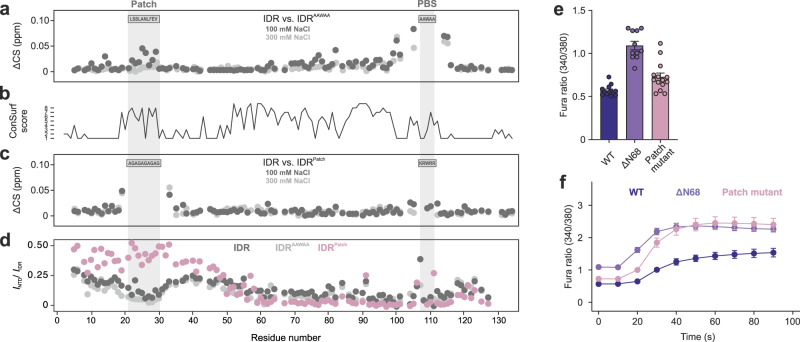
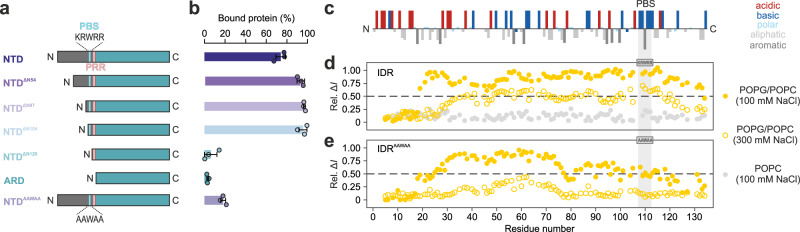
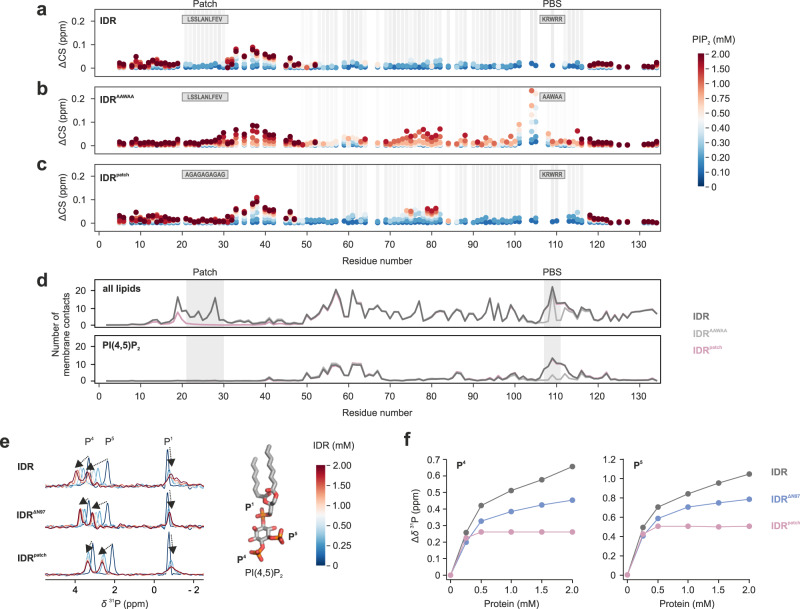
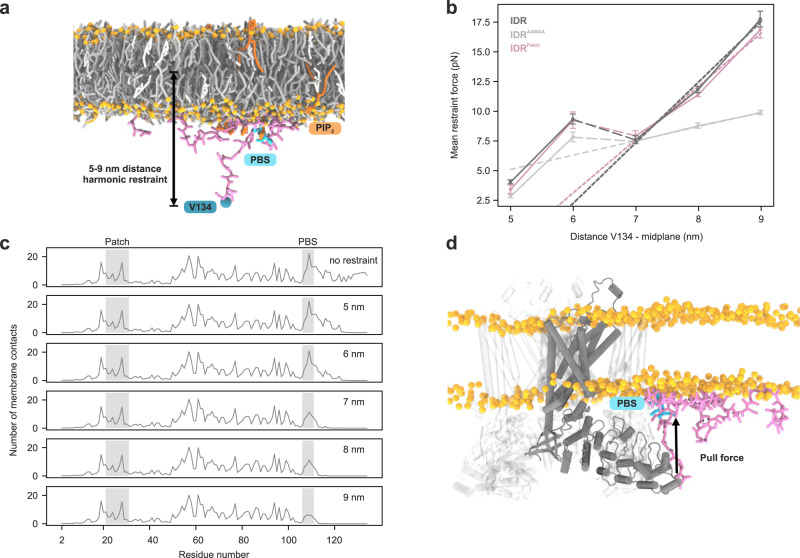
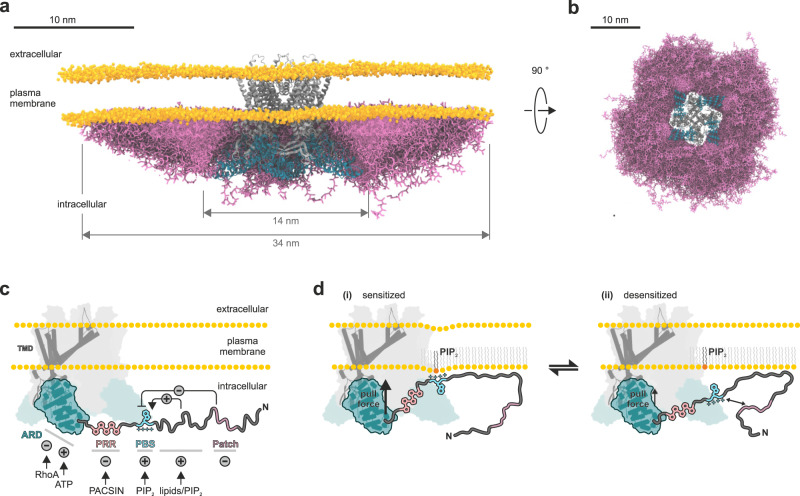
Intrinsically disordered regions (IDRs) are essential for membrane receptor regulation but often remain unresolved in structural studies. TRPV4, a member of the TRP vanilloid channel family involved in thermo- and osmosensation, has a large N-terminal IDR of approximately 150 amino acids. With an integrated structural biology approach, we analyze the structural ensemble of the TRPV4 IDR and the network of antagonistic regulatory elements it encodes. These modulate channel activity in a hierarchical lipid-dependent manner through transient long-range interactions. A highly conserved autoinhibitory patch acts as a master regulator by competing with PIP2 binding to attenuate channel activity. Molecular dynamics simulations show that loss of the interaction between the PIP2-binding site and the membrane reduces the force exerted by the IDR on the structured core of TRPV4. This work demonstrates that IDR structural dynamics are coupled to TRPV4 activity and highlights the importance of IDRs for TRP channel function and regulation.


Conflict of interest statement

The authors declare no competing interests.

Figures

Fig. 1
Fig. 1. Structural ensemble of the TRPV4 N-terminal domain.
a TRPV4 N-terminal constructs used for structural analyses. bd Purified TRPV4 N-terminal constructs analyzed by Coomassie-stained SDS-PAGE b, SEC-MALS c, and CD spectroscopy d. SDS-PAGE in b comparing all constructs side by side was carried out once to evaluate sample purity and respective molecular weight. e [1H, 15N]-TROSY-HSQC NMR spectrum of 15N-labeled TRPV4-IDR (see Supplementary Fig. 2 for backbone assignments). f, g SAXS pair-distance-distribution f and SAXS EOM (Ensemble Optimization Method) g, both in arbitrary units (arb. units), of TRPV4 N-terminal constructs (Supplementary Fig. 3). The real-space distance distribution yields a radius of gyration of Rg = 3.4 nm with a maximal particle dimension of Dmax = 14.0 nm for the IDR, Rg = 4.1 nm and Dmax = 19 nm for the NTD as well as Rg = 2.5 nm and a Dmax = 11.5 nm for the ARD. Every protein exhibits levels of conformational heterogeneity and the p(r) profiles should be interpreted as the summed volume-fraction weighted contribution within the sample population, and not as single-particle distributions. The statistical analyses of the fit in g was carried out using the reduced χ2 method (one-tailed distribution) and CorMap (one-tail Schilling distribution) test methods. The determined χ2 and CorMap p values are indicated in the corresponding graph. h NTD ensemble refined by EOM (Ensemble Optimization Method),. Using a chain of dummy residues for the IDR and the X-ray structure of the TRPV4 ARD (PDB: 3W9G) as templates, a library of 10,000 NTD structures was generated and refined against the experimental data, allowing the comparison of the fitted versus the random pool and selecting a sub-set of ensemble-states representing the experimental data. Ten IDR conformers best representing the experimental scattering profile are depicted. Source data are provided as a Source Data file.
Fig. 2
Fig. 2. Structural dynamics of the TRPV4 ARD.
a HDX of TRPV4 NTD and its isolated subdomains. Low (blue) to high (red) HDX shown for four time points. Areas without HDX assignment are colored white. For the ARD, HDX was visualized on the available X-ray structure of the G. gallus TRPV4 ARD (PDB: 3W9G). The six ankyrin repeats (AR) are indicated on top of the heat map diagram. b, c Root-mean-square fluctuations (RMSF) obtained from atomistic molecular dynamics (MD) simulations of the isolated G. gallus TRPV4 ARD in solution. RMSF at 42 °C mapped onto the ARD X-ray structure (PDB: 3W9G) b and RMSF per residue in simulations at increasing temperatures c. For comparison, HDX profiles after 102 s from a are displayed in the plot background. d, e RMSF of the ARD with respect to the central TRPV4 axis obtained from 1 µs long MD simulations of the complete TRPV4 core (see also Supplementary Movie 1). d Schematic depiction of the MD simulation setup. The channel principal axis (defined as z) is indicated as a dashed vertical line. The RMSF was calculated as the square root of the variance of the motion along this axis (∆z). e RMSF of TRPV4 residues 134–450 comprising the ARD. The solid line represents the average RMSF from all four protomers, the light area indicates the standard error of the mean. Source data are provided as a Source Data file.
Fig. 3
Fig. 3. Long-range intra- and interdomain interactions of the TRPV4 NTD.
a, b Cross-linking mass spectrometry was used to probe interactions within and between IDR and ARD using either a the entire NTD or b isolated IDR (gray) and ARD (cyan) in a 1:1 ratio. Lysine residues are indicated by black tick marks, the PIP2-binding site is marked light blue. Intradomain crosslinks are shown by curved lines in dark gray, interdomain crosslinks in light gray. c Heat map of Cɑ-Cɑ distances for an NTD conformational ensemble consisting of 15 EOM-refined conformers based on SAXS data of the NTD (Fig. 1h). Crosslinks are highlighted by white squares (NTD), black crosses (equimolar ARD:IDR mixture) or white squares filled with black crosses (both experimental set-ups). d TRPV4 N-terminal constructs used for tryptophan fluorescence (PBS: PIP2-binding site, PRR: proline rich region). e, f Tryptophan fluorescence spectroscopy of TRPV4 N-terminal constructs (IDR, NTD, NTDΔN54 and NTDΔN97 lacking the first 54 or 97 amino acids, respectively, and IDRΔN97 (comprising PIP2 binding site, surrounding basic residues and proline rich region) or isolated amino acid in buffer (Trp). Residue W109 in the PIP2 binding site is the sole tryptophan residue in the entire NTD. Fluorescence intensity is presented in counts per second (cps). Bars represent the intensity weighted fluorescence emission wavelength <λ > (left axis). Data are presented as the mean value ± SEM from n = 3 individual experiments. The fluorescence emission maximum λmax is shown by black circles connected through dotted lines (right axis). g, h 1H chemical shift differences of W109 sidechain amide between IDR and IDRΔN97 as well as their respective counterparts harboring the PIP2 binding site (107KRWRR111) mutation to 107AAWAA111. Source data are provided as a Source Data file.
Fig. 4
Fig. 4. The PIP2-binding site promotes compact IDR conformations.
a Constructs used in SEC-SAXS experiments. b Real-space pair-distance distribution functions, or p(r) profiles, in arbitrary units (arb. units), calculated for IDR and IDRAAWAA (gray curves) as well as NTD and NTDAAWAA (blue curves). p(r) functions were scaled to an area under the curve of 1. The real-space distance distribution of IDRAAWAA yields a radius of gyration of Rg = 3.5 nm with a maximal particle dimension of Dmax = 14.5 nm (native IDR: Rg = 3.4 nm, Dmax = 14.0 nm). NTDAAWAA has a Rg = 4.5 nm and a Dmax = 19.5 nm (native NTD: Rg = 4.1 nm, Dmax = 19.0 nm). c Fit between EOM-refined IDR and NTD models and experimental scattering data, in arbitrary units (arb. units). The statistical analyses of the fits were carried out using the reduced χ2 method (one-tailed distribution) and CorMap (one-tail Schilling distribution) test methods. The determined χ2 and CorMap p values are indicated in the corresponding graphs. d Comparison between Rg values of IDR and NTD variants between random pool structure library (solid area) and EOM refined models (dotted line). Source data are provided as a Source Data file.
Fig. 5
Fig. 5. The distal N-terminus affects the structural NTD ensemble and TRPV4 channel activity.
a Topology of NTD truncations showing the charge distribution z (www.bioinformatics.nl/cgi-bin/emboss/charge) and sequence conservation (ConSurf) along the IDR. b Overall charge (z) in the IDR at physiological pH (7.4) depending on the IDR length (values determined with ProtPi, www.protpi.ch). c Normalized real-space distance distribution p(r), in arbitrary units (arb. units), of NTD and NTD deletion constructs. d Dimensionless Kratky plot of NTD and NTD deletion mutants. e Radius of gyration (Rg) and Stokes radius (RS) determined from the real-space distance distribution in a and the SEC analysis (Supplementary Fig. 5c), respectively, plotted versus the number of IDR residues the NTD constructs. The maximum particle dimension (Dmax) is plotted on the right y-axis. f N-terminal deletion mutants in the in vitro (G. gallus) and in cellulo (H. sapiens) systems. g Activation of TRPV4 constructs with the synthetic agonist GSK101 shows plasma membrane targeting and structural integrity of all constructs. Data are presented as mean values ± SEM from n = 6 biologically independent experiments, each with 10–30 cells per field of view. h Basal Ca2+ levels in MN-1 cells expressing different TRPV4 constructs. Data are presented as mean values ± SEM from n = 12 biologically independent experiments, each with 10–30 cells per field of view. The **** indicates a p value of p < 0.0001 (one-way ANOVA with Dunnett’s multiple comparison test). i Stimulation of Ca2+ flux by hypotonic saline at t = 20 s in MN-1 cells expressing different TRPV4 constructs. Data are presented as mean values ± SEM from n = 6 biologically independent experiments, each with 10–30 cells per field of view. Source data are provided as a Source Data file.
Fig. 6
Fig. 6. A highly conserved patch in the N-terminal TRPV4 IDR transiently interacts with the C-terminal PIP2 binding site and autoinhibits TRPV4 function.
a Chemical shift differences at high and low salt between 15N-labeled native IDR and IDRAAWAA with a mutated PIP2 binding site (PBS) shows that mutagenesis of the PBS leads to chemical shift changes in the conserved N-terminal patch. At the higher salt concentration (light gray), these chemical shift perturbations are significantly reduced. b Degree of conservation in TRPV4 IDR determined with ConSurf (Supplementary Fig. 11). c Chemical shift differences at high and low salt between 15N-labeled IDR and IDRPatch with a mutation in the conserved N-terminal patch shows that mutagenesis leads to chemical shift changes in the PBS. At the higher salt concentration (light gray), these chemical shift perturbations are significantly reduced. d Relative peak intensity of IDR, IDRAAWAA and IDRPatch residues in the isolated IDR or in context of the ARD (i.e., NTD, NTDAAWAA or NTDPatch). All protein concentrations used were 100 µM. A value of 0.5 indicates that peak intensities for a respective IDR residue are halved when the ARD is present, a value of zero represents complete line broadening in the context of the NTD. Accordingly, lower values are indicative of IDR/ARD interactions. e, f Ca2+ imaging of hsTRPV4 variants expressed in MN-1 cells. e Basal Ca2+ and f hypotonic treatment at t = 20 s show increased activity of the patch mutant. For better comparison, data for TRPV4ΔN68 are replotted from Fig. 5h, i. Data in e are presented as mean values ± SEM from n = 13 (TRPV4), 11 (TRPV4ΔN68), 14 (TRPV4Patch) and in f from n = 12 (TRPV4, TRPV4ΔN68, and TRPV4Patch) biologically independent experiments, each with 10–30 cells per field of view. Source data are provided as a Source Data file.
Fig. 7
Fig. 7. Extensive lipid binding in the IDR is negatively affected by the distal N-terminus.
a Topology of N-terminal deletion mutants used for liposome sedimentation assay. b Protein distribution between pellet (“bound protein”) or supernatant fraction after centrifugation, quantified via densitometry of SDS-PAGE protein bands using imageJ. Data are presented as the mean value ± SEM from n = 3 individual experiments. c Distribution of charged and hydrophobic residues in the TRPV4-IDR shows a gradient of a consecutively more basic and hydrophobic protein from N- to C-terminus. Plotted with the PepCalc tool (https://pepcalc.com/). d, e NMR signal intensity differences for 15N-labeled IDR variants (100 µM) in the absence and presence of POPC (light gray circles) or POPC-POPG containing liposomes at low (filled yellow circles) or high salt concentration (open yellow circles). Higher values are indicative of lipid binding. Source data are provided as a Source Data file.
Fig. 8
Fig. 8. The conserved N-terminal patch modulates lipid binding to the IDR.
a, b, c Chemical shift perturbation of 15N-labeled a IDR, b IDRAAWAA, and c IDRPatch titrated with short-chain PIP2. Mutated regions are indicated in gray boxes, chemical shift changes are depicted by colored spheres, residues showing line broadening are highlighted by gray bars. d Average number of membrane contacts for each residue of the native IDR (dark gray), the IDRAAWAA mutant (light gray) and the IDRPatch mutant (mauve) on a lipid bilayer composed of POPC (69%), CHOL (20%), DOPS (10%), PIP2 (1%) (Supplementary Table 4). The location of the N-terminal patch and the PIP2-binding site (PBS) are highlighted by gray boxes. In the upper panel, contacts for all lipids, in lower panel, only contacts with PIP2 are shown. Four replicate simulations per IDR sequence were carried out for 38 µs and contact averages were calculated from the last ~28 µs of each simulation. e 31P NMR spectra of diC8-PIP2 (light blue) with increasing amounts of IDR, IDRΔN97 or IDRPatch. Chemical shift changes are indicated by arrows. f Chemical shift perturbations of P4 and P5 lipid headgroup resonances upon addition of IDR (gray), IDRΔN97 (blue), or IDRPatch (mauve). Source data are provided as a Source Data file.
Fig. 9
Fig. 9. PIP2 binding to the TRPV4 IDR’s PIP2-binding site exerts a pulling force on the ARD.
a Coarse-grained MD simulation system setup using a lipid bilayer membrane consisting of PIP2 (1%, dark orange) as well as POPC (69%, dark gray), DOPS (10%, light gray) and cholesterol (20%, white). Headgroup phosphates are shown as orange spheres), the IDR (pink liquorice) was kept at defined distances from the membrane midplane by its most C-terminal residue V134 (blue sphere) to emulate anchoring by the ARD. The PIP2-binding site (PBS) is highlighted in cyan. b Force displacement curves from restrained simulations of TRPV4 IDR, IDRAAWAA and IDRPatch. Four 38 µs replicate simulations were carried out for each condition. The mean restraint force is plotted against the mean distance between residue V134 and the membrane midplane. Dotted lines show linear fits of the force contribution of the PIP2-binding site. Averages were calculated from the last ~28 µs of each of the 4 replicate simulations per IDR genotype and per height restraint. Error bars show the standard errors of the mean (SEM) of the replicate simulations. c Number of membrane lipid contacts for each residue of the native IDR at a given height restraint (for results with IDRAAWAA and IDRPatch, see Supplementary Fig. 10c). Averages are calculated from the last 28 µs of each of the four replicate simulations. d Composite figure of a structure of the native IDR (from an MD simulation at a restraint distance of 7 nm) and an AlphaFold model of the transmembrane core of the G. gallus TRPV4 tetramer. The force displacement curves in b indicate that the interaction of the PIP2-binding site with the membrane exerts a pull force on the ARD N-terminus (solid arrow). Source data are provided as a Source Data file.
Fig. 10
Fig. 10. The TRPV4 IDR forms an extensive ‘belt’ along the membrane plane and encodes a hierarchy of antagonistic regulatory modules.
a, b Superimposed IDR conformations from coarse-grained MD simulations (pink licorice) integrated into a full-length TRPV4 tetramer (AlphaFold prediction of G. gallus TRPV4 transmembrane core (gray) and ARDs (cyan)) viewed from the side a and from the intracellular side b. For better visualization of the extent of the IDR ‘belt’, the IDR conformations of the front facing TRPV4 monomer have been deleted. For a view of the IDR conformations on a single TRPV4 subunit, see Supplementary Fig. 13 as well as Supplementary Movies 2 and 3. c The TRPV4 N-terminus encodes multiple antagonistic regulatory elements that regulate TRPV4 function through ligand, protein, lipid or intra-domain contacts. d PIP2-binding site interactions with the membrane exert a pull force on the IDR C-terminus. Likewise, pulling on the IDR can lead to membrane deformation. Crosstalk between the PIP2-binding site and the autoinhibitory patch modulates PIP2 binding and thus IDR membrane interactions, thereby influencing channel activity.

References

    1. Verkest C, et al. Intrinsically disordered intracellular domains control key features of the mechanically-gated ion channel PIEZO2. Nat. Commun. 2022;13:1365. - PMC - PubMed
    1. Magidovich E, Orr I, Fass D, Abdu U, Yifrach O. Intrinsic disorder in the C-terminal domain of the Shaker voltage-activated K+ channel modulates its interaction with scaffold proteins. Proc. Natl Acad. Sci. USA. 2007;104:13022–13027. - PMC - PubMed
    1. Warnet XL, Bakke Krog H, Sevillano-Quispe OG, Poulsen H, Kjaergaard M. The C-terminal domains of the NMDA receptor: how intrinsically disordered tails affect signalling, plasticity and disease. Eur. J. Neurosci. 2021;54:6713–6739. - PubMed
    1. Goretzki B, Guhl C, Tebbe F, Harder J-M, Hellmich UA. Unstructural biology of TRP ion channels: the role of intrinsically disordered regions in channel function and regulation. J. Mol. Biol. 2021;433:166931. - PubMed
    1. Goretzki B, Tebbe F, Mitrovic S-A, Hellmich UA. Backbone NMR assignments of the extensive human and chicken TRPV4 N-terminal intrinsically disordered regions as important players in ion channel regulation. Biomol. NMR Assign. 2022;16:205–212. - PMC - PubMed

Publication types