. 2023 Aug;29(8):1954-1963.
doi: 10.1038/s41591-023-02443-z. Epub 2023 Jul 13.

CSF MTBR-tau243 is a specific biomarker of tau tangle pathology in Alzheimer's disease

Affiliations

CSF MTBR-tau243 is a specific biomarker of tau tangle pathology in Alzheimer's disease

Kanta Horie et al. Nat Med. 2023 Aug.

Abstract

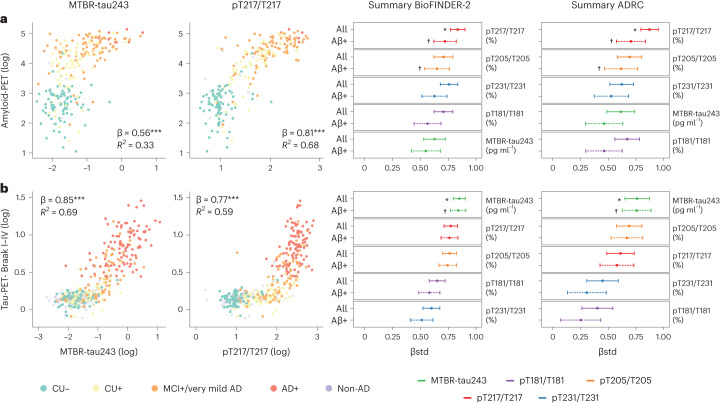
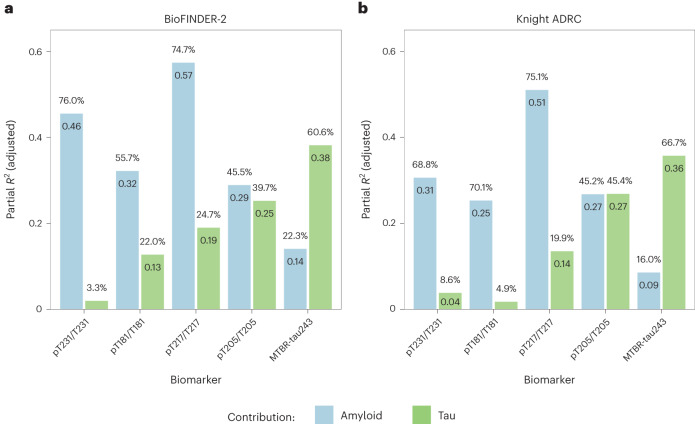
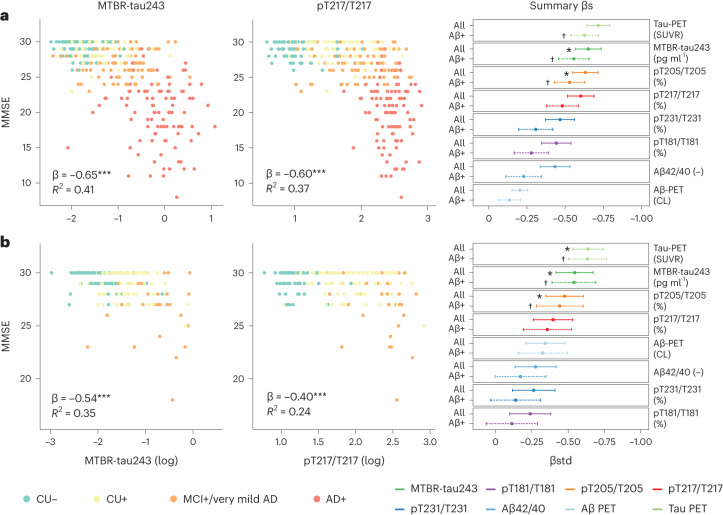
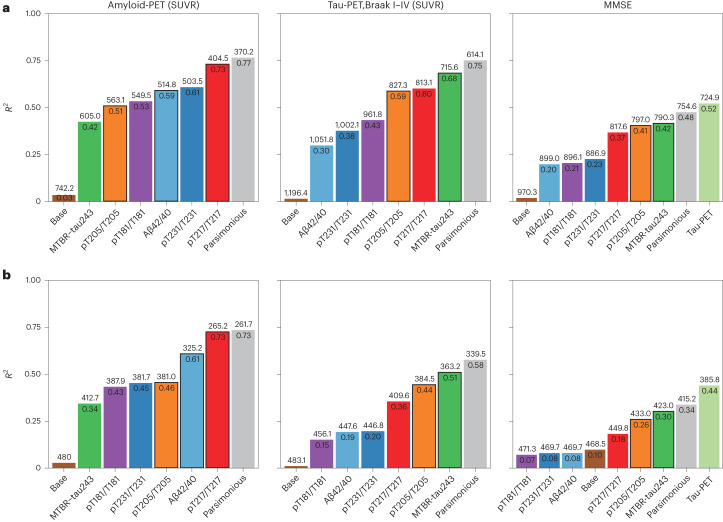
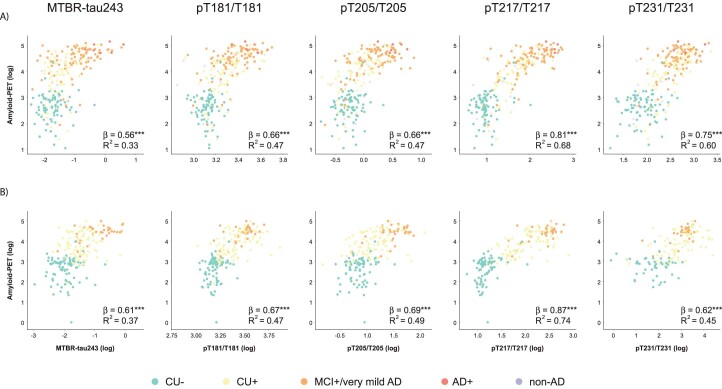
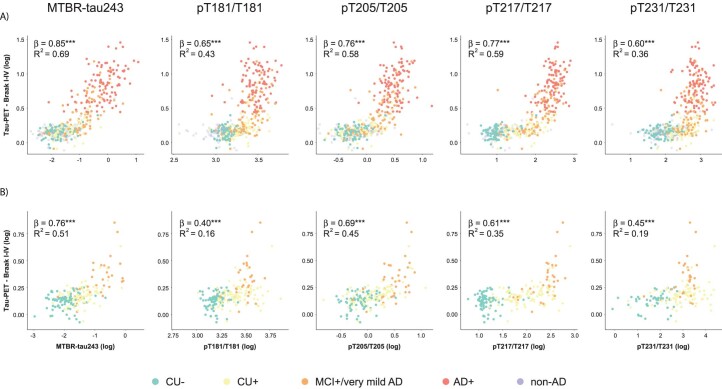
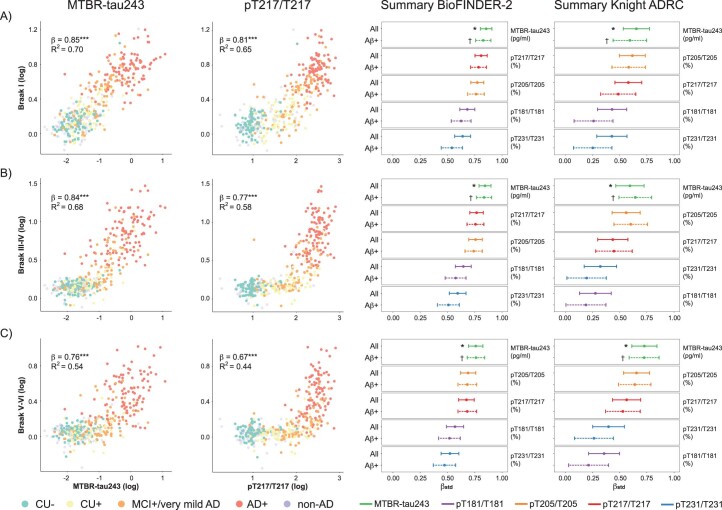
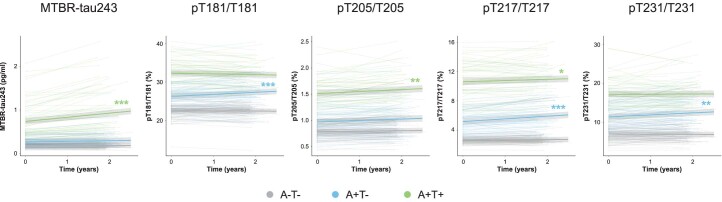
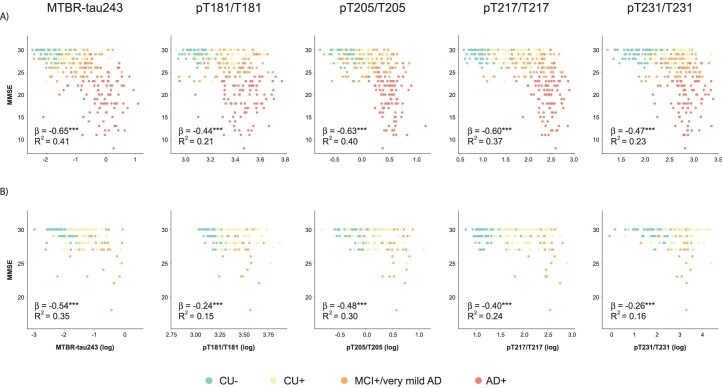
Aggregated insoluble tau is one of two defining features of Alzheimer's disease. Because clinical symptoms are strongly correlated with tau aggregates, drug development and clinical diagnosis need cost-effective and accessible specific fluid biomarkers of tau aggregates; however, recent studies suggest that the fluid biomarkers currently available cannot specifically track tau aggregates. We show that the microtubule-binding region (MTBR) of tau containing the residue 243 (MTBR-tau243) is a new cerebrospinal fluid (CSF) biomarker specific for insoluble tau aggregates and compared it to multiple other phosphorylated tau measures (p-tau181, p-tau205, p-tau217 and p-tau231) in two independent cohorts (BioFINDER-2, n = 448; and Knight Alzheimer Disease Research Center, n = 219). MTBR-tau243 was most strongly associated with tau-positron emission tomography (PET) and cognition, whereas showing the lowest association with amyloid-PET. In combination with p-tau205, MTBR-tau243 explained most of the total variance in tau-PET burden (0.58 ≤ R2 ≤ 0.75) and the performance in predicting cognitive measures (0.34 ≤ R2 ≤ 0.48) approached that of tau-PET (0.44 ≤ R2 ≤ 0.52). MTBR-tau243 levels longitudinally increased with insoluble tau aggregates, unlike CSF p-tau species. CSF MTBR-tau243 is a specific biomarker of tau aggregate pathology, which may be utilized in interventional trials and in the diagnosis of patients. Based on these findings, we propose to revise the A/T/(N) criteria to include MTBR-tau243 as representing insoluble tau aggregates ('T').


Conflict of interest statement

K.H. is an Eisai-sponsored voluntary research associate professor at Washington University and has received salary from Eisai. Washington University. R.J.B. and D.M.H. have equity ownership interest in C2N Diagnostics. R.J.B. and D.M.H. receive income from C2N Diagnostics for serving on the scientific advisory board. K.H., N.R.B., C.S. and R.J.B. may receive income based on technology (Methods to Detect MTBR-tau Isoforms and use Thereof) (PCT/US2020/046224) licensed by Washington University to C2N Diagnostics. H.J. and D.M.H. may receive income based on technology (Anti-tau MTBR Antibodies and Methods to Detect Endogenously Cleaved Fragments of Tau and uses Thereof) (USSN 63/400,345) licensed by Washington University to C2N Diagnostics. R.J.B. is an unpaid scientific advisory board member of Roche and Biogen and receives research funding from Avid Radiopharmaceuticals, Janssen, Roche/Genentech, Eli Lilly, Eisai, Biogen, AbbVie, Bristol Myers Squibb and Novartis. O.H. has acquired research support (for the institution) from ADx, Avid Radiopharmaceuticals, Biogen, Eli Lilly, Eisai, Fujirebio, GE Healthcare, Pfizer and Roche. In the past 2 years, he has received consultancy/speaker fees from AC Immune, Amylyx, Alzpath, BioArctic, Biogen, Cerveau, Eisai, Fujirebio, Genentech, Novartis, Roche and Siemens. S.E.S. has analyzed data provided by C2N Diagnostics to Washington University, but she has not received any research funding or personal compensation from C2N Diagnostics. She has served on a scientific advisory board for Eisai. D.M.H. is on the scientific advisory board of Genentech, Denali and Cajal Neurosciences and consults for Alector. S.P. has served on scientific advisory boards and/or given lectures in symposia sponsored by BioArtic, Biogen, Cytox, Eli Lilly, Geras Solutions and Roche. The remaining authors declare no competing interests.

Figures

Fig. 1
Fig. 1. Associations between CSF biomarkers and amyloid-PET and tau-PET.
a,b, Associations between CSF biomarkers and amyloid-PET (a) and tau-PET (b). First two columns show scatter-plots of MTBR-tau243 (first column) and pT217/T217 (second column) and amyloid-PET (n = 268) or tau-PET (n = 443) in BioFINDER-2 participants, color-coded by diagnosis and amyloid status. Linear regression models, adjusting for age and sex, were used to obtain β, P values (asterisks) and R2 shown in the plots. Scatter-plots for all the biomarkers in both cohorts are shown in Extended Data Figs. 1 and 2. The third and fourth columns show standardized β (βstd) of the association between each CSF biomarker and amyloid- or tau-PET in BioFINDER-2 and Knight ADRC participants (n = 219; except for pT231/T231 in which n = 184 for all cases), respectively. Solid and dashed lines show standardized β (central dot) and 95% CI when all participants or only amyloid-positive participants (BioFINDER-2, amyloid-PET, n = 172, tau-PET, n = 287; Knight ADRC, n = 136; except for pT231/T231 in which n = 117) were included, respectively. Asterisks (crosses) show the highest or not significantly different standardized β in all (amyloid-positive only) participants, in each cohort and outcome based on bootstrapping. Thus, those biomarkers without asterisks or crosses have statistically weaker correlations. Aβ-positive participants were selected based on CSF Aβ42/40 previously validated cutoff values (CSF Aβ42/40 < 0.08 in BioFINDER-2 and CSF Aβ42/40 < 0.0673 in Knight ADRC). Association P values were derived from two-sided tests and bootstrapping P values were obtained from one-sided tests, all without adjustment for multiple comparisons. All P values from associations between CSF biomarkers and amyloid-PET and tau-PET were <0.001.
Fig. 2
Fig. 2. Proportion of variation of CSF biomarker levels explained by amyloid-PET and tau-PET.
a,b, Partial R2 values are displayed within the columns and the percentages of partial R2 over the total R2 of the model are indicated above each column for BioFINDER-2 (a) and Knight ADRC participants (b). These values were computed using individual CSF biomarkers as outcomes and amyloid and tau measures as predictors in linear regression models adjusted for age and sex, within each CSF biomarker and cohort. The percentages may not sum up to 100% due to potential shared variance. The biomarkers are arranged from left to right based on the increasing contribution (%) of tau to their levels.
Fig. 3
Fig. 3. Longitudinal CSF biomarkers change by baseline amyloid and tau status.
Rates of change in CSF biomarkers per baseline amyloid (A) and tau (T) status are depicted (pT231/T231: n = 218, rest: n = 220). Individual rates of change are represented by dots. Trajectories for each group are displayed as boxplots, which were generated using linear mixed models (the central band represents the median, the lower and upper hinges correspond to the first and third quartiles and the whiskers depict the maximum/minimum value or 1.5 × interquartile range from the hinge, whichever is lower). Differences among all groups were assessed using Kruskal–Wallis tests and pairwise Wilcoxon tests were employed for post hoc comparisons. Asterisks indicate the P values from two-sided tests without correction for multiple comparisons. Longitudinal CSF data was available only in BioFINDER-2. Amyloid-positive participants were identified using a previously validated cutoff for CSF Aβ42/40 (CSF Aβ42/40 < 0.08). Tau positivity was determined based on tau-PET SUVR in the meta-ROI (Braak I-IV, SUVR > 1.32). ROI, region of interest. The actual P values for A−T− versus A+T− were P = 0.011 (pT205/T205); for A−T− versus A+T+ were P = 0.011 (pT181/T181), P = 0.014 (pT205/T205), P = 0.617 (pT217/T217) and P = 0.980 (pT231/T231); and for A+T− versus A+T+ were P = 0.788 (pT205/T205), P = 0.007 (pT231/T231). All other comparisons yielded P < 0.001. *P < 0.050; **P < 0.010; ***P < 0.001.
Fig. 4
Fig. 4. Associations between CSF biomarkers and MMSE.
a,b, Associations between CSF biomarkers and MMSE are depicted for BioFINDER-2 (a, n = 342) and Knight ADRC (b, pT231/T231: n = 184, rest: n = 219) participants. The first two columns display scatter-plots of MTBR-tau243 (first column) and pT217/T217 (second column) against MMSE, color-coded by diagnosis and amyloid status. In the BioFINDER-2 cohort, orange dots represent MCI+ participants, while in the Knight ADRC cohort, they represent individuals with very mild AD. Linear regression models, adjusted for age, sex and years of education were utilized to obtain β coefficients, P values (asterisks) and R2 values shown in the plots. Scatter-plots for all biomarkers in both cohorts can be found in Extended Data Fig. 4. The third column shows the standardized β coefficients for all biomarkers, along with the associations of amyloid-PET and CSF Aβ42/40 (reversed) and tau-PET for comparison. Solid and dashed lines represent the standardized β coefficients (central dot) and 95% CI when including all participants or only amyloid-positive participants (BioFINDER-2, n = 261; Knight ADRC, n = 136, except for pT231/T231, where n = 117), respectively. Asterisks (crosses) indicate the highest or not significantly different standardized β coefficients in all (amyloid-positive only) participants within each cohort and outcome, based on bootstrapping. Non-AD participants from BioFINDER-2 were excluded from these analyses. Amyloid-positive participants were selected using previously validated cutoffs for CSF Aβ42/40 (CSF Aβ42/40 < 0.08 in BioFINDER-2 and CSF Aβ42/40 < 0.0673 in Knight ADRC). Association P values were derived from two-sided tests and bootstrapping p values were obtained from one-sided tests, all without adjustment for multiple comparisons. All p values for associations between CSF biomarkers and MMSE were <0.001.
Fig. 5
Fig. 5. Predicting quantitative amyloid-PET, tau-PET and MMSE continuous measures with CSF biomarkers.
a,b, Linear regression models were employed to predict amyloid-PET (first column, BioFINDER-2, n = 256), tau-PET (second column, BioFINDER-2, n = 422) and cognition (MMSE, third column, BioFINDER-2, n = 342) in BioFINDER-2 (a) and Knight ADRC (b, n = 184). The base model included age and sex (and years of education for MMSE) as predictors. The parsimonious model was derived by using LASSO regression to identify the optimal combination of CSF biomarkers and demographic factors (age, sex and/or years of education). Biomarkers included in the parsimonious models are indicated by a black border and their names are shown in bold. The other models solely employed individual CSF biomarkers as predictors. For comparison, CSF Aβ42/40 and tau-PET were used as predictors in independent models for predicting all outcomes and cognition only, respectively. Model comparisons were conducted using an F-test for nested models or Vuong’s test for non-nested models. Non-AD cases were excluded from the BioFINDER-2 cohort for the cognition analyses.
Extended Data Fig. 1
Extended Data Fig. 1. CSF biomarkers by diagnosis.
Levels of each CSF biomarkers by clinical diagnosis and amyloid status in the BioFINDER-2 cohort (n = 448). Amyloid-positive participants were selected based on CSF Aβ42/40 (CSF Aβ42/40 < 0.08). Larger pink dots represent two MAPT R406W mutation carriers (one CU- and the other in FTD groups), both amyloid-negative but with substantial tau-PET binding. In boxplots, central band represents the median of the group, the lower and upper hinges correspond to the first and third quartiles, and the whiskers represent the maximum/minimum value or the 1.5 IQR from the hinge, whatever is lower). Differences in CSF biomarker levels by diagnostic groups were tested using ANCOVA adjusted for age and sex. Post hoc analyses were performed two-sided using the Tuckey test. Actual p values are reported in Supplementary Table 1 for space reasons. p < 0.050; **, p < 0.010; ***, p < 0.001. Abbreviations: AD + , Alzheimer’s disease dementia amyloid positive; CBS, corticobasal syndrome; CU-, cognitively unimpaired amyloid negative; CU + , cognitively unimpaired amyloid positive; FTD, frontotemporal dementia; MCI + , mild cognitive impairment amyloid positive; MTBR, microtubule-binding region; PD, Parkinson’s disease; PDD, Parkinson’s disease dementia; PPA, primary progressive aphasia; PSP, progressive supranuclear palsy.
Extended Data Fig. 2
Extended Data Fig. 2. Associations between all CSF biomarkers and Aβ-PET.
Associations between CSF biomarkers and amyloid-PET (Centiloid) in BioFINDER-2 (A) and Knight ADRC (B) participants. Linear regression models, adjusting for age and sex, were used to obtain standardized β and p values shown in the plots. In the BioFINDER-2 cohort, orange dots represent MCI+ participants whereas in the Kinght-ADRC cohort, represent very mild AD.  *, p < 0.050; **, p < 0.010; ***, p < 0.001. Abbreviations: AD + , Alzheimer’s disease dementia amyloid positive; CL, Centiloids, CSF, cerebrospinal fluid; CU-, cognitively unimpaired amyloid negative; CU + , cognitively unimpaired amyloid positive; MCI + , mild cognitive impairment amyloid positive; MTBR, microtubule binding region; non-AD, non-Alzheimer’s disease dementia; PET, positron emission tomography.
Extended Data Fig. 3
Extended Data Fig. 3. Associations between all CSF biomarkers and tau-PET in the Braak I-IV ROI.
Associations between CSF biomarkers and tau-PET in the Braak I-IV ROI (SUVR) in BioFINDER-2 (A) and Knight ADRC (B) participants. Linear regression models, adjusting for age and sex, were used to obtain standardized β and p-values shown in the plots. In the BioFINDER-2 cohort, orange dots represent MCI+ participants whereas in the Kinght-ADRC cohort, represent very mild AD. *, p < 0.050; **, p < 0.010; ***, p < 0.001. Abbreviations: AD + , Alzheimer’s disease dementia amyloid positive; CSF, cerebrospinal fluid; CU-, cognitively unimpaired amyloid negative; CU + , cognitively unimpaired amyloid positive; MCI + , mild cognitive impairment amyloid positive; MTBR, microtubule binding region; non-AD, non-Alzheimer’s disease dementia; PET, positron emission tomography, SUVR, standardized uptake value ratio.
Extended Data Fig. 4
Extended Data Fig. 4. Associations between CSF biomarkers and tau-PET in different Braak regions.
Associations between CSF biomarkers and tau-PET in Braak I (A), Braak III–IV (B) and Braak V–VI (C) regions. First two columns show scatter-plots of MTBR-tau243 (first column) and pT217/T217 (second column) and tau-PET in BioFINDER-2 participants (n = 443), colored by diagnosis and amyloid status. Linear regression models, adjusting for age and sex, were used to obtain standardized β, p-values (asterisks) and R2 shown in the plots. Third and fourth columns show standardized β of the association between each CSF biomarker and tau-PET in BioFINDER-2 and Knight ADRC participants (n = 219; except for pT231/T231 in which n = 184), respectively. Solid and dashed lines show standardized β (central dot) and 95%CI when all participants or only amyloid positive participants (BioFINDER-2: n = 287; Knight ADRC, n = 136) were included, respectively. Asterisks (crosses) show the highest or not significantly different standardized β in all (amyloid positive only) participants, in each cohort and outcome. Amyloid-positive participants were selected based on CSF Aβ42/40 previously validated cutoffs (CSF Aβ42/40 < 0.08 in BioFINDER-2 and CSF Aβ42/40 < 0.0673 in Knight ADRC). Association p-values were based on two-sided tests and bootstrapping p-values from one-sided tests, all unadjusted for multiple comparisons. All p-values from associations between CSF biomarkers and tau-PET shown in the scatter-plots were <0.001. *, p < 0.050; **, p < 0.010; ***, p < 0.001. Abbreviations: Aβ + , amyloid positive; AD + , Alzheimer’s disease dementia amyloid positive; CSF, cerebrospinal fluid; CU-, cognitively unimpaired amyloid negative; CU + , cognitively unimpaired amyloid positive; MCI + , mild cognitive impairment amyloid positive; MTBR, microtubule binding region; non-AD, non-Alzheimer’s disease dementia; PET, positron emission tomography; SUVR, standardized uptake value ratio.
Extended Data Fig. 5
Extended Data Fig. 5. Longitudinal CSF biomarkers trajectories by baseline “A” and “T” status.
Individual (shaded lines) and group (bold lines) CSF biomarker levels trajectories over time based on their A/T baseline status. Statistical differences to the reference group (A-T-) are shown with asterisks with the appropriate color. Longitudinal CSF data was only available in BioFINDER-2. Amyloid-positive participants were selected based on a CSF Aβ42/40 previously validated cutoff (CSF Aβ42/40 < 0.08). Tau positivity was assessed based on tau-PET SUVR in the meta-ROI (Braak I-IV SUVR > 1.32). *, p < 0.050; **, p < 0.010; ***, p < 0.001. Abbreviations: A-T-, amyloid and tau negative; A + T-, amyloid positive and tau negative; A + T + , amyloid positive, tau positive; CSF, cerebrospinal fluid; MTBR, microtubule binding region; PET, positron emission tomography.
Extended Data Fig. 6
Extended Data Fig. 6. Associations between all CSF biomarkers and MMSE.
In BioFINDER-2 cohort (A), orange dots represent MCI+ participants whereas in the Kinght-ADRC cohort (B), represent very mild AD. Linear regression models, adjusting for age, sex and years of education were used to obtain standardized β and p-values shown in the plots. *, p < 0.50; **, p < 0.010; ***, p <0.001. Abbreviations: AD + , Alzheimer’s disease dementia amyloid positive; CSF, cerebrospinal fluid; CU-, cognitively unimpaired amyloid negative; CU + , cognitively unimpaired amyloid positive; MCI + , mild cognitive impairment amyloid positive; MMSE, Mini Mental State Examination; MTBR, microtubule binding region; PET, positron emission tomography, SD, standard deviation; SUVR, standardized uptake value ratio.

Comment in

  • A specific biomarker for insoluble tau.
    Crunkhorn S. Crunkhorn S. Nat Rev Drug Discov. 2023 Sep;22(9):697. doi: 10.1038/d41573-023-00126-5. Nat Rev Drug Discov. 2023. PMID: 37528207 No abstract available.

Similar articles

Cited by

References

    1. Ossenkoppele R, van der Kant R, Hansson O. Tau biomarkers in Alzheimer’s disease: towards implementation in clinical practice and trials. Lancet Neurol. 2022;21:726–734. - PubMed
    1. Smith R, Wibom M, Pawlik D, Englund E, Hansson O. Correlation of in vivo [18f]flortaucipir with postmortem Alzheimer disease tau pathology. JAMA Neurol. 2019;76:310–317. - PMC - PubMed
    1. Fleisher AS, et al. Positron emission tomography imaging with [18f]flortaucipir and postmortem assessment of Alzheimer disease neuropathologic changes. JAMA Neurol. 2020;77:829–839. - PMC - PubMed
    1. Smith R, et al. 18F-AV-1451 tau PET imaging correlates strongly with tau neuropathology in MAPT mutation carriers. Brain. 2016;139:2372–2379. - PMC - PubMed
    1. Soleimani-Meigooni DN, et al. 18F-flortaucipir PET to autopsy comparisons in Alzheimer’s disease and other neurodegenerative diseases. Brain. 2020;143:3477–3494. - PMC - PubMed

Publication types

MeSH terms