. 2023 Jul;3(7):866-893.
doi: 10.1038/s43587-023-00449-3. Epub 2023 Jul 13.

Chromatin accessibility dynamics of neurogenic niche cells reveal defects in neural stem cell adhesion and migration during aging

Affiliations

Chromatin accessibility dynamics of neurogenic niche cells reveal defects in neural stem cell adhesion and migration during aging

Robin W Yeo et al. Nat Aging. 2023 Jul.

Abstract

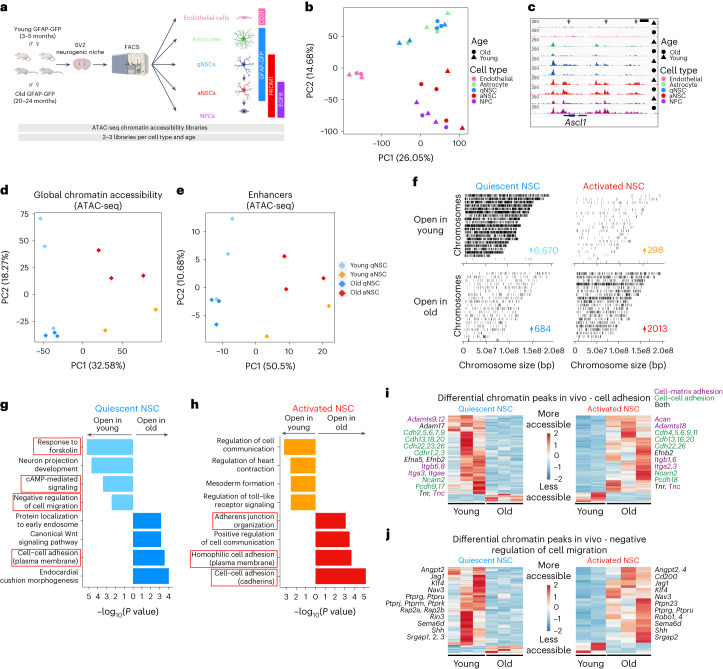
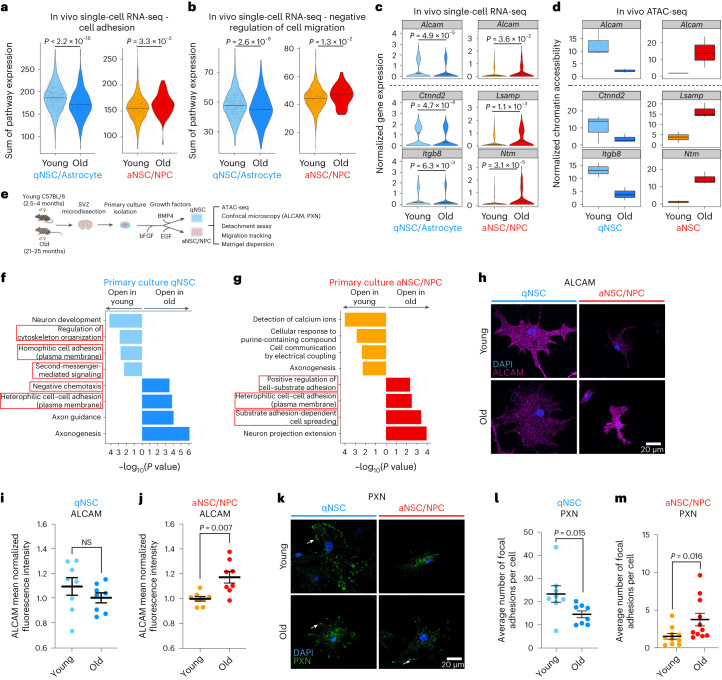
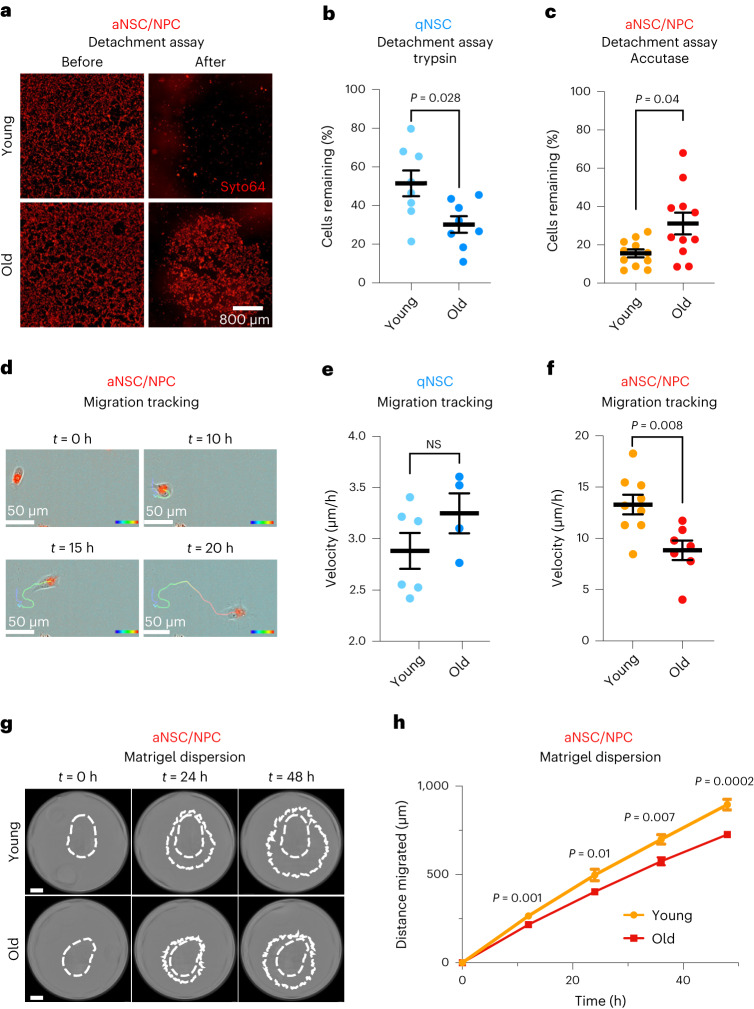
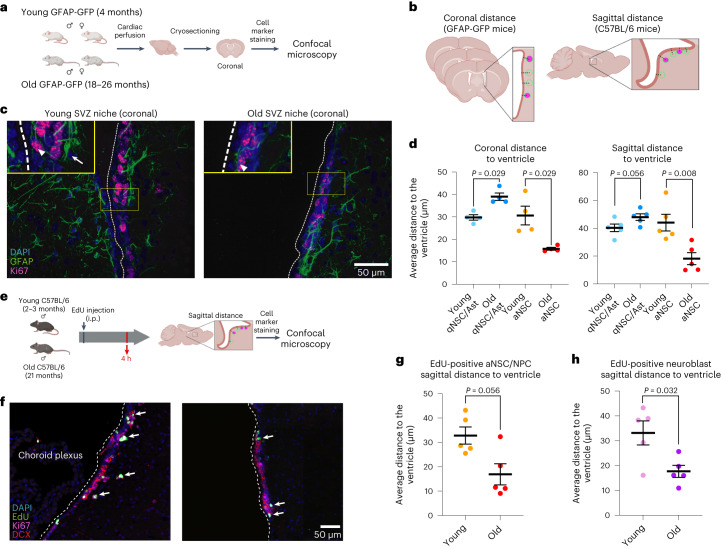
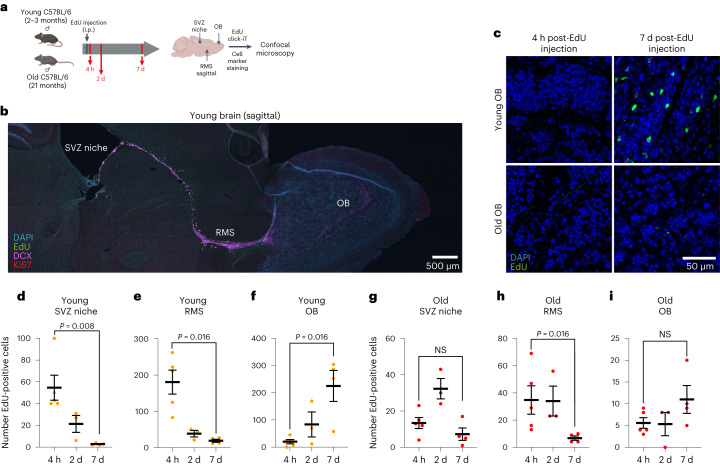
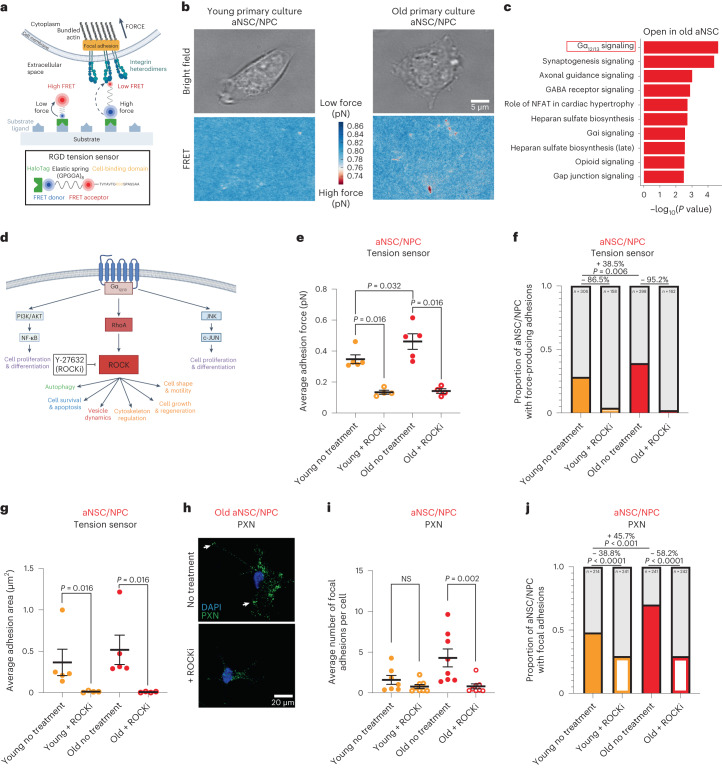
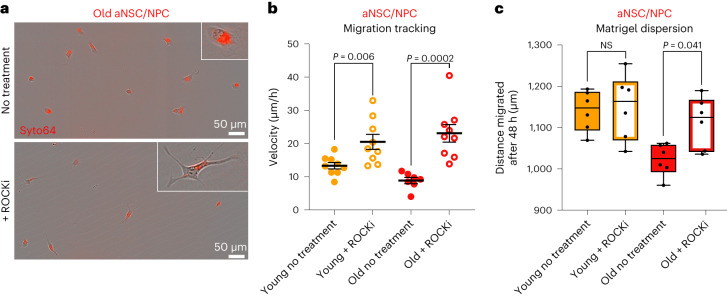
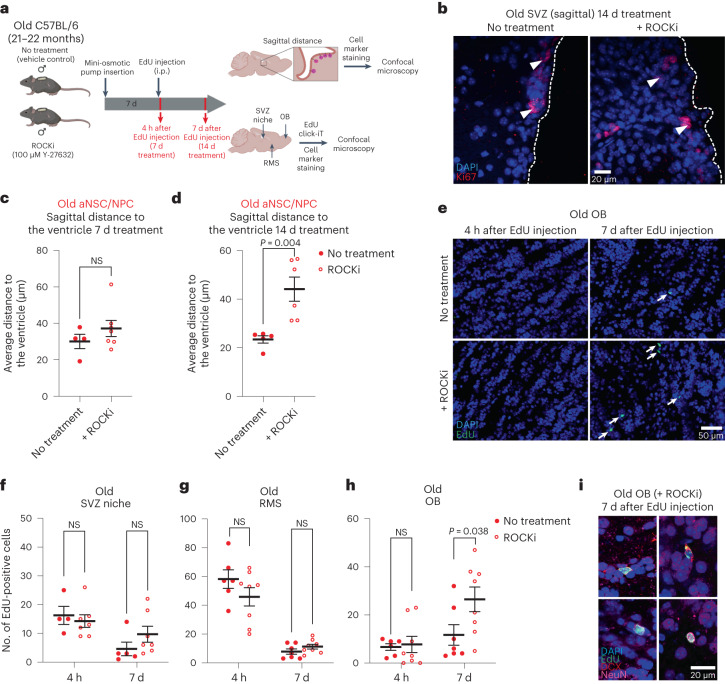
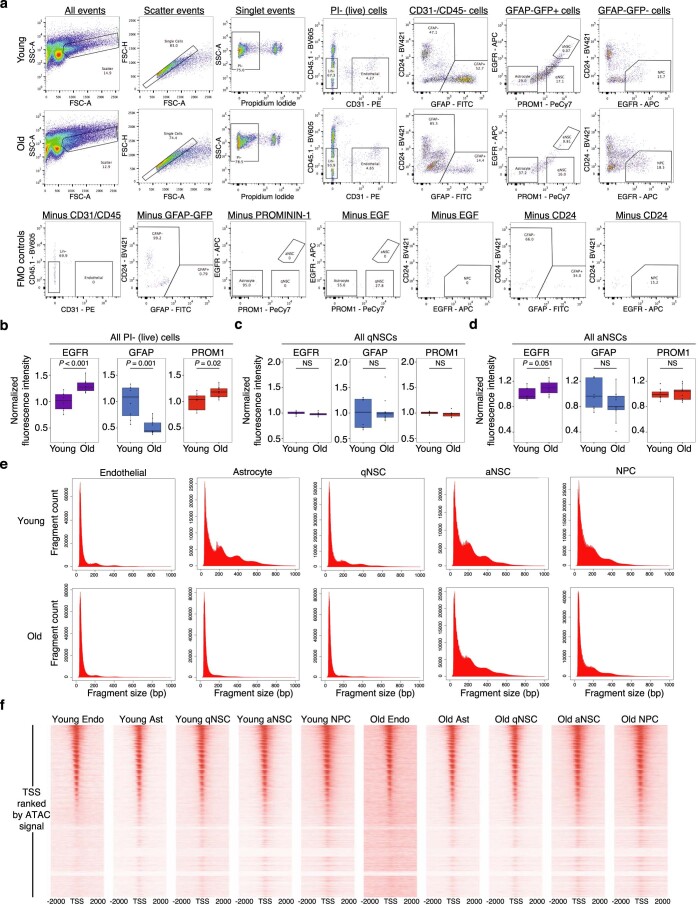
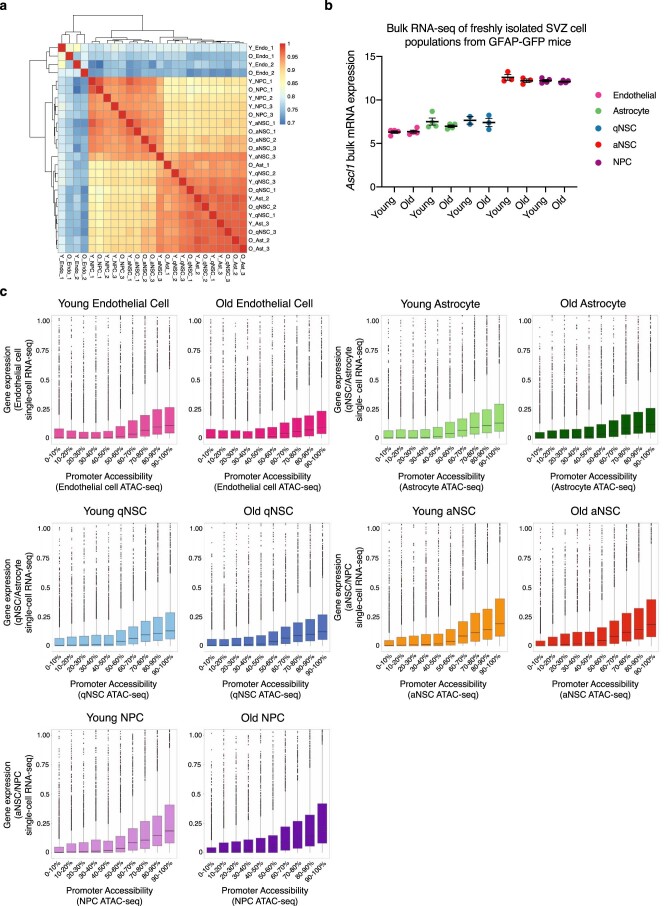
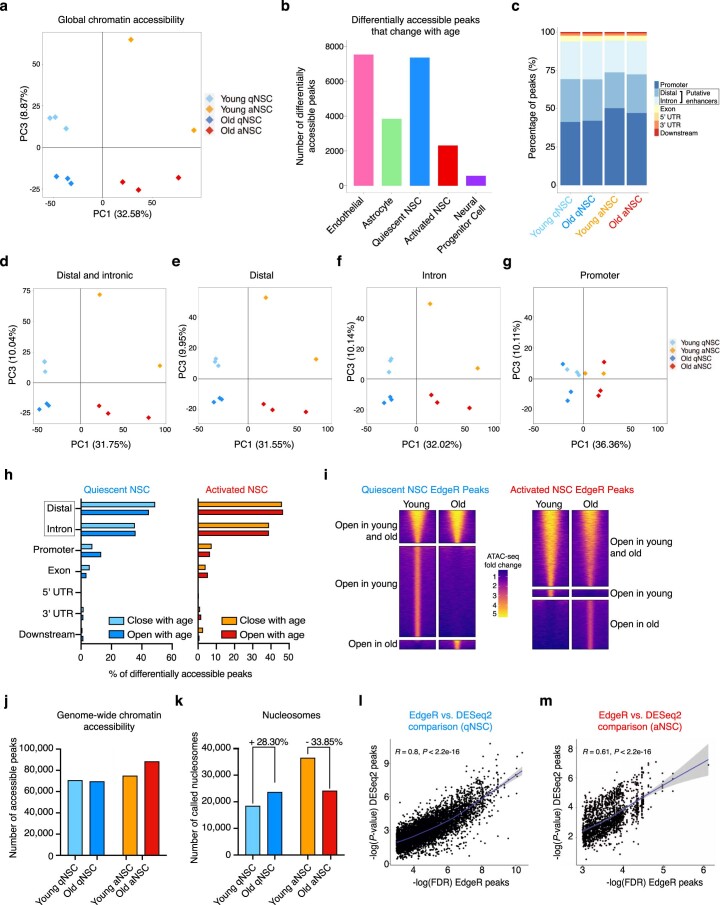
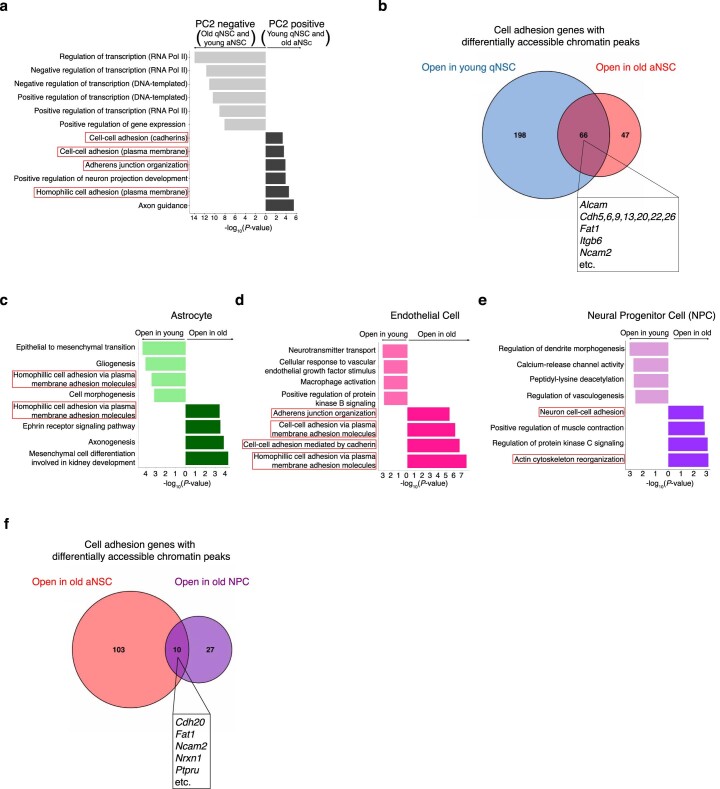
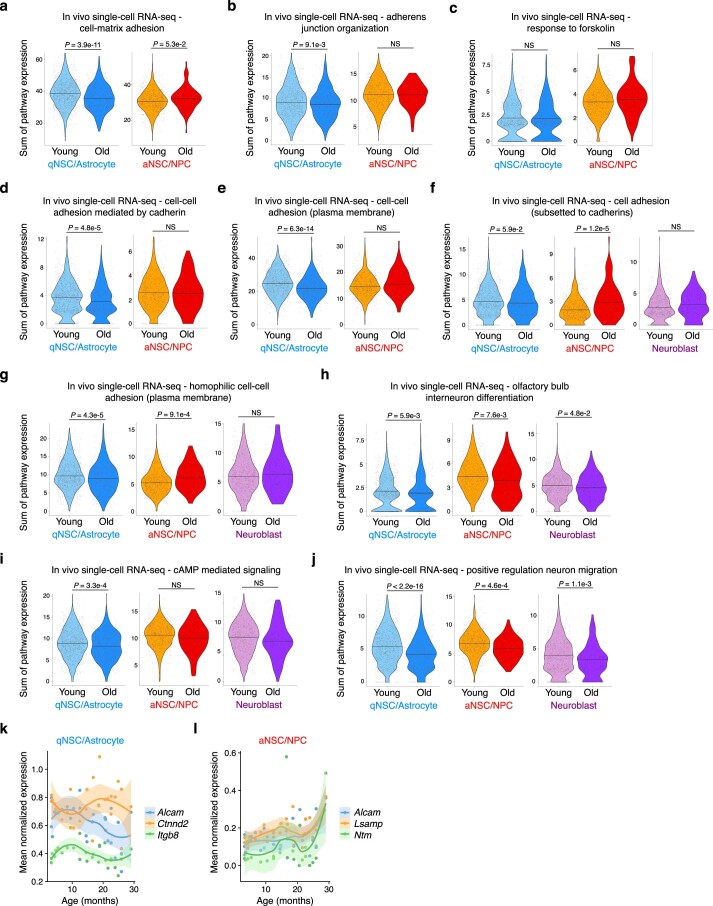
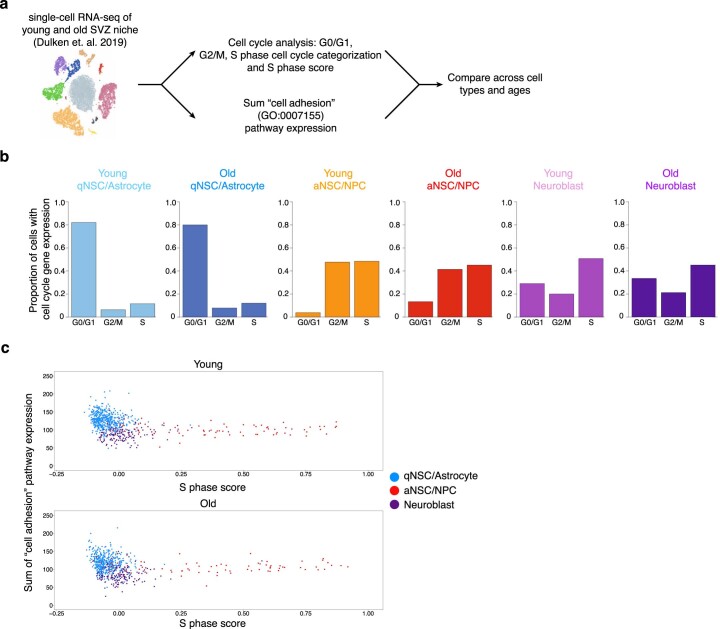
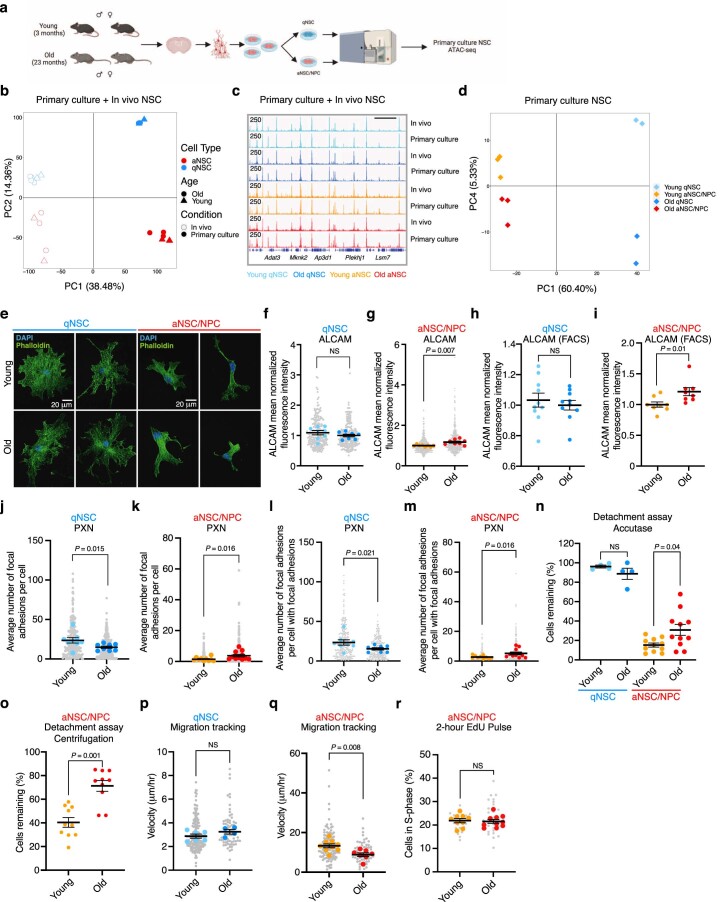
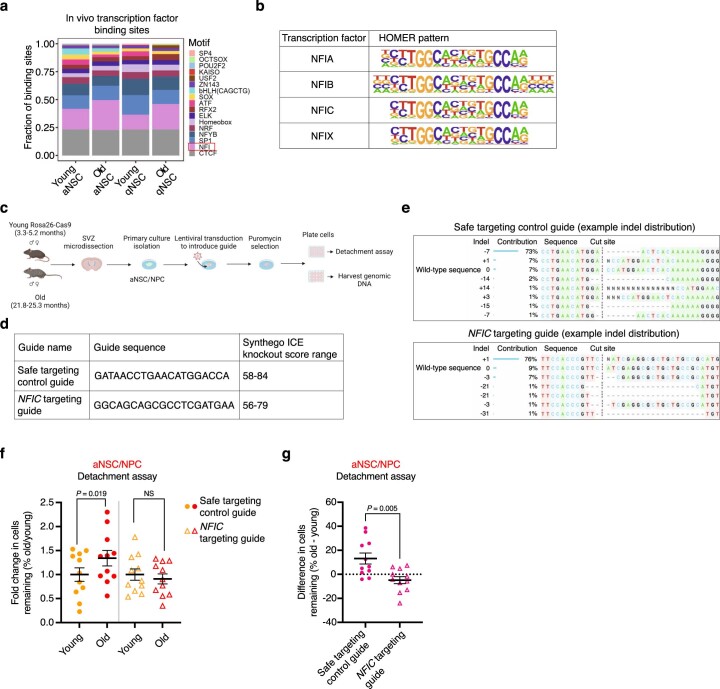
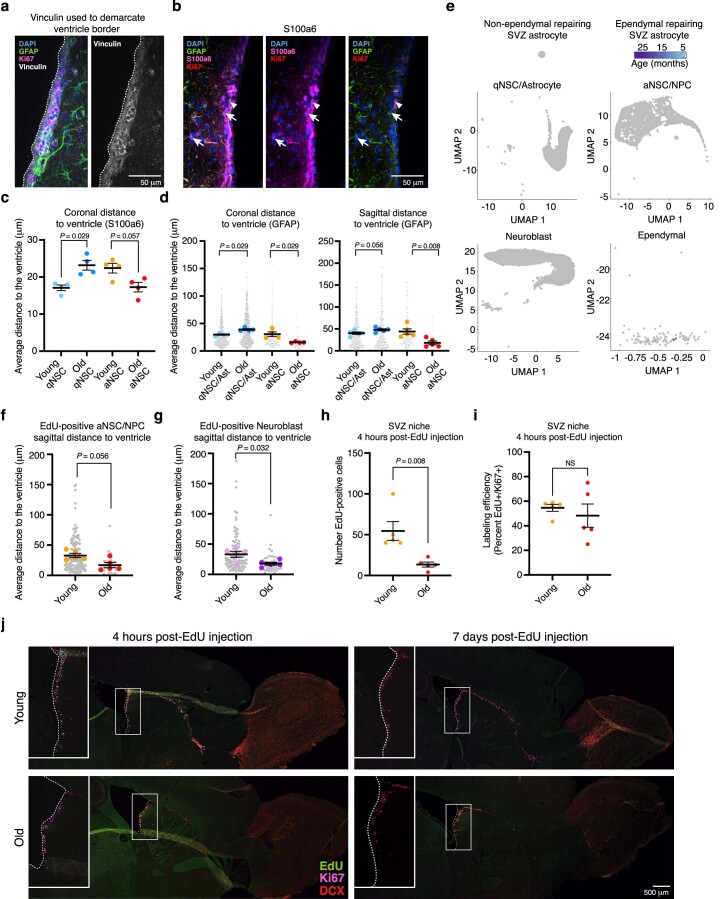
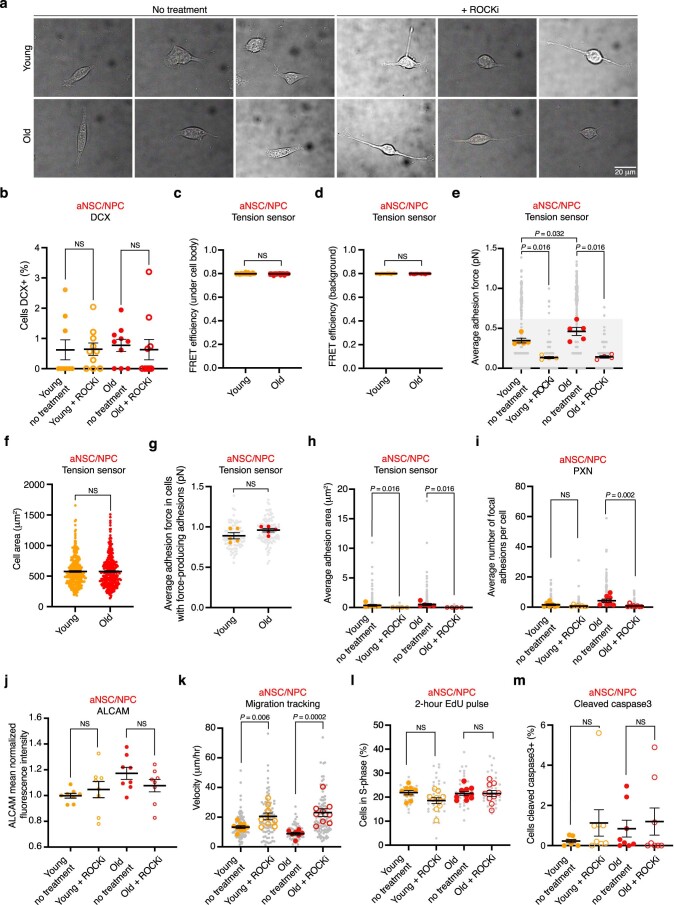
The regenerative potential of brain stem cell niches deteriorates during aging. Yet the mechanisms underlying this decline are largely unknown. Here we characterize genome-wide chromatin accessibility of neurogenic niche cells in vivo during aging. Interestingly, chromatin accessibility at adhesion and migration genes decreases with age in quiescent neural stem cells (NSCs) but increases with age in activated (proliferative) NSCs. Quiescent and activated NSCs exhibit opposing adhesion behaviors during aging: quiescent NSCs become less adhesive, whereas activated NSCs become more adhesive. Old activated NSCs also show decreased migration in vitro and diminished mobilization out of the niche for neurogenesis in vivo. Using tension sensors, we find that aging increases force-producing adhesions in activated NSCs. Inhibiting the cytoskeletal-regulating kinase ROCK reduces these adhesions, restores migration in old activated NSCs in vitro, and boosts neurogenesis in vivo. These results have implications for restoring the migratory potential of NSCs and for improving neurogenesis in the aged brain.


Conflict of interest statement

The authors declare no competing interests.

Figures

Fig. 1
Fig. 1. Chromatin profiling of five cell types freshly isolated from the SVZ neurogenic niche reveals opposing changes with age in quiescent and activated NSCs involving cell adhesion and migration pathways.
a, Design for freshly isolating five cell types from the SVZ using FACS. Created with BioRender.com. b, PCA on all genome-wide chromatin peaks from SVZ niche cell types isolated from young (triangle) and old (circle) GFAP-GFP mice. Each dot represents a single ATAC-seq library. c, Genome browser (IGV) view of chromatin accessibility signal tracks from representative RPKM-normalized libraries of all SVZ niche cell types around the Ascl1 locus. Black arrows represent sites of differentially accessible peaks that open in young aNSCs when compared to young qNSCs. Scale bar, 1 kb. d, PCA on all chromatin peaks from young and old qNSCs and aNSCs. Each dot represents a single ATAC-seq library. e, PCA on chromatin peaks that overlap with marks of enhancers (H3K27ac and p300 binding) from young and old qNSCs and aNSCs. Each dot represents a single ATAC-seq library. b,d,e, PCA generated using variance stabilizing transformation (VST)-normalized read counts. f, Chromosome-level visualization of differentially accessible ATAC-seq peaks (FDR < 0.05) that change with age in qNSC and aNSC. Each vertical bar represents a dynamic ATAC-seq peak aligned to mouse chromosomes (mouse genome mm10) that is differentially open in young or old NSCs. g,h, Selected GO terms for genes associated with differentially accessible ATAC-seq peaks (FDR < 0.05) that change with age in quiescent (g) and activated (h) NSCs generated by EnrichR and ranked by P value (two-sided Fisher’s exact test). ATAC-seq peaks annotated with their nearest gene using ChIPSeeker. Red boxes indicate GO terms associated with adhesion and migration. i,j, Heat maps showing accessibility levels of differential ATAC-seq peaks associated with the ‘cell adhesion’ GO category (i) and ‘negative regulation of cell migration’ GO category (j) that change with age in qNSCs and aNSCs. Selected gene names with associated differentially accessible peaks are displayed. In i, genes names are colored according to AmiGO as cell–matrix adhesion genes (purple), cell–cell adhesion genes (green) or both (black). TMM-normalized read counts (by EdgeR), scaled row-wise. Source data
Fig. 2
Fig. 2. Opposing chromatin changes in quiescent and activated NSCs during aging are associated with gene expression changes.
a,b, Violin plots of cumulative expression profiles of genes within the ‘cell adhesion’ (a) and ‘negative regulation of cell migration’ (b) GO categories for young and old qNSCs/astrocytes and aNSCs/NPCs from single-cell RNA-seq data. Each dot represents the cumulative expression of genes within the GO category in a single cell. c, Violin plots of select cell adhesion gene expression profiles for young and old qNSCs/astrocytes and aNSCs/NPCs from single-cell RNA-seq data. d, Box plots of TMM-normalized chromatin accessibility changes in differentially accessible peaks near cell adhesion genes from c for young and old qNSCs and aNSCs. Box plot displays the median and lower and upper quartile values. Minimum and maximum values within 1.5 times the interquartile range (whiskers) are indicated. n = 6 young male and n = 6 young female GFAP-GFP mice, and n = 9 old male and n = 9 old female GFAP-GFP mice (pairs of male and female mice were pooled). c,d, Genes above the dashed line are examples of genes that are shared between qNSCs/astrocytes and aNSCs/NPCs and genes below the dashed line are examples of genes that are not shared. e, Design for primary cultures of qNSCs and aNSCs/NPCs. Created with BioRender.com. f,g, Selected GO terms for genes associated with differentially accessible ATAC-seq peaks (FDR < 0.05) that change with age in primary cultures of qNSCs (f) and aNSCs/NPCs (g) generated by EnrichR and ranked by P value (two-sided Fisher’s exact test). Red boxes indicate GO terms associated with cell adhesion and migration. h, Representative images of immunofluorescence staining for ALCAM in young and old qNSCs and aNSCs/NPCs. Purple, ALCAM. Blue, DAPI. Scale bar, 20 μm. i,j, Quantification of ALCAM mean normalized fluorescence intensity of young and old qNSCs (i) and aNSCs/NPCs (j). Each dot represents the mean fluorescence intensity of 30 fields (each containing 1–3 cells) in a primary culture derived from an individual mouse, normalized by experiment and cell size. NS, not significant. hj, n = 8 young and n = 8 old male mice. k, Representative images of immunofluorescence staining for PXN of young and old qNSCs and aNSCs/NPCs. Green, PXN. Blue, DAPI. Arrow indicates localization of PXN to peripheral focal adhesions. Scale bar, 20 μm. l,m, Quantification of PXN immunostaining of young and old qNSCs (l) and aNSCs/NPCs (m). Each dot represents the average number of focal adhesions per cell (28–32 cells per dot) in a primary culture derived from an individual mouse. In km, n = 8 young and n = 8 old male mice (qNSCs), n = 10 young and n = 11 old male mice (aNSCs/NPCs). In i, j, l and m, data are the mean ± s.e.m. Data were combined over three (d, j and m) or two (i and l) independent experiments. All statistical comparisons were made using a two-tailed Mann–Whitney test unless otherwise stated. Source data
Fig. 3
Fig. 3. Opposing chromatin changes in quiescent and activated neural stem cells during aging are associated with functional defects in cell adhesion and migration.
a, Representative images of live young and old aNSCs/NPCs stained with Syto64 taken before and Accutase treatment. Scale bar, 800 μm. b, Percentage of cells remaining of young and old qNSCs after trypsin treatment. Each dot represents the average percentage of cells remaining after trypsin treatment of 2–4 technical replicates per primary culture derived from an individual mouse. n = 8 young and n = 8 old male mice. c, Percentage of cells remaining of young and old aNSCs/NPCs after Accutase treatment. Each dot represents the average percentage of cells remaining after Accutase treatment of 2–4 technical replicates per primary culture derived from an individual mouse. a,c, n = 11 young and n = 11 old male mice. d, Representative images of the migration path of a young aNSC or NPC. Color bar represents the passage of time from 0 h (blue) to 20 h (red). Scale bars, 50 μm. e, Migration speed of young and old qNSCs. n = 6 young and n = 4 old male mice. f, Migration speed of young and old aNSCs/NPCs. e,f, Each dot represents the average velocity over a 20-h period of 5–42 cells in a primary culture derived from an individual mouse. d,f, n = 9 young and n = 7 old male mice. g, Representative images of young and old aNSC/NPC dispersion through Matrigel. The outer dashed line represents the outermost extent of invasion and the inner dashed line represents the initial extent of the cells after plating (t = 0 h). Scale bar, 800 μm. h, Migration distance of young and old aNSC/NPC dispersion through Matrigel over 48 h. At each time point, distance was averaged over 1–4 technical replicates from a primary culture derived from an individual mouse. g,h, n = 7 young and n = 10 old male mice. All data are the mean ± s.e.m. Data were combined over six (a and c), two (b, e, g and h) or three (d and f) independent experiments. All statistical comparisons were made using a two-tailed Mann–Whitney. Source data
Fig. 4
Fig. 4. Age-dependent location defects of quiescent and activated neural stem cells and progeny in vivo.
a, Design of immunofluorescence experiments for quantifying the location of qNSCs/astrocytes and aNSCs in vivo in coronal brain sections. b, Schematic depicting how distance of cells to the ventricle were quantified. c, Representative images of immunofluorescence staining of coronal SVZ sections from young and old GFAP-GFP mice. The yellow box denotes the inset containing a qNSC/niche astrocyte (arrow) and an aNSC (arrowhead). The ventricular lining is indicated by a dashed white line (see Extended Data Fig. 9a for demarcation of ventricle wall with vinculin). Green, GFAP (astrocyte/NSC); pink, Ki67 (proliferation); blue, DAPI. Scale bar, 50 μm. d, NSC distance to the ventricle for qNSCs and niche astrocytes (Ast) and aNSCs in serial coronal sections (left) of young and old SVZs from mixed-sex GFAP-GFP mice and sagittal sections (right) of young and old SVZs from male C57BL/6 mice. Each dot represents the mean distance from the ventricle per mouse. Serial coronal sections: n = 4 young and n = 4 old mixed-sex GFAP-GFP mice, combined over four independent experiments. Sagittal sections: n = 5 young and n = 5 old male C57BL/6 mice, combined over two independent experiments. e, Design of immunofluorescence experiments to assess the location of EdU-labeled aNSCs/NPCs and neuroblasts in the SVZ neurogenic niche in vivo. i.p., intraperitoneal. f, Representative images of immunofluorescence staining of sagittal SVZ sections of young and old male C57BL/6 mice 4 h after EdU injection. Green, EdU; pink, Ki67 (aNSC/NPC/neuroblast); red, DCX (neuroblast); blue, DAPI. The dashed white line indicates the ventricle wall and arrows indicate EdU+ cells. Scale bar, 50 μm. g,h, Distance to the ventricle for EdU+ aNSCs/NPCs (g) and EdU+ neuroblasts (h) in sagittal sections of young and old SVZs 4 h after EdU injection. Each dot represents the mean distance from the ventricle per mouse. fh, n = 5 young and n = 5 old male mice, combined over two experiments. All data are the mean ± s.e.m. All statistical comparisons were made using a two-tailed Mann–Whitney test. Figures in a, b and e were created with BioRender.com. Source data
Fig. 5
Fig. 5. Age-dependent location defects of quiescent and activated neural stem cells and progeny in vivo in the niche, rostral migratory stream and olfactory bulb.
a, Design of immunofluorescence experiments to assess EdU-labeled NSC localization along migratory path in vivo. Created with BioRender.com. b, Representative immunofluorescence staining of a sagittal section from a young male C57BL/6 mouse 4 h after EdU injection. Green, EdU; pink, DCX (neuroblast); red, Ki67 (aNSC/NPC/neuroblast); blue, DAPI. Scale bar, 500 μm. c, Representative images of immunofluorescence staining in sagittal sections of the OB from a young or old male C57BL/6 mouse 4 h or 7 d after EdU injection. n = 5 young and n = 5 old male mice 4 h after injection, n = 4 young and n = 4 old male mice 7 d after injection. Green, EdU; blue, DAPI. Scale bar, 50 μm. df, Quantification of EdU+ cells from young sagittal sections 4 h, 2 d and 7 d after EdU injection. Each dot represents the total number of EdU+ cells counted in the SVZ (along the entire length of the ventricle (d), the entire RMS (e) and the entire OB (f) of one sagittal section from an individual mouse. n = 5 young male mice 4 h after injection, n = 3 young male mice 2 d after injection, and n = 4 young male mice 7 d after injection. gi, Quantification of EdU+ cells from old sagittal sections 4 h, 2 d and 7 d after EdU injection. Each dot represents the total number of EdU+ cells counted in the SVZ along the entire length of the ventricle (g), the entire RMS (h) and the entire OB (i) in one sagittal section from an individual mouse. n = 5 old male mice 4 h after injection, n = 3 old male mice 2 d after injection, and n = 4 old male mice 7 d after injection. In bi, data were combined over two independent experiments. All data are the mean ± s.e.m. All statistical comparisons were made using a two-tailed Mann–Whitney test. Source data
Fig. 6
Fig. 6. Molecular tension sensors reveal an increase in force-producing adhesions in old activated neural stem cells/neural progenitor cells that can be eliminated by ROCK inhibition.
a, Diagram of RGD molecular tension sensor. b, Representative images of young and old cultured aNSCs/NPCs taken with brightfield (top) and traction map of FRET efficiency (bottom). Colored bar represents FRET efficiency where low FRET efficiency indicates high force (red) and high FRET efficiency indicates low force (blue). Scale bar, 5 μm. c, Top ten canonical pathways enriched for genes associated with differentially accessible peaks that open with age in aNSCs (FDR < 0.05) generated by IPA and ranked by P value (one-sided Fisher’s exact test). ATAC-seq peaks annotated with their nearest gene using ChIPSeeker. d, Gα12/13 signaling pathway (adapted from IPA diagram and previous work). e, Average adhesion force (pN) exhibited by young and old cultured aNSCs/NPCs treated with H2O vehicle (solid circles) or 10 μM ROCKi (open circles). Each dot represents the average force produced by one cell (15–89 cells per dot) in a primary culture derived from an individual mouse. f, Proportion (colored bars) of young and old cultured aNSCs/NPCs exhibiting force-producing adhesion patterns when treated with H2O (solid bars), or ROCKi (open bars). Same experiment as in e. P values were calculated using a two-sided Fisher’s exact test. g, Average adhesion area of force-producing adhesions of young and old cultured aNSCs/NPCs treated with H2O vehicle (solid circles) or 10 μM ROCKi (open circles). Each dot represents the average adhesion area of force-producing adhesions from a single cell (15–89 cells per dot) in a primary culture derived from an individual mouse. Same experiment as in e. b,e,f,g, n = 5 young male mice and n = 5 old male mice (no treatment), and n = 4 young male mice and n = 4 old male mice (ROCKi), combined over three independent experiments. h, Representative immunofluorescence staining of old cultured aNSCs/NPCs treated with H2O vehicle (no treatment) or 10 μM ROCKi. Green, PXN (focal adhesions). Blue, DAPI. Arrows indicate PXN localization to focal adhesions. Scale bar, 20 μm. i, Average number of focal adhesions (marked by PXN) exhibited by young and old cultured aNSCs/NPCs treated with H2O vehicle (solid circles) or 10 μM ROCKi (open circles). Each dot represents the average number of focal adhesions per cell from a primary culture (30 cells per dot) derived from an individual mouse. j, Proportion (colored bars) of young and old cultured aNSCs/NPCs exhibiting focal adhesions (marked by PXN) when treated with H2O vehicle (solid bars) or 10 μM ROCKi (open bars) exhibiting focal adhesions. Same experiment as in i. P values calculated using a two-sided Fisher’s exact test. hj, n = 7 young and n = 8 old male mice (no treatment), and n = 8 young and n = 8 old male mice (ROCKi treatment), combined over two independent experiments. In e, g and i, data are the mean ± s.e.m. All statistical comparisons were made using a two-tailed Mann–Whitney test unless otherwise stated. Figures in a and d were created with BioRender.com. Source data
Fig. 7
Fig. 7. ROCK inhibition boosts migration speed in activated neural stem cells/neural progenitor cells cultured from aged brains.
a, Representative images of old cultured aNSCs/NPCs 12 h after plating onto migration plates treated with H2O vehicle (no treatment) or 10 μM ROCKi. Inset displays a representative magnified cell. Scale bars, 50 μm. b, Migration speed of young and old aNSCs/NPCs treated with H2O vehicle (solid circles) or with 10 μM ROCKi (open circles). Each dot represents average velocity over a 20-h period of cultured cells (2–28) derived from one individual mouse. a,b, n = 9 young and n = 7 old male mice (no treatment), and n = 9 young and n = 9 old male mice (ROCKi treatment), combined over three independent experiments. Data are the mean ± s.e.m. c, Cell dispersion through Matrigel after 48 h by young and old aNSCs/NPCs treated with H2O vehicle (solid bars) or 10 μM ROCKi (open bars). Each dot represents the average dispersion distance through Matrigel after 48 h of cultured aNSCs/NPCs derived from an individual mouse. n = 6 young and n = 6 old male mice for treated and untreated conditions, combined over two independent experiments. For each biological replicate, 1–4 technical replicates were evaluated, and dispersion distance was averaged. Box plots display the median and lower and upper quartile values. Whiskers indicate the minimum and maximum within 1.5 times the interquartile range. All statistical comparisons were made using a two-tailed Mann–Whitney test. Source data
Fig. 8
Fig. 8. ROCK inhibition improves in vivo neurogenesis in old mice.
a, Design of in vivo ROCKi immunofluorescence experiments to assess EdU-labeled NSC localization along migration path. Created with BioRender.com. b, Representative images of immunofluorescence staining in sagittal sections of the SVZ of old vehicle control (no treatment) and ROCKi-treated mice after 14 d of treatment. The dashed line represents the ventricle border. Arrowheads indicate aNSCs/NPCs. Red, Ki67 (proliferation); blue, DAPI. Scale bar, 20 μm. c,d, Sagittal distance to the ventricle for aNSCs/NPCs in old SVZs treated with vehicle control (solid circles) or ROCKi (open circles) for 7 d (4 h after EdU injection; c) and 14 d (7 d after EdU injection; d). Each dot represents the mean distance from the ventricle per mouse. For c, n = 4 old (no treatment) and n = 7 old male mice (ROCKi); for d, n = 5 old (no treatment) and n = 6 old male mice (ROCKi). e, Representative images of immunofluorescence staining of the old OB treated with vehicle control or ROCKi 4 h or 7 d after EdU injection. Arrows indicate EdU+ cells. Green, EdU; blue, DAPI. Scale bar, 50 μm. fh, Quantification of EdU+ cells in the SVZ (f), RMS (g) and OB (h) from sagittal sections 4 h and 7 d after EdU injection in old mice treated with vehicle control (no treatment, solid circles) or ROCKi (open circles). Each dot represents the number of EdU+ cells counted in one sagittal section from a single mouse. For the 4-h time point, n = 4 (SVZ, no treatment), n = 6 (RMS and OB, no treatment), n = 7 (SVZ, ROCKi) and n = 8 (RMS and OB, ROCKi) old male mice. For the 7-d time point, n = 5 (SVZ, no treatment), n = 7 (RMS and OB, no treatment), n = 7 (SVZ, ROCKi) and n = 8 (RMS and OB, ROCKi) old male mice. i, Representative immunofluorescence images of old OB 7 d after EdU injection. EdU+ cells in the OB are DCX+ (top) or NeuN+ (bottom). n = 8 old male mice. Green, EdU; red, DCX (neuroblast/immature neuron); pink, NeuN (neuron); blue, DAPI. Scale bar, 20 μm. All data are the mean ± s.e.m. In bi, data were combined over two independent experiments. All statistical comparisons were made using a two-tailed Mann–Whitney test. Source data
Extended Data Fig. 1
Extended Data Fig. 1. Quality control metrics for FACS and in vivo ATAC-seq libraries.
a, FACS gating scheme used to isolate 5 cell populations from the SVZ of young and old GFAP-GFP mice. Negative controls (fluorescence minus one (FMO) controls) for each stain are indicated. Negative controls (FMO controls) were stained with all antibodies other than the one(s) for which it was the negative control. b-d Changes in FACS markers with age for all sorted live cells (b), sorted live qNSCs (c), and sorted live aNSCs (d). Normalized scaled fluorescence intensity of indicated FACS markers (EGFR, GFAP, and PROM1) of young and old sorted cells used for generating ATAC-seq libraries from freshly isolated cells from the SVZ neurogenic niche. n = 8 young male and female GFAP-GFP mice and n = 11 old male and female GFAP-GFP mice, combined over 2 independent experiments. Data normalized to young mean of each individual experiment. Boxplots display median, and lower and upper quartiles. Minimum and maximum within 1.5× the interquartile range (whiskers) indicated. Dots outside whiskers represent outliers. Dots represent mean fluorescence intensity for an individual animal, normalized to mean of experiment. P-values calculated using a two-tailed Mann-Whitney test. The change in marker expression in all live cells in (b) likely reflects changes in cell type composition that occur with age. e, Insert size distribution histograms of all paired-end reads from a single representative ATAC-seq library for each of the 5 cell types freshly isolated from the SVZ of both young and old animals. f, Heatmap of ATAC-seq enrichment at genome-wide transcription start sites (TSSs) ± 2000 base pairs for all 5 cell types in both young and old conditions. Data from independent experiments are in Source Data. Ages of animals used provided in Source Data. Source data
Extended Data Fig. 2
Extended Data Fig. 2. Chromatin accessibility clustering and correlation with gene expression.
a, Hierarchical clustering using Pearson’s correlation of raw chromatin accessibility libraries (un-normalized) of all 5 cell types freshly isolated from the SVZ of young and old animals. Biological replicates are noted as numbers following age and cell type. b, mRNA expression of Ascl1 in all 5 SVZ cell types in young and old conditions from published bulk RNA-seq dataset (see Methods). Each dot represents the VST-normalized mRNA expression value from a single RNA-seq library. For endothelial cells, astrocytes, and NPCs 4 libraries were made per condition using n = 8 young male and n = 8 young female GFAP-GFP mice (pairs of male and female mice were pooled), and n = 8 old male and n = 8 old female GFAP-GFP (pairs of male and female mice were pooled). For qNSCs and aNSCs, 3 libraries were made per condition using n = 6 young male and n = 6 young female GFAP-GFP mice (pairs of male and female mice were pooled), and n = 6 old male and n = 6 old female GFAP-GFP (pairs of male and female mice were pooled), mice except for the young qNSC condition which consisted of 2 libraries. Data are mean ± SEM. c, Decile plot of correlation between promoter accessibility levels (from ATAC-seq data) and mean gene expression values (from single cell RNA-seq data, see Methods). Promoters were binned into deciles based on accessibility level and boxplots were generated to correlate promoter bins with average gene expression for young and old endothelial cells, astrocytes, qNSCs, aNSCs, and NPCs. Each dot represents the gene expression level of an individual promoter binned based on chromatin accessibility signal. Y-axis constrained between 0 and 1 to facilitate boxplot visualization. Boxplot indicates median, and lower and upper quartiles. Minimum and maximum within 1.5× the interquartile range (whiskers) indicated. Dots outside whiskers represent outliers. n = 6 young male and n = 6 female GFAP-GFP mice (pairs of male and female mice were pooled), and n = 9 old male and n = 9 old female GFAP-GFP mice (pairs of male and female mice were pooled), combined over 3 independent experiments.
Extended Data Fig. 3
Extended Data Fig. 3. Chromatin accessibility in quiescent and activated NSCs during aging.
a, PCA on genome-wide chromatin peaks defining qNSCs and aNSCs freshly isolated from the young and old SVZ where each dot represents a single ATAC-seq library (PC1 vs. PC3). PCA was generated using the variance stabilizing transformation (VST)-normalized NSC consensus count matrix. b, Barplot denoting the number of differentially accessible peaks that change with age (open and close) in freshly isolated endothelial cells, astrocytes, quiescent NSCs, activated NSCs, and neural progenitor cells. c, Stacked barchart representing the genomic distribution of open chromatin peaks for qNSCs and aNSCs in young and old conditions based on their pooled peaksets. ATAC-seq peaks were annotated with ChIPSeeker. Grey box indicates distal and intronic peaks that likely contain putative enhancers. d-g, PCA on distal and intronic chromatin peaks (d), exclusively distal I, exclusively intronic (f), and exclusively promoter (g) chromatin peaks for qNSCs and aNSCs freshly isolated from the SVZ of young and old mice where each dot represents a single ATAC-seq library (PC1 vs. PC3). PCA was generated using the variance stabilizing transformation (VST)-normalized NSC consensus count matrix. h, Frequency of differentially accessible ATAC-seq peaks that change with age in qNSCs and aNSCs associated with distal regions, introns, promoters, exons, 5’ UTRs, 3’ UTRs, and downstream regions. ATAC-seq peaks were annotated with ChIPSeeker. Box denotes differentially accessible distal and intronic peaks that likely contain putative enhancers. I, Raw signal pileup plots illustrating chromatin accessibility signal of quiescent and activated NSC chromatin peaks separated based on whether they are common to qNSCs and aNSCs (top row), open in young (middle row), or open in old (bottom) bottom as determined by the differential peak caller EdgeR. j, Barplot denoting the number of genome-wide chromatin peaks (non-differential) in freshly isolated young and old qNSCs and aNSCs. k, Number of nucleosome peaks called by NucleoATAC for freshly isolated young and old qNSC and aNSC chromatin landscapes. Nucleosome peaks were called using pooled, sub-sampled (to 30 million unique reads) ATAC-seq reads for each condition. l,m, Scatterplot illustrating correlation between significance levels of alternative differential peak calling methods: EdgeR FDR values vs DESeq2 P-values for peaks that are differentially open in young quiescent NSCs (called by EdgeR) (l) and open in old activated NSCs (m). Shaded region indicates 95% confidence interval. Regression and P-values were respectively calculated using geom_smooth() and state_cor() (two-tailed t-test) in R.
Extended Data Fig. 4
Extended Data Fig. 4. Chromatin accessibility analysis in 5 different cell types.
a, Top 6 GO terms associated with the top 1000 ATAC-seq peak-associated genes driving PC2 in the positive (young qNSCs and old aNSCs) and negative (old qNSCs and young aNSCs) direction. Red boxes indicate GO terms associated with cell adhesion. P-values determined using a two-sided Fisher’s exact test. b, Venn diagram illustrating overlap between genes in ‘Cell Adhesion’ GO category (GO:0007155) with nearby chromatin peaks that are differentially open in young qNSCs (compared to old) and old aNSCs (compared to young). Box in overlap indicates select shared cell adhesion genes. c-e, Selected GO terms associated with differentially accessible ATAC-seq peaks (FDR < 0.05) that change with age in freshly isolated astrocytes (c), endothelial cells (d), and neural progenitor cells (NPCs) (e) generated by EnrichR and ranked by P-value (two-sided Fisher’s exact test). ATAC-seq peaks annotated with their nearest gene using ChIPSeeker. Red boxes indicate GO terms associated with adhesion and migration. f, Venn diagram illustrating overlap between genes in ‘Cell Adhesion’ GO category (GO:0007155) genes with nearby chromatin peaks that are differentially open in old aNSCs and old NPCs. Box in overlap indicates select shared cell adhesion genes.
Extended Data Fig. 5
Extended Data Fig. 5. Gene expression of cell adhesion and migration pathways in NSC lineage during aging by single cell RNA-seq.
a-e, Violin plots of the distribution of single cell cumulative expression profiles of genes within the ‘Cell-matrix adhesion’ GO category (GO:0007160) (a), ‘Adherens junction organization’ GO category (GO:0034332) (b), ‘Response to forskolin’ GO Category (GO:1904322) (c), ‘Cell-cell adhesion mediated by cadherin’ GO Category (GO:0044331) (d), and ‘Cell-cell adhesion (plasma membrane)’ GO Category (GO:0098742) I for young and old qNSCs/Astrocytes (left) and aNSCs/NPCs (right) from single cell RNA-seq data (see Methods). Each overlaid dot represents the cumulative expression of genes within the GO category in a single cell. f-j, Violin plots of the distribution of single cell cumulative expression profiles of genes within the ‘Cell adhesion’ GO Category (GO:0007155) restricted to cadherins (f), ‘Homophilic cell-cell adhesion (plasma membrane)’ GO Category (GO:0007156) (g), ‘Olfactory bulb interneuron differentiation’ GO Category (GO:0021889) (h), ‘cAMP mediated signaling’ GO Category (GO:0019933) (i), and ‘Positive regulation neuron migration’ GO Category (GO:2001224) (j) for young and old qNSC/Astrocyte (left), aNSC/NPC (middle), and neuroblasts (right) from single cell RNA-seq data (see Methods). Each overlaid dot represents the cumulative expression of genes within the GO category in a single cell. k, Gene expression trajectories as a function of age of select cell adhesion genes (Alcam, Ctnnd2, Itgb8) in qNSCs/Astrocytes from single cell RNA-seq dataset (see Methods). Shaded region represents 95% confidence interval. l, Gene expression trajectories as a function of age of select cell adhesion genes (Alcam, Lsamp, Ntm) in aNSCs/NPCs from single cell RNA-seq dataset (see Methods). Shaded region represents 95% confidence interval. All statistical comparisons made using a two-tailed Mann-Whitney test.
Extended Data Fig. 6
Extended Data Fig. 6. Analysis of cell cycle and cell migration signatures in NSCs during aging by single cell RNA-seq.
a, Single cell RNA-seq data was used to assess cell cycle gene expression and Cell Adhesion (GO:0007155) pathway expression for young and old qNSCs/astrocytes, aNSCs/NPCs, and neuroblasts (see Methods). Created with BioRender.com. b, Barplots illustrating the proportion of young and old qNSCs/astrocytes, aNSCs/NPCs, and neuroblasts in the GO/G1, G2/M, or S phase of the cell cycle based on gene expression signatures from single cell RNA-seq data (see Methods). c, Scatterplot of qNSCs/astrocytes, aNSCs/NPCs, and neuroblasts from young (top) and old (bottom) single cell RNA-seq data (see Methods) illustrating the relationship between Seurat’s ‘S phase score’ and the cumulative single cell expression levels of the genes in the ‘Cell Adhesion’ GO category (GO:0007155). Young cells were downsampled to visualize the same number of young and old cells per cell type (480 qNSCs/astrocytes, 82 aNSCs/NPCs, and 146 neuroblasts).
Extended Data Fig. 7
Extended Data Fig. 7. Primary cultures of qNSCs and aNSCs/NPCs for ATAC-seq, immunostaining, and adhesion and migration assays.
a, Experimental design for the generation of ATAC-seq libraries from quiescent and activated NSCs cultured from young and old mixed-sex C57BL/6 mice. Created with BioRender.com. b, PCA on chromatin peaks defining cultured and in vivo qNSC and aNSC landscapes where each dot represents a single ATAC-seq library (PC1 vs. PC2). PCA was generated using the variance stabilizing transformation (VST)-normalized global consensus count matrix of all cultured and in vivo NSC peaks. c, Genome browser (IGV) view of chromatin accessibility signal tracks on chromosome 10 of freshly isolated and cultured qNSC and aNSC from the young and old SVZ. Adat3, Adenosine Deaminase TRNA Specific 3. Mknk2, MAPK Interacting Serine/Threonine Kinase 2. Ap3d1, Adaptor Related Protein Complex 3 Subunit Delta 1. Plekhj1, Pleckstrin Homology Domain Containing J1. Lsm7, LSM7 Homology U6 Small Nuclear RNA and mRNA Degradation Associated. Scale bar, 50 kb. d, PCA on chromatin peaks defining qNSC and aNSC/NPC cultured from young and old SVZs where each dot represents a single ATAC-seq library (PC1 vs. PC4). PCA was generated using the variance stabilizing transformation (VST)-normalized global consensus count matrix. e, Representative immunofluorescent images of young and old qNSC and aNSC/NPC highlighting heterogeneity in cell size and shape. Green, phalloidin (F-actin). Blue, DAPI. Scale bar, 20 μm. f, g, ALCAM fluorescence intensity of young and old qNSC (f) and aNSC/NPC (g). Each grey dot represents mean normalized fluorescent intensity per cell. Each colored dot represents mean normalized fluorescence intensity of 30 fields (each containing 1-3 cells) in a primary culture derived from an individual mouse, normalized by experiment and cell size. n = 8 young male mice, and n = 8 old male mice, combined over 2 (qNSC) or 3 (aNSC/NPC) independent experiments. h,I, Normalized fluorescence intensity of ALCAM, as assessed by FACS, in young and old qNSCs (h) and aNSCs/NPCs (i). Each colored dot represents mean normalized fluorescence intensity of ~10,000 live cells from an individual mouse, normalized by experiment. n = 10 young male mice, and n = 10 old male mice (qNSCs), n = 8 young male mice, and n = 8 old male mice (aNSCs/NPCs), combined over 2 independent experiments. j,k, Quantification of paxillin (PXN) immunostaining of young and old qNSCs (j) and aNSCs/NPCs (k). Each grey dot represents number of focal adhesions per cell. Each colored dot represents average number of focal adhesions per cell (28-32 cells per dot) in a primary culture derived from an individual mouse. n = 8 young male mice, and n = 8 old male mice (qNSCs), n = 10 young male mice, and n = 11 old male mice (aNSCs/NPCs), combined over 2 (qNSCs) or 3 (aNSCs/NPCs) independent experiments. l,m, Quantification of subpopulation of cells with at least one active focal adhesion as assessed with paxillin (PXN) immunostaining of young and old qNSCs (l) and aNSCs/NPCs (m). Each grey dot represents number of focal adhesions per cell. Each colored dot represents average number of focal adhesions per cell of cells that have at least once focal adhesion (4-23 cells per dot) from an individual mouse. n = 8 young male mice, and n = 8 old male mice (qNSCs), n = 10 young male mice and n = 11 old male mice (aNSCs/NPCs), combined over 2 (qNSCs) or 3 (aNSCs/NPCs) independent experiments. Same experiment as in (j) and (k). n, Quantification of percent cells remaining of young and old qNSCs and young and old aNSCs/NPCs after a 5 minute incubation with Accutase and PBS wash. Each dot represents average percent cells remaining after Accutase treatment of 2-4 technical replicates (wells) per primary culture derived from an individual mouse. n = 4 young male mice and n = 4 old male mice (qNSCs), n = 11 young male mice and n = 11 old male mice (aNSCs/NPCs) from one independent experiment (qNSCs) or combined over 6 independent experiments (aNSCs/NPCs). Note that the aNSC/NPC data are the same as in Fig. 3c. o, Force-based assay to assess aNSC/NPC adhesion. Quantification of percent area remaining of young and old aNSCs/NPCs after cells were detached by centrifugal force (300 g for 4 minutes). Each dot represents average percent area remaining after centrifugation of 2-3 technical replicates (wells) per primary culture derived from an individual mouse. n = 10 young male mice, and n = 10 old male mice, combined over 2 independent experiments. p, Migration speed of young and old qNSCs. Each grey dot represents the average velocity of a single cell over a 20-hour period. Each dot represents the average velocity over a 20-hour period of 5-42 cells in a primary culture derived from an individual mouse. n = 6 young male mice and n = 4 old male mice, combined over 2 independent experiments. q, Migration speed of young old aNSCs/NPCs. Each grey dot represents the average velocity of a single cell over a 20-hour period. Each colored dot represents the average velocity per mouse over a 20-hour period of 6-28 cells. n = 9 young male mice and n = 7 old male mice, combined over 3 independent experiments. r, Percent cells that are EdU-positive (S-phase) after a 2-hour pulse for young and old aNSCs/NPCs. Each grey dot represents percent of cells in given field that are EdU-positive. Each colored dot represents average percent cells EdU-positive for an individual mouse (average of 5-7 fields containing at least 100 cells each). n = 9 young male mice, and n = 10 old male mice, combined over 3 independent experiments. All data are mean ± SEM. All statistical comparisons made using a two-tailed Mann-Whitney test comparing sample means. Data from independent experiments are in Source Data. Ages of animals used provided in Source Data. Source data
Extended Data Fig. 8
Extended Data Fig. 8. NFI family of transcription factors during aging in activated NSCs.
a, Distribution of transcription factor binding sites in accessible chromatin regions from freshly isolated young and old aNSCs and qNSCs identified using a deep learning model (see Methods). b, NFI family transcription factor binding site motifs for each NFI isoform from HOMER. c, Experimental design for knocking out NFIC in primary cultures of young and old aNSCs/NPCs. Created with BioRender.com. d, Guide sequences used for safe targeting control guide which targets a safe harbor locus (gene that can be modified or disrupted with CRISPR-Cas9 without any adverse effect on the cell) and NFIC targeting guide from Bassik Lab mouse CRISPR Knockout library (see Methods) as well as Synthego ICE knockout score range achieved with each guide. With this tool, a score of 60 indicates 60% of the population sequenced has a frameshift mutation or deletion greater than 21 base pairs. e, Sample traces for safe targeting control guide and NFIC targeting guide from Synthego ICE analysis tool indicating indel distribution and cut site. f, Detachment assay upon NFIC knockout in young and old aNSC/NPC using NFIC targeting guide. Quantification of percent of aNSCs/NPCs remaining after 3 minute Accutase incubation and PBS wash. Each data point is average of 2-3 technical replicates (wells) per primary culture derived from an individual mouse. Safe targeting control guide samples (solid dot) were normalized to average of all young safe targeting control samples. NFIC targeting guide samples (open triangle) were normalized to average of all young NFIC targeting guide samples. P-values calculated using a two-sided Wilcoxon Matched-Pairs Signed Ranks Test, since experiments were performed in a paired manner (paired young and old). g, Detachment assay upon NFIC knockout in young and old aNSCs/NPCs using NFIC targeting guide. Same experiment as in (f). Quantification of difference of percent of aNSCs/NPCs remaining (old – young) after 3 minute Accutase incubation and wash with 1x PBS for safe targeting control guide samples (solid dot) and NFIC targeting guide samples (open triangle). P-value was calculated using a two-tailed Mann-Whitney test. f,g, Data are mean ± SEM. n = 11 young male and female mice, and n = 11 old male and female mice, combined over 7 independent experiments. Data from independent experiments are in Source Data. Ages of animals used provided in Source Data. Source data
Extended Data Fig. 9
Extended Data Fig. 9. In vivo location of EdU-labelled cells in the SVZ neurogenic niche.
a, Representative image of vinculin immunofluorescence staining of old coronal section from GFAP-GFP mouse (Fig. 4c) indicating how vinculin (white) was used to demarcate ventricle border. The ventricular lining is indicated by a dotted white line. Green, GFAP (astrocyte/NSC). Pink, Ki67 (proliferation). Blue, DAPI. Scale bar, 50 μm. b, Representative image of S100a6 immunofluorescent staining of old coronal section from GFAP-GFP mouse. White arrows: qNSC (S100a6 + /Ki67- and GFAP + /Ki67-); white arrowheads aNSC (S100a6 + /Ki67+ and GFAP + /Ki67+). Green, GFAP (astrocyte/NSC). Pink, S100a6 (NSC marker in the SVZ neurogenic niche). Red, Ki67 (proliferation). Blue, DAPI. Scale bar, 50 μm. c, NSC distance to the ventricle was calculated for qNSCs (S100a6 + /Ki67-) and aNSCs (S100a6 + /Ki67+) in coronal sections of young and old SVZs. Each dot represents the mean distance from the ventricle of 140–574 cells in 6-11 fields per section (3 sections per dot) for an individual mouse. n = 4 mixed-sex young mice, and n = 4 mixed-sex old mice, combined over 4 independent experiments. d, NSC distance to the ventricle was calculated for qNSCs/astrocytes (GFAP + /Ki67-) and aNSCs (GFAP + /Ki67+) in coronal sections (left) of young and old SVZs from mixed-sex GFAP-GFP mice and sagittal sections (right) of young and old SVZs from male C57BL/6 mice. Each grey dot represents the distance of a single cell from the ventricular lining. Each colored dot represents the mean distance from the ventricle of 19-231 cells in 3-7 fields per section (3 sections for coronal sections or 1 section for sagittal section) per individual mouse. Coronal sections: n = 4 young, and n = 4 old mixed-sex GFAP-GFP mice, combined over 4 independent experiments. Sagittal sections: n = 5 young male mice, and n = 5 old male C57BL/6 mice combined over 2 independent experiments. e, Single cell RNA-seq analysis of 28 C57BL/6 mice ranging in age from 3.3 months to 29 months (see Methods). Out of 21,458 cells, there are 4 cells expressing all markers of ependymal-repairing SVZ astrocytes (S100b, Gfap, CD24a, Ctnnb1) (see Methods). These cells are colored by age (4.7 months, 5.4 months, 16.83 months, and 18.87 months). Ependymal-repairing SVZ astrocytes are absent from qNSC/astrocyte, aNSC/NPC, and neuroblast clusters but are present in ependymal cell cluster. f, Distance to the ventricle was calculated for EdU+ aNSC/NPC (Ki67 + /DCX-) in sagittal sections of young and old SVZs 4 hours after EdU injection. Each grey dot represents the distance of a single aNSC/NPC from the ventricle. Each colored dot represents the mean aNSC/NPC distance from the ventricle of 2-35 cells from 1 section per individual mouse. n = 5 young male mice, and n = 5 old male mice, combined over 2 independent experiments. g, Distance to the ventricle was calculated for EdU+ neuroblasts (DCX+) in sagittal sections of young and old SVZs 4 hours after EdU injection. Each grey dot represents the distance of a single neuroblast from the ventricle. Each colored dot represents the mean neuroblast distance from the ventricle of 3-25 cells from 1 section per individual mouse. n = 5 young male mice, and n = 5 old male mice, combined over 2 independent experiments. h, Quantification of number of EdU+ cells counted in the SVZ (along the entire length of the ventricle) from young and old sagittal sections 4 hours post-injection of EdU. n = 5 young male mice, and n = 5 old male mice, combined over 2 independent experiments. I, Quantification of percent of Ki67+ cells that are EdU+ 4 hours post-injection of EdU in the SVZ (counting cells along the entire length of the ventricle). n = 5 young male mice, and n = 5 old male mice, combined over 2 independent experiments. j, Representative images of immunofluorescence staining of sagittal sections encompassing the SVZ, RMS, and OB regions from a young or old male C57BL/6 mouse 4 hrs or 7 days after intraperitoneal EdU injection. White inset denotes SVZ. Dotted white line indicates ventricle lining. n = 5 old male mice 4 hours post-injection, n = 3 old male mice 2 days post-injection, and n = 4 old male mice 7 days post-injection, combined over 2 independent experiments. Green, EdU (proliferation). Pink, Ki67 (aNSC/NPC/neuroblast); Red, DCX (neuroblast). Scale bar, 500 μm. All data are mean ± SEM. All statistical comparisons made using a two-tailed Mann-Whitney test comparing sample means. Data from independent experiments are in Source Data. Ages of animals used provided in Source Data. Source data
Extended Data Fig. 10
Extended Data Fig. 10. Effect of ROCK inhibitor in vitro.
a, Representative brightfield images of young and old aNSCs/NPCs on RGD molecular tension sensors with H2O vehicle or 10 μM ROCKi. b, Percent cells that are positive for DCX staining in young and old aNSCs/NPCs treated with H2O vehicle (solid dots) or 10 μM ROCKi (open circles). Each dot represents percent cells DCX-positive in a given field (containing 38-349 cells) for an individual animal (4-5 fields per animal). n = 2 young male mice and n = 2 old male mice (no treatment), and n = 2 young male mice and n = 2 old male mice (+ROCKi), combined over 1 experiment. c, FRET efficiency values underneath cell bodies of young and old cultured aNSC/NPC on RGD molecular tension sensors. Same experiment as Fig. 6e. d, Background FRET efficiency values of young and old cultured aNSCs/NPCs on RGD molecular tension sensors. e, Quantification of average adhesion force (pN) exhibited by young and old cultured aNSCs/NPCs treated with H2O vehicle (solid dots) or 10 μM ROCKi (open circles) determined using RGD molecular tension sensors. Each grey dot represents adhesion force produced by one cell. Each colored dot represents the average force produced by one cell (15– 89 cells per dot) in a primary culture derived from an individual mouse. Shading delineates the bimodal populations of cells with strong adhesions (white) or weak or no adhesions (grey). f, Cell areas of young and old cultured aNSCs/NPCs determined using RGD molecular tension sensors. Same experiment as in (e). g, Quantification of average adhesion force (pN) exhibited by young and old cultured aNSCs/NPCs that have at least one force-producing adhesion determined using RGD molecular tension sensors. Same experiment as in (e). Each grey dot represents adhesion force produced by one cell. Each colored dot represents the average force produced by one cell in cells that have at least one force-producing adhesion (8-29 cells per dot) in a primary culture derived from an individual mouse. n = 5 young male mice and n = 5 old male mice, combined over 3 independent experiments. h, Quantification of average adhesion area under force-producing adhesions (μm2) of young and old cultured aNSCs/NPCs treated with H2O vehicle (solid dots) or 10 μM ROCKi (open circles) determined using RGD molecular tension sensors. Each grey dot represents adhesion area of force-producing adhesion from a single cell. Each colored dot represents the average adhesion area of force-producing adhesions from a single cell (15–89 cells per dot) in a primary culture derived from an individual mouse. Same experiment as in (e). c,d,f n = 306 young aNSCs/NPCs, and n = 298 old aNSCs/NPCs, combined over 3 independent experiments. e,h n = 5 young male mice and n = 5 old male mice (no treatment), n = 4 young male mice and n = 4 old male mice (ROCKi treatment), combined over 3 independent experiments. i, Quantification of average number of focal adhesions, determined using paxillin (PXN) staining, exhibited by young and old cultured aNSCs/NPCs treated with H2O vehicle (solid dots) or 10 μM ROCKi (open circles). Each grey dot represents number of focal adhesions per cell. Each colored dot represents the average number of focal adhesions per cell from a primary culture (30 cells per dot) derived from an individual mouse. n = 7 young male mice and n = 8 old male mice (no treatment) and n = 8 young male mice and n = 8 old male mice (ROCKi treatment), combined over 2 independent experiments. j, Quantification of ALCAM fluorescence intensity of young and old aNSCs/NPCs treated with H2O vehicle (solid dots) or 10 μM ROCKi (open circles). Each dot represents mean-normalized fluorescence intensity of 30 fields (each containing 1-3 cells) in a primary culture derived from an individual mouse, normalized by experiment and cell size. n = 8 young male mice and n = 8 old mice (no treatment) and n = 8 young male mice and n = 8 old male mice (ROCKi treatment), combined over 2 independent experiments. k, Quantification of migration speed of young and old aNSC/NPC ± treatment with 10 μM ROCKi. Each grey dot represents average velocity of a single cell over a 20-hour period. Each colored dot represents the average velocity over a 20-hour period of cells (2-28) from one culture derived from one individual mouse. n = 9 young male mice and n = 7 old male mice (solid dots) and n = 9 young male mice and n = 9 old male mice (open circles), combined over 3 independent experiments. l, Percent cells that are EdU-positive (S-phase) after a 2-hour pulse for young and old aNSCs/NPCs treated with H2O vehicle (solid dots) or 10 μM ROCKi (open circles). Each grey dot represents percent of cells in given field that are EdU-positive. Each colored dot represents average percent cells EdU-positive for an individual mouse (average of 5-7 fields containing at least 100 cells each). n = 9 young male mice and n = 10 old male mice (no treatment), and n = 10 young male mice and n = 10 old male mice (ROCKi treatment) combined over 3 independent experiments. m, Percent cells that are positive for cleaved-caspase 3 staining in young and old aNSCs/NPCs treated with H2O vehicle (solid dots) or 10 μM ROCKi (open circles). Each dot represents average percent cells cleaved caspase3-positive for an individual mouse (average of 5 fields containing at least 100 cells). n = 7 young male mice and n = 8 old male mice (no treatment), and n = 8 young male mice and n = 8 old male mice (+ROCKi), combined over 2 independent experiments. All data are mean ± SEM. All statistical comparisons made using a two-tailed Mann-Whitney test comparing sample means unless otherwise stated. Data from independent experiments are in Source Data. Source data

Similar articles

Cited by

References

    1. Bond AM, Ming GL, Song H. Adult mammalian neural stem cells and neurogenesis: five decades later. Cell Stem Cell. 2015;17:385–395. - PMC - PubMed
    1. Navarro Negredo P, Yeo RW, Brunet A. Aging and rejuvenation of neural stem cells and their niches. Cell Stem Cell. 2020;27:202–223. - PMC - PubMed
    1. Gage FH, Temple S. Neural stem cells: generating and regenerating the brain. Neuron. 2013;80:588–601. - PubMed
    1. Silva-Vargas V, Crouch EE, Doetsch F. Adult neural stem cells and their niche: a dynamic duo during homeostasis, regeneration, and aging. Curr. Opin. Neurobiol. 2013;23:935–942. - PubMed
    1. Denoth-Lippuner A, Jessberger S. Formation and integration of new neurons in the adult hippocampus. Nat. Rev. Neurosci. 2021;22:223–236. - PubMed

Publication types