. 2023 Aug;5(8):1382-1394.
doi: 10.1038/s42255-023-00844-5. Epub 2023 Jul 13.

CRAT links cholesterol metabolism to innate immune responses in the heart

Affiliations

CRAT links cholesterol metabolism to innate immune responses in the heart

Hua Mao et al. Nat Metab. 2023 Aug.

Abstract

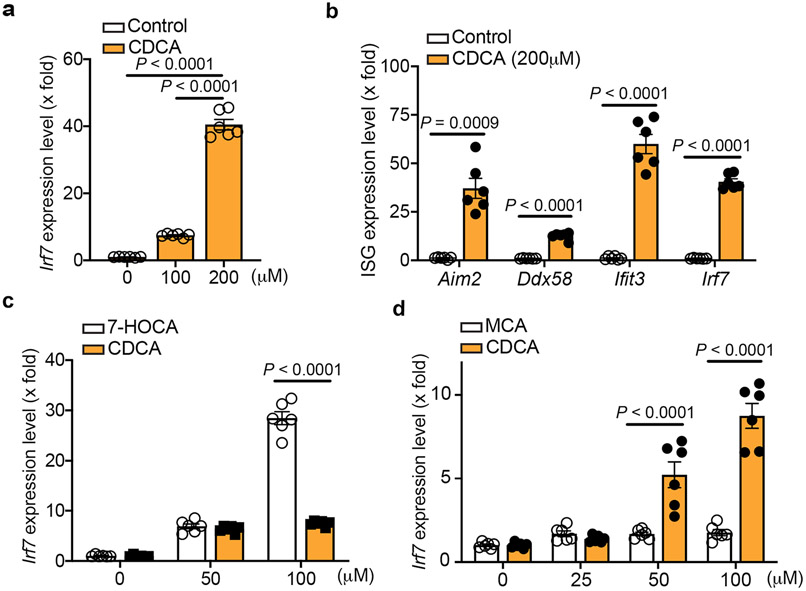
Chronic inflammation is associated with increased risk and poor prognosis of heart failure; however, the precise mechanism that provokes sustained inflammation in the failing heart remains elusive. Here we report that depletion of carnitine acetyltransferase (CRAT) promotes cholesterol catabolism through bile acid synthesis pathway in cardiomyocytes. Intracellular accumulation of bile acid or intermediate, 7α-hydroxyl-3-oxo-4-cholestenoic acid, induces mitochondrial DNA stress and triggers cGAS-STING-dependent type I interferon responses. Furthermore, type I interferon responses elicited by CRAT deficiency substantially increase AIM2 expression and AIM2-dependent inflammasome activation. Genetic deletion of cardiomyocyte CRAT in mice of both sexes results in myocardial inflammation and dilated cardiomyopathy, which can be reversed by combined depletion of caspase-1, cGAS or AIM2. Collectively, we identify a mechanism by which cardiac energy metabolism, cholesterol homeostasis and cardiomyocyte-intrinsic innate immune responses are interconnected via a CRAT-mediated bile acid synthesis pathway, which contributes to chronic myocardial inflammation and heart failure progression.


Figures

Extended Data Fig. 1 ∣
Extended Data Fig. 1 ∣. Activation of Myh6-MerCreMer with low doses of tamoxifen has no deleterious effects on cardiac function.
Adult Myh6-MerCreMer or Myh6-MerCreMer + male and female mice were injected with tamoxifen for 4 consecutive days at a dose of 20 mg/kg/day. a, b, Echocardiographic analyses were performed to estimate cardiac contractile function after 2 months. c-f, RT-PCR analysis of the expression of the hypertrophic marker genes and the pro-fibrotic genes in the hearts. No significant changes were observed between these two groups. n = 5 mice per group. Data are shown as the mean ± SEM. Analysis was unpaired two-tailed Student’s t-test (a-f). NS, not significant.
Extended Data Fig. 2 ∣
Extended Data Fig. 2 ∣. Cardiomyocyte-specific deletion of CRAT increases acetyl-CoA level in the hearts.
a, Western-blots showed that CRAT was specifically depleted in CRAT-mKO male and female hearts but not in lungs or gastrocnemius muscles. b, CRAT activity was dramatically decreased in CRAT-mKO male and female hearts. c, Acetyl-CoA level was significantly increased in CRAT-mKO male and female hearts. n = 4 (a), 9 (b, WT), 7 (b, mKO), 12 (c, WT), 7 (c, mKO) mice per group. Data are shown as the mean ± SEM. Analysis was unpaired two-tailed Student’s t-test (a-c).
Extended Data Fig. 3 ∣
Extended Data Fig. 3 ∣. Knockdown of CRAT in NRVMs increases the expression of pro-inflammatory cytokines.
NRVMs were transduced with lentivirus expressing Crat shRNA or control shRNA for 5 days. RNAs were extracted from the cells and RT-PCRs were then performed to determine the expression of hypertrophy, pro-fibrotic or pro-inflammatory genes. a, knockdown of CRAT expression was confirmed by RT-PCR. b-f, the expression of hypertrophic and pro-fibrotic genes was not increased by CRAT knockdown. g-i, the expression of Il-1β, Il-6 and Tnf-α was substantially increased in CRAT-deficient NRVMs. n = 6-7 (a-i, Sh-Control), 6 (a-i, Sh-Crat) biologically independent samples per group. Data are shown as the mean ± SEM. Analysis was unpaired two-tailed Student’s t-test (a-i). NS, not significant.
Extended Data Fig. 4 ∣
Extended Data Fig. 4 ∣. CRAT deficiency induces type I interferon responses in NRVMs.
a-e, NRVMs were transduced with lentivirus expressing Crat shRNA, control shRNA or no virus for 3 or 5 days. RNAs were extracted from the cells and RT-PCRs were then performed to determine the expression of Aim2 (a), Ddx58 (b), Ifih1(c), Ifit3 (d) and Irf7 (e). n = 4 (a-e) biologically independent samples per group. Data are shown as the mean ± SEM. Analysis was two-way ANOVA followed by Bonferroni’s multiple comparison test (a-e).
Extended Data Fig. 5 ∣
Extended Data Fig. 5 ∣. CRAT deficiency induces type I interferon responses in cardiac fibroblasts.
a-d, Cardiac fibroblasts were transduced with lentivirus expressing Crat shRNA, control shRNA or no virus for 3 or 5 days. RNAs were extracted from the cells and RT-PCRs were then performed to determine the expression of Aim2 (a), Ddx58 (b), Irf7 (c) and Ifit3 (d). n = 4 (a-d, no virus, Sh-Control), 3-4 (a-d, Sh-Crat) biologically independent samples per group. Data are shown as the mean ± SEM. Analysis was two-way ANOVA followed by Bonferroni’s multiple comparison test (a-d).
Extended Data Fig. 6 ∣
Extended Data Fig. 6 ∣. Depletion of CRAT has no effect on total mitochondrial DNA level in NRVMs and adult CMs.
a, b, NRVMs were transduced with lentivirus expressing control shRNA or Crat shRNA. Cells were harvested and mitochondria and cytosol fractionation was then performed after 5 days. Western blots indicated that there was no contamination between these two fractions (a). RT-PCRs were then performed with mitochondrial fraction to quantify the total mitochondrial DNA level (b). c, Adult CRAT-WT and CRAT-mKO male and female mice were injected with tamoxifen (20 mg/kg/day) for four consecutive days. Three weeks later, CMs were isolated from hearts for mitochondria and cytosol fractionation. RT-PCRs were then performed with mitochondrial fraction to quantify the total mitochondria DNA level. n = 5 biologically independent samples (b), 6 mice (c) per group. Data are shown as the mean ± SEM. Analysis was unpaired two-tailed Student’s t-test (b-c). NS, not significant.
Extended Data Fig. 7 ∣
Extended Data Fig. 7 ∣. RNA-sequencing analysis for NRVMs transduced with lentivirus expressing control shRNA or Crat shRNA.
a, b, Heatmap and volcano plot of the significantly differential expressed genes. c, d, GSEA analysis of hallmark pathways shows 17 upregulated and 17 downregulated pathways in CRAT knockdown (KD) NRVMs. e. Heatmap analysis of the major enzymes involved in cholesterol biosynthesis pathway.
Extended Data Fig. 8 ∣
Extended Data Fig. 8 ∣. Bile acids and 7-HOCA induce type I interferon responses in NRVMs.
a, b, NRVMs were treated with different doses of CDCA for 1 day. Cells were then harvested for RT-PCR to determine the expression of the indicated ISGs. c, d, NRVMs were treated with different doses of CDCA, 7-HOCA or MCA for 1 day. Cells were then harvested for RT-PCR to determine the expression of the indicated ISGs. n = 6 (a-d) biologically independent samples per group. Data are shown as the mean ± SEM. Analysis was one-way ANOVA (a) or two-way ANOVA (c-d) followed by Bonferroni’s multiple comparison test and unpaired two-tailed Student’s t-test (b).
Extended Data Fig. 9 ∣
Extended Data Fig. 9 ∣. PPARs inhibitor, GW9662, inhibits the type I interferon responses in CRAT-deficient NRVMs.
NRVMs were transduced with lentivirus expressing control shRNA or Crat shRNA. Cells were then treated with GW9662 (10 μM) or T0070907 (10 μM) as indicated for two days. a, b, RT–PCR indicated that GW9662 inhibited the induction of Cyp27a1 (a) and Cyp7b1(b) in CRAT-deficient NRVMs. c, d, GW9662 but not T0070907 abolished the increase in ISG expression induced by CRAT depletion. n = 6 (a-c), 4 (d) biologically independent samples per group. Data are shown as the mean ± SEM. Analysis was two-way ANOVA (a-b) or one-way ANOVA (d) followed by Bonferroni’s multiple comparison test and unpaired two-tailed Student’s t-test (c). NS, not significant.
Extended Data Fig. 10 ∣
Extended Data Fig. 10 ∣. Mitochondrial DNA activates AIM2-inflammasome in vitro.
Purified GST–AIM2 (2 μg), ASC protein (1 μg), His-Caspase-1 (2 μg) were incubated in the presence or absence of mtDNA (1 μg) or poly (dA:dT) (1 μg) in TE buffer for 30 min at 37 °C. The reaction mixtures were then loaded on SDS-PAGE gel and Western-blots were performed with the indicated antibodies. Here is the representative result from three independent experiments.
Fig. 1 ∣
Fig. 1 ∣. CRAT is downregulated in patients with HF and its activity is decreased in a mouse model of HF induced by transaortic constriction.
a, t-SNE plot showing 9,248 single cells isolated from hearts from both healthy individuals and patients with HF. b, CRAT expression in both CMs and FBs from patients with HF was significantly downregulated. CMs, P = 0.020; FBs, P = 0.003; Wilcoxon rank-sum test, one-sided test. EC, endothelial cell; SMC, smooth muscle cell. c, t-SNE plot of CMs from hearts of healthy individuals and patients with HF. The color indicates the expression level of CRAT. d,e, Western blots and quantification analysis indicated that CRAT protein level was not changed in male and female mouse hearts at 4 weeks after TAC operation. f, CRAT activity was dramatically decreased in TAC hearts. n = 4 mice (e,f) per group. Data are presented as mean ± s.e.m. NS, not significant. Analysis was carried out by unpaired two-tailed Student’s t-test (e,f).
Fig. 2 ∣
Fig. 2 ∣. Cardiomyocyte-specific deletion of CRAT leads to dilated cardiomyopathy in mice.
Adult Crat (flox/flox); Myh6-Cre± male and female mice were injected with tamoxifen for 4 d consecutively to specifically delete CRAT in CMs. a, Representative images of four-chamber heart sections stained with hematoxylin and eosin. Scale bar, 2 mm. b,c, HW:BW and HW:TL ratios were calculated at 2 months after tamoxifen injection. dg, Echocardiographic analyses indicated that deletion of CRAT in CMs impaired cardiac contractile function and resulted in DCM. LVID;s, left ventricular internal diameter end systole; LVID;d, left ventricular internal diameter end diastole. h, Representative images of WGA staining and quantitative analysis of CM cross sectional size. Scale bar, 25 μm. i, RT–PCR analysis of the expression of the hypertrophy marker genes in the hearts of CRAT-mKO mice and control WT mice. j, Representative pictures of Masson’s trichrome staining of cardiac sections and quantitative analysis of fibrotic area. Scale bar, 50 μm. k, RT–PCR analysis of the expression of the pro-fibrotic genes in the hearts of CRAT-mKO and WT mice. n = 13 mice (b,c, WT), 8 mice (b,c, mKO), 10 mice (dg), 10 mice (h, WT), 11 mice (h, mKO), 6 mice (i, Myh7, Bnp), 7 mice (i, Anf), 6 mice (j, WT), 7 mice (j, mKO), 6 mice (k, Ctgf, Tgf-b, Collal, Col3a1), 5 mice (k, Fn1) per group. Data are presented as mean ± s.e.m. Analysis was carried out by unpaired two-tailed Student’s t-test (bk).
Fig. 3 ∣
Fig. 3 ∣. Depletion of CRAT triggers type I interferon responses in primary cardiomyocytes.
a,b, Heat map and GSEA of ISGs in NRVMs transduced with lentivirus expressing control shRNA (WT) or Crat shRNA (KD). c, RT–PCR confirmed the induction of ISGs in CRAT-deficient NRVMs. dh, RT–PCRs indicated that increased expression of ISGs in CRAT-deficient NRVMs was dependent on cGAS. i, Western blots confirmed cGAS-dependent induction of some ISGs in CRAT-deficient NRVMs.j, Quantification of cytosolic mtDNA in control or CRAT-deficient NRVMs. k, Quantification of cytosolic mtDNA in adult CMs isolated from CRAT-WT or CRAT-mKO male and female hearts. l, Treatment with cyclosporin A (CsA, 10 μM) significantly inhibited ISG expression in CRAT-deficient NRVMs. n = 6 (c), n = 6 (dh, Sh-control), n = 7 (df,h, Sh-cGas), n = 5 (g, Sh-cGas and Sh-Crat), n = 5 (j), n = 6 (k) and n = 4 (l) biologically independent samples per group. Data are presented as mean ± s.e.m. Analysis was carried out by two-way analysis of variance (ANOVA) followed by Bonferroni’s multiple comparison test (dh) and unpaired two-tailed Student’s t-test (c,jl).
Fig. 4 ∣
Fig. 4 ∣. Bile acid synthesis intermediate 7-HOCA promotes mtDNA stress and induces ISG expression.
a, Schematic diagram of the classic and acidic bile acid synthesis pathways. b, Heat map analysis of the major enzymes of bile acid synthesis pathway expressed in NRVMs. c, RT–PCR confirmed the increased expression of Cyp27a1, Cyp7b1 and Hsd3b7 in CRAT-deficient NRVMs. d,e, Cholesterol level was increased in CRAT-deficient NRVMs (d) and adult CMs isolated from CRAT-mKO male and female mice (e). f, Metabolomics analysis indicated intracellular accumulation of 7-HOCA and MCA in CRAT-deficient NRVMs. g,h, 7-HOCA (100 μM) induced mtDNA release into cytosol (g) and ISG expression (h) in NRVMs after 24 h of treatment. il, Knockdown of PPARα abolished the increase in ISG expression induced by CRAT depletion in NRVMs. mr, Adult CRAT-WT and CRAT-mKO male and female mice were injected with AAV9-sh-control or AAV9-sh-Pparα virus (5 × 10¹¹ GC per mouse) at 1 week before tamoxifen administration. Four weeks later, CMs were isolated for metabolomics analysis and RT–PCR. Knockout of CRAT led to an increase in 7-HOCA (m) and ISG expression in vivo (or), which are dependent on PPARα. n = 6 biologically independent samples (c,d,gl), n = 6 mice (e), n = 4 biologically independent samples (f), n = 5 mice (m,n) and n = 6 mice (or) per group. Data are shown as the mean ± s.e.m. (ce,gl,or). The black line inside the box plots (f,mn) represents the median value and the size of the box is determined by the 25th and 75th percentiles of the data. The whiskers of the box plot represent the maximum and minimum values of the data. Analysis was carried out by unpaired two-tailed Student’s t-test (ch) and two-way ANOVA followed by Bonferroni’s multiple comparison test (ir).
Fig. 5 ∣
Fig. 5 ∣. Depletion of CRAT activates DNA-sensing AIM2 inflammasome.
NRVMs were transduced with lentivirus expressing control shRNA or Crat shRNA for 5 d. All transduced cells expressed green fluorescent protein (GFP). a, Cells were fixed for immunostaining with anti-AIM2 antibody. Representative images showed that knockdown of CRAT induced the formation of AIM2 specks. Scale bar, 25 μm. bd, Western blots and quantification analyses indicated that the cleavage of pro-caspase-1 (c) and pro-IL-1β (d) was increased in CRAT-deficient NRVMs. e, Representative images of NRVMs stained with cardiac troponin-T antibody showed that knockdown of CRAT disrupted sarcomere organization. Scale bar, 25 μm. f, Depletion of CRAT significantly increased the number of TUNEL-positive NRVMs. gi, Western blots confirmed that AIM2 was required for pro-caspase-1 and GSDMD cleavage in CRAT-deficient NRVMs. n = 6 (a,c,d,f) and n = 5 (h,i) biologically independent samples per group. Data are shown as mean ± s.e.m. Analysis was carried out by unpaired two-tailed Student’s t-test (a,c,d,f) and two-way ANOVA followed by Bonferroni’s multiple comparison test (h,i).
Fig. 6 ∣
Fig. 6 ∣. Depletion of caspase-1, cGAS or AIM2 reverses myocardial inflammation and dilated cardiomyopathy induced by CRAT knockout.
a,b, Combined deletion of caspase-1 In CRAT-mKO male and female mice inhibited the increases in IL-1β level in serum (a) and hearts (b). c,d, Representative images and quantitative analysis showed that the infiltration of F4/80+ macrophages in CRAT-mKO male and female hearts was significantly inhibited by combined deletion of caspase-1. Scale bar, 25 μm. DAPI, 4,6-diamidino-2-phenylindole. eg, HW:TL ratios (e) and echocardiographic analyses (f,g) at 2 months after tamoxifen injection indicated that combined deletion of caspase-1 reversed the compromised cardiac function induced by CRAT deficiency. EF, ejection fraction; FS, fractional shortening. hj, CRAT-WT and CRAT-mKO male and female mice were injected with AAV9-sh-control, AAV9-sh-cGas or AAV9-sh-Aim2 virus (5 × 10¹¹ GC per mouse) at 1 week before tamoxifen administration. After 8 weeks, echocardiographic analyses were performed to evaluate cardiac contractile function (h). CMs were then isolated for western blots to examine the roles of cGAS and AIM2 in inflammasome activation induced by CRAT depletion in vivo (i,j). n = 6 (a,b,d), n = 8 (e), n = 7–8 (f,g, WT), n = 6 (f,g, Casp1 KO), n = 6 (h, WT, Sh-cGas), n = 7 (h, Sh-Aim2) and n = 6 (j) mice per group. Data are shown as mean ± s.e.m. Analysis was carried out by two-way ANOVA followed by Fisher’s LSD multiple comparison test (a,b,dg,h,j).
Fig. 7 ∣
Fig. 7 ∣. Schematic model of the role of CRAT in cholesterol metabolism and innate immune responses.
Loss of CRAT promotes cholesterol catabolism through the bile acid synthesis pathway, leading to intracellular accumulation of intermediates of bile acid synthesis such as 7-HOCA, which is sufficient to promote mtDNA release into cytosol and trigger cGAS–STING-dependent type I interferon responses. Further, type I interferon responses elicited by CRAT deficiency lead to a substantial increase in AIM2 expression and subsequent activation of the DNA-sensing AIM2 inflammasome, which in turn promotes proteolytic maturation of IL-1β and CM pyroptosis. Eventually, genetic deletion of CRAT in CMs leads to myocardial inflammation and results in DCM. Collectively, we have identified a mechanism by which cardiac energy metabolism, cholesterol homeostasis and CM-intrinsic innate immune responses are interconnected via a CRAT-mediated bile acid synthesis pathway, which contributes to chronic myocardial inflammation and HF progression.

Comment in

References

    1. Hunt SA et al. ACC/AHA guidelines for the evaluation and management of chronic heart failure in the adult: executive summary a report of the American College of Cardiology/American Heart Association Task Force on practice guidelines (committee to revise the 1995 guidelines for the evaluation and management of heart failure): developed in collaboration with the International Society for Heart and Lung Transplantation; endorsed by the Heart Failure Society of America. Circulation 104, 2996–3007 (2001). - PubMed
    1. McDonagh TA et al. 2021 ESC Guidelines for the diagnosis and treatment of acute and chronic heart failure. Eur. Heart J 42, 3599–3726 (2021). - PubMed
    1. Doenst T, Nguyen TD & Abel ED Cardiac metabolism in heart failure: implications beyond ATP production. Circ. Res 113, 709–724 (2013). - PMC - PubMed
    1. Muoio DM et al. Muscle-specific deletion of carnitine acetyltransferase compromises glucose tolerance and metabolic flexibility. Cell Metab. 15, 764–777 (2012). - PMC - PubMed
    1. Davidson MT et al. Extreme acetylation of the cardiac mitochondrial proteome does not promote heart failure. Circ. Res 127, 1094–1108 (2020). - PMC - PubMed

Publication types

LinkOut - more resources