. 2023 Jul 13;14(1):4186.
doi: 10.1038/s41467-023-39837-z.

Impact of misclassified defective proviruses on HIV reservoir measurements

Affiliations

Impact of misclassified defective proviruses on HIV reservoir measurements

Daniel B Reeves et al. Nat Commun. .

Abstract

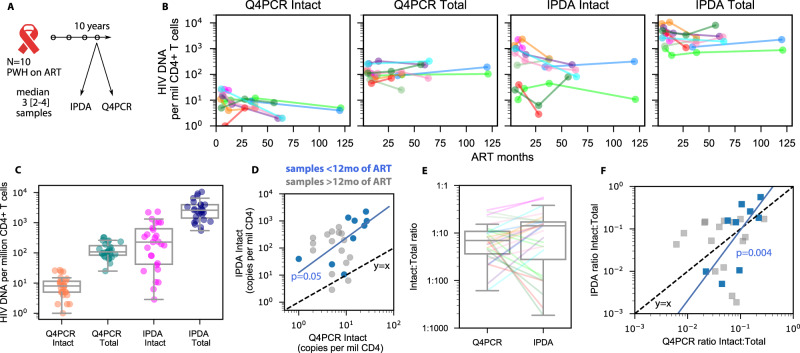
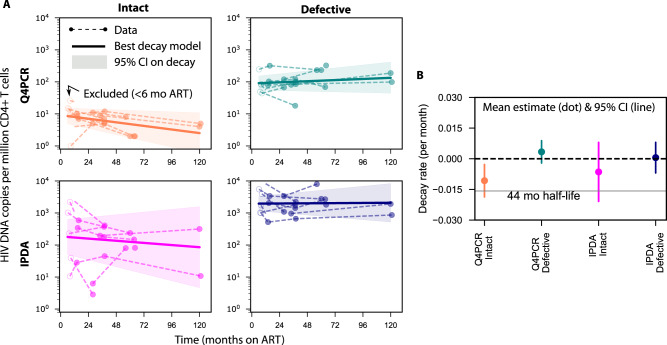
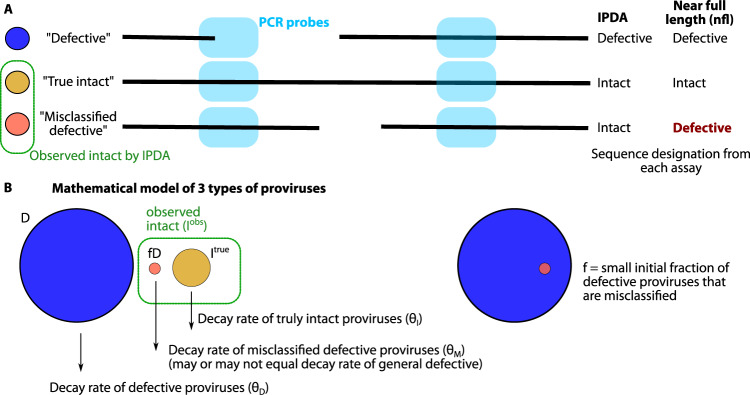
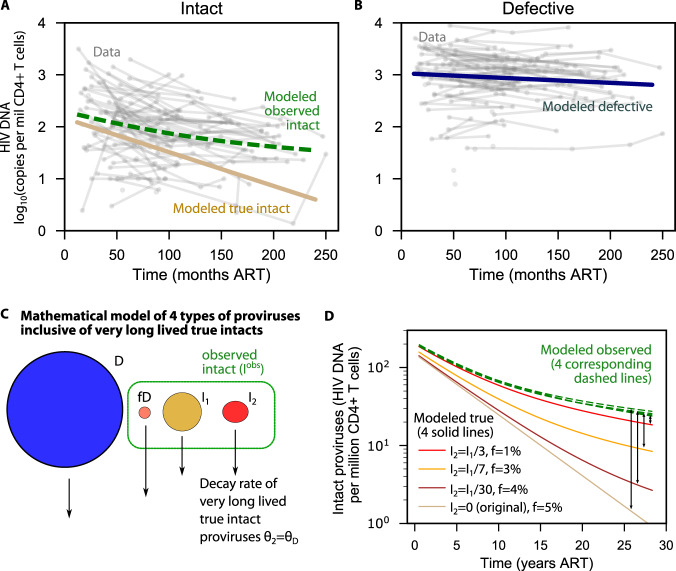
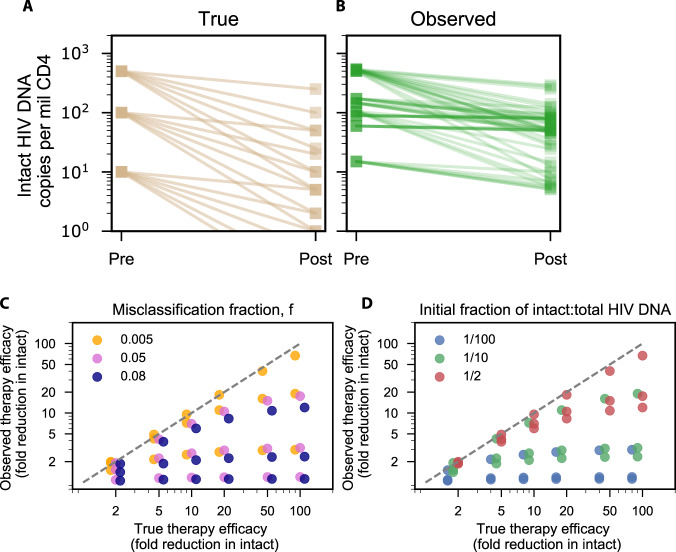
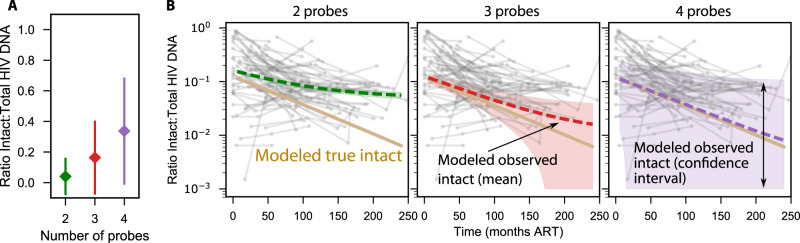
Most proviruses persisting in people living with HIV (PWH) on antiretroviral therapy (ART) are defective. However, rarer intact proviruses almost always reinitiate viral rebound if ART stops. Therefore, assessing therapies to prevent viral rebound hinges on specifically quantifying intact proviruses. We evaluated the same samples from 10 male PWH on ART using the two-probe intact proviral DNA assay (IPDA) and near full length (nfl) Q4PCR. Both assays admitted similar ratios of intact to total HIV DNA, but IPDA found ~40-fold more intact proviruses. Neither assay suggested defective proviruses decay over 10 years. However, the mean intact half-lives were different: 108 months for IPDA and 65 months for Q4PCR. To reconcile this difference, we modeled additional longitudinal IPDA data and showed that decelerating intact decay could arise from very long-lived intact proviruses and/or misclassified defective proviruses: slowly decaying defective proviruses that are intact in IPDA probe locations (estimated up to 5%, in agreement with sequence library based predictions). The model also demonstrates how misclassification can lead to underestimated efficacy of therapies that exclusively reduce intact proviruses. We conclude that sensitive multi-probe assays combined with specific nfl-verified assays would be optimal to document absolute and changing levels of intact HIV proviruses.


Conflict of interest statement

The authors declare no competing interests.

Figures

Fig. 1
Fig. 1. Comparison of reservoir size and half-lives using two intact HIV reservoir assays.
A Study schematic. B Longitudinal HIV DNA levels using 2 assays from 10 PWH for intact and total HIV DNA. C HIV DNA levels for each assay and proviral category grouped over all n = 35 longitudinal time points. Box plots indicate median (center line), interquartile range (box), and 1.5x interquartile range (whiskers). D Head-to-head comparison of intact levels measured by both assays. Blue and gray dots indicate samples taken before and after 1 year of ART, respectively. Dashed black line indicates the line y = x. Blue line indicates the slope of early time points, which was significantly correlated (1 sided Spearman p = 0.05). E Ratio of intact to total HIV DNA for both assays over all n = 35 longitudinal time points from N = 10 PWH. Box plots indicate median (center line), interquartile range (box), and 1.5x interquartile range (whiskers). F Head-to-head comparison of intact:total ratios measured by both assays. Blue and gray dots indicate samples taken before and after 1 year of ART, respectively. Dashed black line indicates the line y = x. Blue line indicates the slope of early time points, which was significantly correlated (1 sided Spearman p = 0.004).
Fig. 2
Fig. 2. Estimated reservoir decay from two HIV DNA assays.
A Log-linear mixed effects model estimates the average decay (solid line) with confidence band (shaded area) fitted to longitudinal samples from PWH on ART (dots and dashed lines, open dots indicate excluded time points before 6 months). B Average (dot) and confidence interval (vertical line) for the estimated decay rate of each assay and proviral category from N = 10 PWH. Decay rates are used to allow for zero or positive values (growing population and infinite half-life). A benchmark 44 month half-life is included to contextualize decay rates.
Fig. 3
Fig. 3. Schematic illustration of misclassified intact proviruses from 2 probe assay.
A Using primer probes targeting 2 regions of the HIV genome, it is possible to have agreement between IPDA and near full length sequencing for intact and defective proviruses. But it is also possible to find misclassified defective sequences: intact in both primer regions but defective elsewhere. B Codifying this system into a mathematical model by assuming there are 3 population sizes for the proviral types, each with its own decay rate (which can be zero or growing). Observed intact proviruses are the sum of true intact and misclassified defective proviruses, and misclassified defective proviruses are calculated from the fraction f of all defective proviruses.
Fig. 4
Fig. 4. Modeled estimate of intact HIV DNA clearance including misclassification and/or very long lived intact proviruses.
A Observed intact model (dashed green) matches the data (gray) by adding misclassified defectives to true intact proviruses that continuously decay with a 46 month half-life (tan). B Defective proviral levels from the model (navy) simultaneously match data (gray) and contribute to long-term decay of observed intact proviruses in (A). C Mathematical model from Fig. 2 with an additional compartment of truly intact proviruses that are very long lived (I2) and decay with the same rate as defective proviruses. D Simulations of this extended model. Each solid line represents an assumption about the initial level of very long lived proviruses (from none, the original assumption, to 1/3 of all truly intact proviruses). A different corresponding misclassification fraction was needed so that all 4 dashed green lines overlay and correctly regenerate observed intact levels from (A).
Fig. 5
Fig. 5. Underestimation of therapeutic efficacy occurs with high true efficacy, high misclassification, and low initial intact fractions.
Simulated true (A) vs observed (B) reduction in intact HIV DNA after therapies with 6 different efficacies each ranging from 2-fold to 100-fold reduction in intact proviruses (no reduction of defective proviruses) applied to reservoirs with 3 different initial intact fractions, for a total of 18 simulations. C True therapeutic efficacy vs observed therapeutic efficacy for the range of therapies, colored by misclassification fraction ranging from 0.5 to 8%. There are 3 dots of each color, for each x-value, representing the variability from the initial fraction. D True therapeutic efficacy vs observed therapeutic efficacy for the range of therapies, colored by initial fraction of intact to total HIV DNA ranging from 1/100 to 1/2. There are 3 dots of each color, for each x-value, representing the variability from the misclassification fraction.
Fig. 6
Fig. 6. Estimating gains of specificity vs loss of sensitivity in multi-probe assays.
A The mean and confidence intervals for the ratio of intact to total proviruses observed during Q4PCR measurements across all n = 35 longitudinal time points from N = 10 PWH. B Simulating theoretical observed decay given gains in specificity by reducing f (Methods) for 2, 3, and 4 probes. The mean decay (dashed lines) increasingly overlaps with the true decay (solid tan line, identical in each panel) as probes are added. However, additional probes result in fewer detected sequences (see A), and confidence interval around the mean decay (shaded area) broadens vastly for more probes.

Similar articles

Cited by

References

    1. Finzi D, et al. Latent infection of CD4+ T cells provides a mechanism for lifelong persistence of HIV-1, even in patients on effective combination therapy. Nat. Med. 1999;5:512–517. doi: 10.1038/8394. - DOI - PubMed
    1. Chun TW, et al. Quantification of latent tissue reservoirs and total body viral load in HIV-1 infection. Nature. 1997;387:183–188. doi: 10.1038/387183a0. - DOI - PubMed
    1. Piantadosi A, Humes D, Chohan B, McClelland RS, Overbaugh J. Analysis of the percentage of human immunodeficiency virus type 1 sequences that are hypermutated and markers of disease progression in a longitudinal cohort, including one individual with a partially defective Vif. J. Virol. 2009;83:7805–7814. doi: 10.1128/JVI.00280-09. - DOI - PMC - PubMed
    1. Ho Y-C, et al. Replication-competent noninduced proviruses in the latent reservoir increase barrier to HIV-1 cure. Cell. 2013;155:540–551. doi: 10.1016/j.cell.2013.09.020. - DOI - PMC - PubMed
    1. Bruner KM, et al. Defective proviruses rapidly accumulate during acute HIV-1 infection. Nat. Med. 2016;22:1043–1049. doi: 10.1038/nm.4156. - DOI - PMC - PubMed

Publication types