. 2023 Aug;22(8):1013-1021.
doi: 10.1038/s41563-023-01598-x. Epub 2023 Jul 13.

Spin-exchange carrier multiplication in manganese-doped colloidal quantum dots

Affiliations

Spin-exchange carrier multiplication in manganese-doped colloidal quantum dots

Ho Jin et al. Nat Mater. 2023 Aug.

Abstract

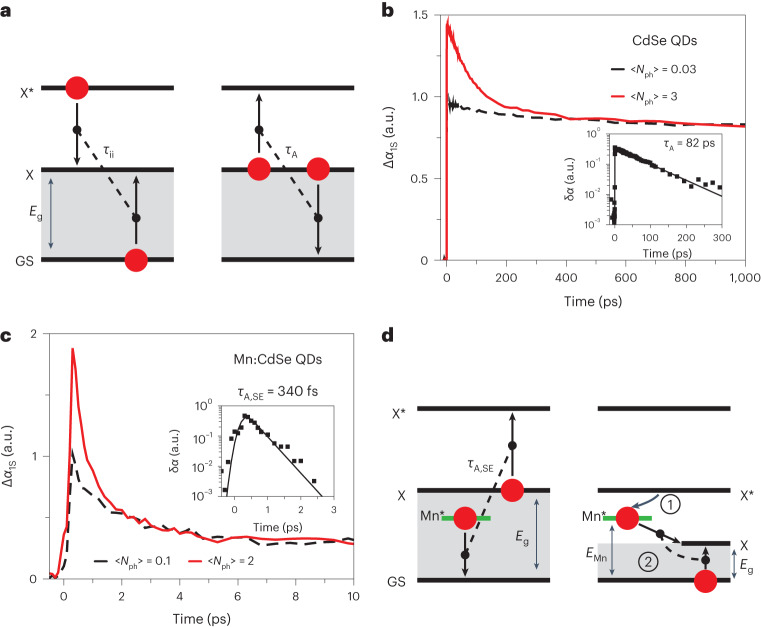
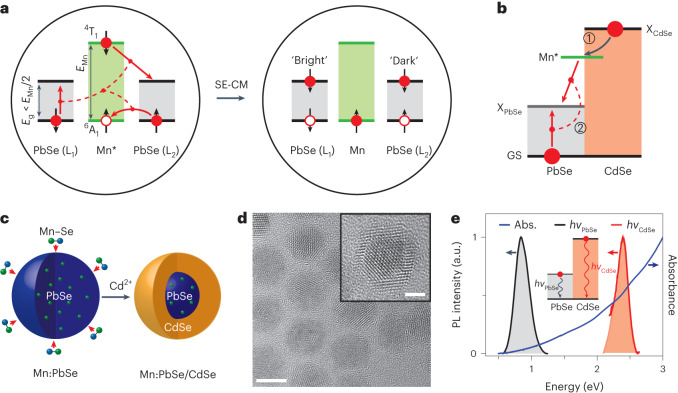
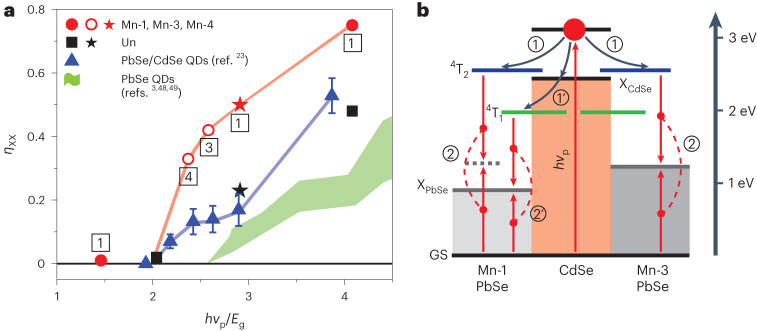
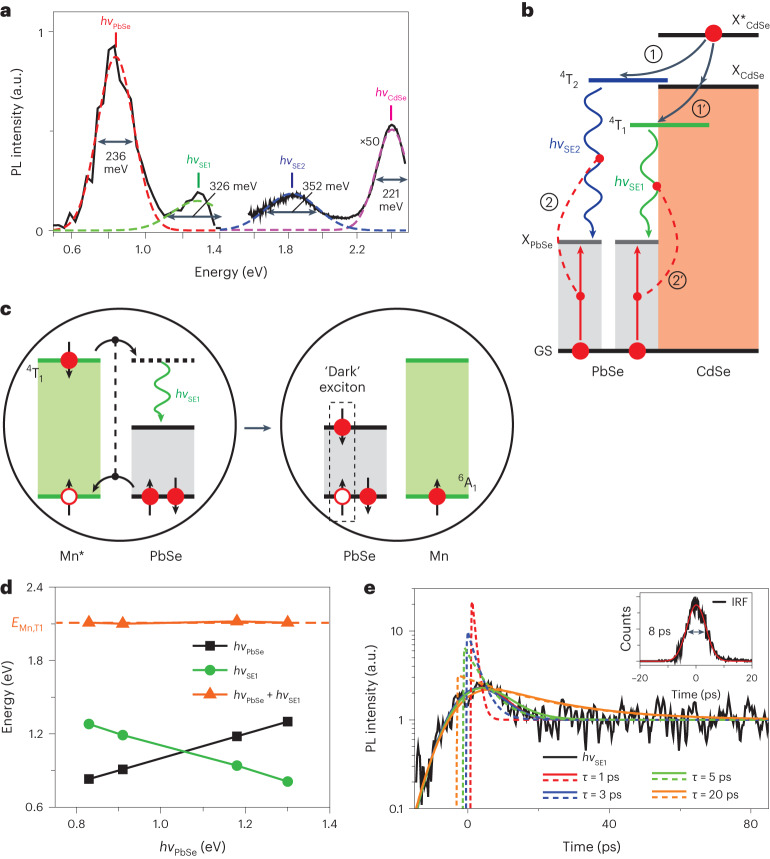
Carrier multiplication is a process whereby a kinetic energy of a carrier relaxes via generation of additional electron-hole pairs (excitons). This effect has been extensively studied in the context of advanced photoconversion as it could boost the yield of generated excitons. Carrier multiplication is driven by carrier-carrier interactions that lead to excitation of a valence-band electron to the conduction band. Normally, the rate of phonon-assisted relaxation exceeds that of Coulombic collisions, which limits the carrier multiplication yield. Here we show that this limitation can be overcome by exploiting not 'direct' but 'spin-exchange' Coulomb interactions in manganese-doped core/shell PbSe/CdSe quantum dots. In these structures, carrier multiplication occurs via two spin-exchange steps. First, an exciton generated in the CdSe shell is rapidly transferred to a Mn dopant. Then, the excited Mn ion undergoes spin-flip relaxation via a spin-conserving pathway, which creates two excitons in the PbSe core. Due to the extremely fast, subpicosecond timescales of spin-exchange interactions, the Mn-doped quantum dots exhibit an up-to-threefold enhancement of the multiexciton yield versus the undoped samples, which points towards the considerable potential of spin-exchange carrier multiplication in advanced photoconversion.


Conflict of interest statement

The authors declare no competing interests.

Figures

Fig. 1
Fig. 1. Auger recombination and impact ionization in undoped and Mn-doped QDs.
a, Impact ionization (left) can be thought of as the inverse of Auger recombination (right); GS is the ground state, and X and X* are the band-edge and the hot-exciton states, respectively. During Auger recombination, the energy of one exciton is transferred to the other, which leads to the formation of a hot-exciton state (right). In the course of impact ionization, a hot exciton loses its kinetic energy by creating a new exciton (left). b, The 1S TA dynamics of the undoped CdSe QDs obtained using 2.4 eV excitation and two different pump fluences, 〈Nph〉 = 0.03 (black) and 3 (red). The higher pump intensity trace exhibits a fast initial component (~82 ps time constant) due to multi-carrier Auger recombination. The inset shows the extracted Auger dynamics obtained by subtracting tail-normalized high- and low-pump-fluence traces (δα is the difference between TA signals for the different 〈Nph〉 values). c, The same measurements as in b, applied to the Mn-doped sample (〈Nph〉 = 0.1 and 2), reveal considerably faster dynamics arising from spin-exchange Auger recombination (note a 100-fold difference in the overall time spans in c and b). Based on the ‘extracted’ Auger decay (inset), the characteristic time constant is 340 fs. d, An ‘excitonic’ representation of spin-exchange Auger recombination (left) and spin-exchange CM (right). In the first process, the energy released during spin-flip relaxation of the excited Mn ion (Mn*), EMn, is transferred to the QD band-edge exciton, leading to the formation of a hot exciton. During spin-exchange CM, the Mn ion excited via capture of a hot exciton (step 1) relaxes by generating two band-edge excitons (step 2). Source data
Fig. 2
Fig. 2. Spin-exchange CM.
a, Spin-exchange CM (SE-CM) in Mn-doped PbSe QDs. Spin directions are shown by short, black single-sided arrows. Spin-conserving transitions are shown by red arrows. Due to spin conservation, the biexciton produced via relaxation of the excited Mn ion is a combination of a dark and a bright exciton (spins 1 and 0, respectively) in two different L valleys of PbSe (L1 and L2). The final biexciton state comprises two band-edge electrons with co-aligned spins, which is impossible in a single-valley semiconductor due to Pauli exclusion. b, An excitonic representation of spin-exchange CM in Mn-doped PbSe/CdSe core/shell QDs. An exciton generated in the CdSe shell (XCdSe) initiates the first step of spin-exchange CM, which is formation of the excited Mn state (Mn*) due to CdSe–Mn spin-exchange energy transfer (step 1). During step 2, Mn* undergoes spin-flip relaxation by creating two excitons in the PbSe core (XPbSe) via the spin-exchange process depicted in a. c, A schematic depiction of QD synthesis. Mn dopants are incorporated into preformed PbSe QDs via diffusion doping. The CdSe shell is formed using a controlled cation exchange reaction during which the original cations in the peripheral region of the QD are replaced with the Cd2+ ions. d, A typical TEM image of Mn-doped PbSe/CdSe core/shell QDs (scale bar, 5 nm). Inset shows a higher magnification view of an individual QD, which displays a clear core/shell structure (scale bar, 2 nm). e, Absorption (Abs.; blue) and dual-band PL (red and black) spectra of the Mn-doped PbSe/CdSe QDs (sample Mn-1). The NIR (black; hvPbSe = 0.83 eV) and visible-range (red; hvCdSe = 2.38 eV) PL bands are due to emissions from the PbSe core and the CdSe shell, respectively (inset). Source data
Fig. 3
Fig. 3. CM measurements of undoped and Mn-doped PbSe/CdSe core/shell QDs.
a, Time-resolved intensity of the NIR PbSe-core emission for the Mn-doped (Mn-1, red) and the undoped (Un, black) QDs at low (solid symbols) and high (open symbols) pump fluences (top panel; 〈Nph〉 = 0.01 and ~0.5, respectively). These dynamics were measured using pump photons with a sub-CM-threshold energy (hvp = 1.20 eV and 1.55 eV for the doped and the undoped samples, respectively). The traces are normalized so as to match the long-time tails. The symbols are raw data, and the lines are traces obtained via a deconvolution procedure to account for the 58 ps IRF. The higher pump-intensity traces develop a fast initial component that is absent in the dynamics recorded using the low pump level. The fast PL component (middle panel; symbols; isolated via subtraction of high- and low-pump-intensity traces) is due to the Auger decay of bi-excitons. It exhibits exponential dynamics with time constant τXX ≈ 170 ps (dashed line), which is the same for the doped and undoped samples. The exciton multiplicity (〈NX〉) calculated from the A/B ratio of the ‘deconvolved’ PL traces as a function of 〈Nph〉 (symbols; bottom panel) is fitted using the Poisson statistics of photon absorption events (line; bottom panel). b, A similar set of data but obtained using 3.1 eV excitation, which is above the CM threshold. As distinct from a, even the lowest intensity traces exhibit a fast bi-excitonic component (top) whose time constant (middle) is similar to that obtained using low photon excitation. Another distinction is a strong deviation of the measured 〈NX〉 (symbols; bottom panel) from the Poisson dependence (solid black line; bottom panel). In particular, the low-〈Nph〉 limit is greater than 1, a typical signature of CM. Based on these data, multiexciton yields are 48% and 75% for the undoped and doped samples, respectively. c, The PbSe-core NIR PL dynamics of doped samples Mn-3 (left) and Mn-4 (right) also exhibit a pronounced bi-excitonic component despite the use of low, sub-single-exciton pump levels (〈Nph〉 < 0.1). This points towards highly efficient CM. hvPL is the PL detection energy, which defines the bandgap of the QDs probed in the CM measurements. Source data
Fig. 4
Fig. 4. CM efficiencies in undoped and Mn-doped QDs.
a, Multiexciton yields (ηXX) as a function of photon energy normalized by the bandgap (hvp/Eg). The data from the present study are shown by red (Mn-doped QDs) and black (undoped QDs) symbols; circles and squares are the PL measurements, and stars are the TA measurements. Labels 1 to 4 are sample numbers for the Mn-doped QDs. The PL and TA data were obtained using hvp = 3.1 eV and 2.41 eV, respectively. The blue triangles show the CM measurements of undoped PbSe/CdSe QDs from ref. (the error bars are from the same work). CM efficiencies of core-only PbSe QDs are schematically shown by green shading (refs. ,,). b, An excitonic representation of spin-exchange CM for samples Mn-1 and Mn-3 in the case of 3.1 eV excitation. This process occurs via activation of the Mn ion via exciton transfer from the CdSe shell (step 1 or 1′) followed by Mn* relaxation, which creates a biexciton in the PbSe core (step 2 or 2′). In the case of 3.1 eV excitation, the energy of a photogenerated hot exciton is sufficiently high to excite both the 4T2 and 4T1 states of the Mn ion (the 4T1 state can also be excited via capture of a band-edge exciton following hot-exciton cooling). In sample Mn-1, spin-exchange CM can be driven by both the 4T26A1 and 4T16A1 spin-flip transitions. However, in sample Mn-3, which has a higher bandgap, spin-exchange CM can be driven only by the higher-energy 4T26A1 transition. Due to the larger number of spin-exchange CM pathways, sample Mn-1 shows a higher CM efficiency than sample Mn-3 (a). Source data
Fig. 5
Fig. 5. Observations of radiative spin-exchange Mn–PbSe-core coupling.
a, The PL spectrum of Mn-doped QDs (sample Mn-1) spanning from a NIR to a visible spectral range. The lower-energy part of the spectrum (~0.5 eV to ~1.4 eV) is instantaneous PL measured using a superconducting single-photon detector (SSPD) at 10 ns after excitation with 1.55 eV, 50 fs pump pulses. Using a time-resolved SSPD technique, we are able to observe simultaneously a long-lived hvPbSe band and a short-lived hvSE1 feature. The higher-spectral-energy PL (>1.5 eV), which comprises short-lived hvCdSe and hvSE2 features, is time-integrated emission measured with a standard Si detector using 3.1 eV excitation. The observed PL features are fitted to Gaussian bands whose widths (defined as a full-width at half-maximum) are indicated in the figure. b, An excitonic representation of radiative channels leading to the hvSE1 and hvSE2 emission features. Steps 1′ and 1 are excitation of the 4T1 and 4T2 states of the Mn ion via exciton transfer from the CdSe shell. Step 2 or 2′ is Mn* decay to produce a photon and a PbSe-core exciton. c, A more rigorous spin-exchange depiction of the emission pathway leading to the hvSE1 PL features. Due to spin conservation, decay of the 4T1 state produces a spin-1 dark PbSe core exciton. d, Spectral energies hvPbSe (black squares) and hvSE1 (green circles), and their sum (hvPbSe + hvSE1; orange triangles) as a function of hvPbSe (based on the measurements of samples Mn-1 to Mn-4). e, Streak-camera measurements of the dynamics of the hvSE1 PL band (black trace) reveal a fast, resolution-limited decay component. Based on the deconvolution using the measured 8 ps IRF (the black line in the inset; the red line is a Gaussian fit; the grey arrow shows the IRF full width at half maximum), we determine that the relaxation time constant of the hvSE1 PL feature (τSE1) is 3 ps (blue) or shorter (red; τSE1 = 1 ps). The use of longer time constants (5 ps and 20 ps; green and orange traces, respectively) leads to an appreciable deviation of the modelling from the measurement. The deconvolution procedure also indicates that the fast decay component is responsible for more than 90% of the overall PL signal. The dashed and the solid lines are the model traces before and after convolution with the IRF, respectively. Source data
Extended Data Fig. 1
Extended Data Fig. 1. Transmission electron microscopy (TEM) measurements of undoped and Mn-doped PbSe/CdSe QDs.
The TEM images and size distributions of (a, b) the Mn-doped (sample ‘Mn-1’) and (c, d) the reference, undoped (sample ‘Un’) PbSe/CdSe core/shell QDs. Red curves are Gaussian fits of size distributions shown by black vertical bars. R is the average overall radius of the QDs and δR is the standard deviation. Mn-doped QDs have a slightly larger size than undoped QDs. This is due to addition of Mn-Se units during the diffusion doping process, which leads to the increase of the overall size of the QDs.
Extended Data Fig. 2
Extended Data Fig. 2. Mn-doped PbSe/CdSe core/shell QDs.
a, A schematic depiction of a Mn-doped PbSe/CdSe QD. b, An exemplary TEM image of a QD from one of the Mn-doped PbSe/CdSe QD samples (sample Mn-1). The PbSe core radius (r) is 2.3 nm, the CdSe shell thickness (h) is 1.6 nm, and the overall QD radius (R) is 3.9 nm. c, The absorption (top) and emission (bottom) spectra of the Mn-doped PbSe/CdSe QDs as a function of duration of a cation exchange reaction (tCE) leading to formation of the CdSe shell (red and orange traces). The spectra of the original undoped PbSe QDs are shown in black. The spectra of Mn-doped PbSe QDs before cation exchange are shown in green. After doping with Mn, the PL of the PbSe QDs is completely quenched. It is recovered after the formation of the CdSe shell. The progressive increase of the CdSe-shell thickness leads to the shrinkage of the PbSe core, which manifests as a blue shift of the PL spectrum and the band-edge absorption feature. Inset: Mn content as a function of tCE. d, Modeling of diffusion doping of PbSe QDs using Fick’s 2nd law of diffusion leads to a Mn distribution shown by the black line. The diffusion parameters are selected so as to yield the total content of Mn ions of 8% (defined by the area under the black trace), which corresponds to the experimental situation in the case of sample Mn-1. Then, we assume that during cation exchange, Cd2+ replaces the original cations within the shell region. The resulting distribution of Mn ions is given by the red trace. Based on the area under this trace, the Mn content is reduced to 2%, which is close to the experimental value of 1.6%. This analysis suggests that the distribution of the Mn ions is peaked at the core/shell interface and gradually decays towards the PbSe core centre. Source data
Extended Data Fig. 3
Extended Data Fig. 3. Dual-band emission spectra of Mn-doped PbSe/CdSe QDs.
PL spectra of the Mn-doped samples: (a) Mn-2, (b) Mn-3, (c) Mn-4. All samples show dual-band emission originating from the core (black) and the shell (red) of the PbSe/CdSe QDs. Source data
Extended Data Fig. 4
Extended Data Fig. 4. Transient absorption (TA) measurements of carrier multiplication (CM) in undoped and Mn-doped PbSe/CdSe QDs.
Pump-fluence-dependent femtosecond TA measurements of band-edge bleach dynamics in Mn-doped (sample Mn-1; a, c, d, f) and undoped (sample Un; b, c, e, f) PbSe/CdSe QDs probed at hvprobe = 0.84 eV (ΔA is the pump-induced change in sample absorbance). The measured transients are normalized so as to match the long-time tails. These measurements were conducted using pump photon energies hvp = 1.2 eV (ac) and 2.41 eV (df), which corresponded to excitation below and above the CM threshold, respectively. In both cases, TA dynamics develop a fast Auger decay component at higher pump levels, which is consistent with generation of multiexcitons. However, only for the 2.41-eV excitation, the fast Auger component persists in the limit of sub-single-exciton pump levels, which is a signature of CM. In the case of hvp = 1.2 eV, for both doped and undoped samples (c; red and black symbols respectively), the exciton multiplicity (〈NX〉) derived from the analysis of the early- and late-time TA amplitudes tends to 1 in the limit of low pump fluences, indicating no CM. However, the same analysis for the case of hvp = 2.41 eV indicates 〈NX〉 of 1.23 and 1.5 for the undoped (f; black squares) and doped (f; red circles) samples, respectively. This is a signature of CM. The biexciton yield in the Mn-doped sample (ηXX = 50%) is more than twice as large as in the undoped sample (ηXX = 23%). Dashed lines in ‘c’ and ‘f’ are linear fits to the data. Source data
Extended Data Fig. 5
Extended Data Fig. 5. Transient photoluminescence (PL) measurements of the undoped and Mn-doped PbSe/CdSe QDs.
Two-dimensional plots of time- and spectrally-resolved PL of Mn-doped QDs (sample Mn-1) (a) and reference, undoped QDs (b). These data were collected using excitation with hvp = 3.1 eV and 〈Nph〉 < 0.1. In addition to the band-edge NIR emission from the core (hvPbSe = 0.83 eV), the Mn-doped sample exhibits a higher-energy NIR band at 1.28 eV (hvSE), which is absent for the undoped sample. This band emerges due to radiative spin-flip relaxation of the excited Mn ion which produces a NIR photon and a PbSe-core-based exciton (see main article). Instantaneous emission spectra of the doped (c) and the undoped (d) sample obtained from ‘a’ and ‘b’, respectively, by ‘slicing’ the two-dimensional plots at 10 ns. These spectra have been corrected for energy-dependent sensitivity of the detection system used in the measurements. The experimental spectra are fitted to Gaussian bands whose centres yield the positions of the PbSe core emission (hvPbSe, red) and the spin-exchange band (hvSE1, green). The Mn-doped QDs show both the hvPbSe and hvSE1 features, whereas the undoped QDs exhibit only the hvPbSe band. Source data
Extended Data Fig. 6
Extended Data Fig. 6. The PL excitation spectrum of the spin-exchange hvSE1 band.
The intensity of the hvSE1 PL band (sample Mn-1) as a function of hvp for constant excitation level 〈Nph〉 < 1 (green squares). This dependence shows a sharp onset at ~2.36 eV (dashed red line), which is close to the energy of the CdSe-shell-based exciton (hvCdSe = 2.38 eV). Source data

Similar articles

Cited by

References

    1. Werner JH, Kolodinski S, Queisser HJ. Novel optimization principles and efficiency limits for semiconductor solar cells. Phys. Rev. Lett. 1994;72:3851–3854. - PubMed
    1. Nozik AJ. Quantum dot solar cells. Phys. E. 2002;14:115–120.
    1. Padilha LA, et al. Carrier multiplication in semiconductor nanocrystals: influence of size, shape, and composition. Acc. Chem. Res. 2013;46:1261–1269. - PubMed
    1. Klimov VI. Multicarrier interactions in semiconductor nanocrystals in relation to the phenomena of Auger recombination and carrier multiplication. Ann. Rev. Condens. Matter Phys. 2014;5:285–316.
    1. Schaller RD, Klimov VI. High efficiency carrier multiplication in PbSe nanocrystals: implications for solar energy conversion. Phys. Rev. Lett. 2004;92:186601. - PubMed