Markers of right ventricular dysfunction predict 30-day adverse prognosis of pulmonary embolism on pulmonary computed tomographic angiography
- PMID: 37443496
- PMCID: PMC10344539
- DOI: 10.1097/MD.0000000000034304
Markers of right ventricular dysfunction predict 30-day adverse prognosis of pulmonary embolism on pulmonary computed tomographic angiography
Abstract
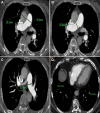
To investigate the value of parameters of the pulmonary artery and right ventricular function in predicting the 30-day poor prognosis of patients with acute pulmonary embolism (APE). The heart rate, respiratory rate, systolic blood pressure, Wells score for APE, history of recent operation or immobilization, history of cancer, respiratory failure, smoking were significantly (P < .05) different among the control, good prognosis, and poor prognosis groups. The maximal short diameter of the right and left ventricle (RVD/LVD) ratio (P < .001) and left pulmonary artery (LPA) (P = .01) were significantly different between the good and poor prognosis groups. Systolic blood pressure (odds ratio [OR]: 0.98, P = .045) and the RVD/LVD ratio (OR: 12.57, P = .02) were significant independent risk factors for poor prognosis. The risk for poor prognosis significantly increased when the RVD/LVD ratio was >1.11 (cutoff value) with the area under the curve (AUC) of 0.71 (95% confidence interval [CI]: 0.61-0.80, P < .001). LPA (OR: 9.12, P = .01) and RVD/LVD (OR: 4.62, P = .012) were the significant independent risk factors for poor prognosis in the central pulmonary embolism. The LPA of 2.1 cm had the highest predictive value for poor prognosis in the central APE (AUC: 0.68; sensitivity 84.6%; specificity 53.1%). The RVD/LVD ratio and systolic blood pressure are significant risk factors for short-term prognosis in patients with APE. When the LPA is >2.1 cm in the central APE or the RVD/LVD is >1.11, the risk of poor prognosis increases, which can be used as important indicators for predicting the prognosis of patients with APE. Two hundred forty-three APE patients and 61 patients without APE who underwent computed tomographic pulmonary angiography (CTPA) were retrospectively enrolled as the experimental and the control group, respectively. APE patients who were followed up at the 30-day time point were divided into the good prognosis (n = 195) and poor prognosis group (n = 32). The main pulmonary artery (MPA) to the aorta (AO) ratio, maximal diameter of the LPA and right pulmonary artery (RPA), ratio of the RVD/LVD and the height and volume of the pulmonary artery (PAh and PAV, respectively) were analyzed after indexing to the body surface area.
Copyright © 2023 the Author(s). Published by Wolters Kluwer Health, Inc.
Conflict of interest statement
The authors have no conflicts of interest to disclose.
Figures


References
-
- Konstantinides SV, Meyer G, Becattini C, et al. 2019 ESC Guidelines for the diagnosis and management of acute pulmonary embolism developed in collaboration with the European Respiratory Society (ERS). Eur Heart J. 2020;41:543–603. - PubMed
-
- Konstantinides SV, Torbicki A, Agnelli G, et al. 2014 ESC guidelines on the diagnosis and management of acute pulmonary embolism. Eur Heart J. 2014;35:3033–69, 3069a. - PubMed
-
- Agnelli G, Becattini C. Acute pulmonary embolism. N Engl J Med. 2010;363:266–74. - PubMed
-
- Zhang LJ, Lu GM, Meinel FG, et al. Computed tomography of acute pulmonary embolism: state-of-the-art. Eur Radiol. 2015;25:2547–57. - PubMed
MeSH terms
LinkOut - more resources
Full Text Sources
Medical
Research Materials
Miscellaneous

