. 2023 Jul 4;13(13):2270.
doi: 10.3390/diagnostics13132270.

Urinary Metabolomic Analysis of Prostate Cancer by UPLC-FTMS and UPLC-Ion Trap MSn

Affiliations

Urinary Metabolomic Analysis of Prostate Cancer by UPLC-FTMS and UPLC-Ion Trap MSn

Chien-Lun Chen et al. Diagnostics (Basel). .

Abstract

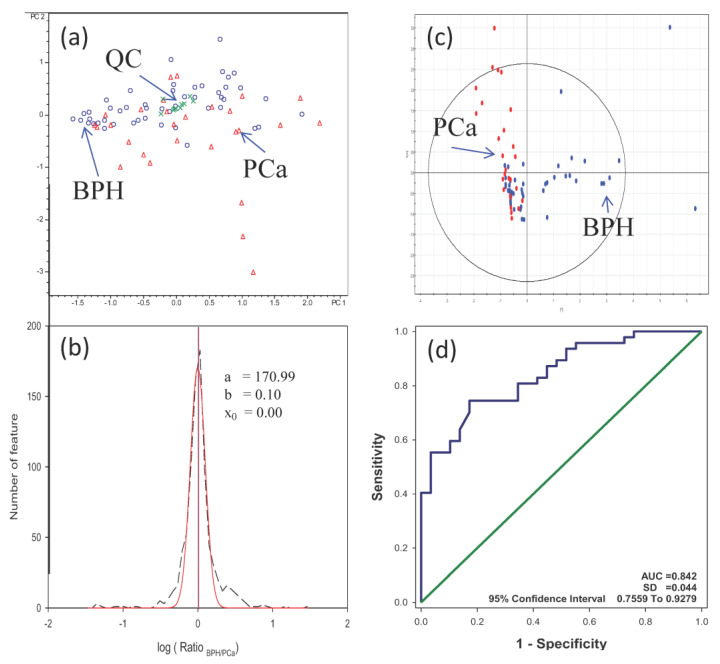
Accumulative evidence suggests metabolic disorders correlate with prostate cancer. Metabolic profiling of urine allows the measurement of numerous metabolites simultaneously. This study set up a metabolomic platform consisting of UPLC-FTMS and UPLC-ion trap MSn for urine metabolome analysis. The platform improved retention time, mass accuracy, and signal stability. Additionally, the product ion spectrum obtained from ion trap MSn facilitated structure elucidation of candidate metabolites, especially when authentic standards were not available. Urine samples from six hernia patients and six BPH patients were used for the initial establishment of the analytic platform. This platform was further employed to analyze the urine samples of 27 PCa and 49 BPH patients. Choosing the upper and lower 16% of metabolites, 258 metabolite candidates were selected. Twenty-four of them with AUC values larger than 0.65 were further selected. Eighteen of the twenty-four features can be matched in METLIN and HMDB. Eleven of the eighteen features can be interpreted by MSn experiments. They were used for the combination achieving the best differential power. Finally, four metabolites were combined to reach the AUC value of 0.842 (CI 95, 0.7559 to 0.9279). This study demonstrates the urinary metabolomic analysis of prostate cancer and sheds light on future research.

Keywords: biomarker; prostate cancer; urinary metabolomics.


Conflict of interest statement

The authors declare no conflict of interest.

Figures

Figure 1
Figure 1
Workflow for urinary metabolomic analysis by integration of UPLC-FTMS and UPLC-ion trap. The numbers in the parenthesis indicated the feature numbers after the filtration by different criteria. Colors in the embedded image 2 indicate grouping during analysis.
Figure 2
Figure 2
(a) A diagram of 11 data points describing a peak. According to the Savitzky–Golay smoothing filtering method, an LC peak needs at least 11 data points to describe its sharpness for quantitation. Ten data points are used for peak description and one point for the baseline determination. (b) When the data points are only five points for an LC peak, the data points can still keep the peak sharp, but the ability to find the shoulder peak will be lost. (c) If the data points are less than 5 points, for example, 4 data points, the peak will broaden, and the peak sensitivity will decrease after smoothing. The light blue dot line delineates the original sharp peak, and the dark blue solid line denotes the simulated peak after the data points are reduced. (d) An actual peak detected in our UPLC-FT MS system. Six data points were recorded for the LC peak.
Figure 3
Figure 3
(a) A typical base peak chromatogram of BPH urine. The four arrows indicate the retention times of four selected features. They were m/z 205.0685, 334.1126, 551.2124, and 407.2798 at retention times of 2.2, 10.3, 12.1, and 16.8 min, respectively. These four features are different in retention times, molecular weights, and ion intensities. They were used to evaluate the stability of the UPLC-FTMS. They were finally identified as D-mannitol, N2, N2-dimethylguanosine, phenylacetyl L-glutamine, and 7-ketodeoxycholic acid, respectively. The detected parameters are listed. (b) The PCA plot of BPH and Her urines. The symbol (Δ) denotes BPH, (x) Her, and (O) QC. The QC was made by mixing an equal amount of each urine sample.
Figure 4
Figure 4
(a) The PCA plot of 27 PCa and 49 BPH urine samples. The symbol (Δ) denotes PCa, (O) BPH, and (Χ) QC. (b) The ratio distribution of 441 features. The distribution was fitted by the Gaussian distribution Curve; the three parameters were a: 170.99, b: 0.10, and x0: −0.0008. b was equal to one standard deviation of the curve, and x0 was the shift of the fitted curve to 0 (log1); (c) the reconstructed PCA plot made by four metabolites in PCa and BPH urines. The red spots denote PCa, and the blue spots denote BPH. (d) The ROC curve was calculated by the combination of four metabolites.
Figure 5
Figure 5
(a) The product ion spectrum of m/z 334.1 ion. (b) The product ion spectrum of N2, N2-dimethylganosine.
Figure 6
Figure 6
(a) The product ion spectrum of m/z 459.3 ion; (b) the interpretations of the fragmentation of m/z 459.3 ion and the fragmentation of the m/z 367.1 product ion. The chirality of molecular structure was not indicated. (c) The MS3 spectrum of m/z 459.3 to 367 ions. The m/z 459.3 ion was tentatively assigned as the Vitamin D3 derivative, but the side chain cannot be determined by MSn experiments.

References

    1. Sung H., Ferlay J., Siegel R.L., Laversanne M., Soerjomataram I., Jemal A., Bray F. Global Cancer Statistics 2020: GLOBOCAN Estimates of Incidence and Mortality Worldwide for 36 Cancers in 185 Countries. CA Cancer J. Clin. 2021;71:209–249. doi: 10.3322/caac.21660. - DOI - PubMed
    1. Siegel R.L., Miller K.D., Fuchs H.E., Jemal A. Cancer statistics, 2022. CA Cancer J. Clin. 2022;72:7–33. doi: 10.3322/caac.21708. - DOI - PubMed
    1. De Nunzio C., Aronson W., Freedland S.J., Giovannucci E., Parsons J.K. The correlation between metabolic syndrome and prostatic diseases. Eur. Urol. 2012;61:560–570. doi: 10.1016/j.eururo.2011.11.013. - DOI - PubMed
    1. Takyi E.E., Fuller D.J., Donaldson L.J., Thomas G.H. Deoxyribonucleic acid and polyamine synthesis in rat ventral prostrate. Effects of age of the intact rat and androgen stimulation of the castrated rat with testosterone, 5 alpha-dihydrotestosterone and 5 alpha-androstane-3 beta, 17 beta-diol. Biochem. J. 1977;162:87–97. doi: 10.1042/bj1620087. - DOI - PMC - PubMed
    1. Schick F., Bogers H., Kurz S., Jung W.I., Pfeffer M., Lutz O. Localized proton MR spectroscopy of citrate in vitro and of the human prostate in vivo at 1.5 T. Magn. Reson. Med. 1993;29:38–43. doi: 10.1002/mrm.1910290109. - DOI - PubMed