. 2023 Jun 26;12(13):1723.
doi: 10.3390/cells12131723.

Interactions between the Astrocytic Volume-Regulated Anion Channel and Aquaporin 4 in Hyposmotic Regulation of Vasopressin Neuronal Activity in the Supraoptic Nucleus

Affiliations

Interactions between the Astrocytic Volume-Regulated Anion Channel and Aquaporin 4 in Hyposmotic Regulation of Vasopressin Neuronal Activity in the Supraoptic Nucleus

Yang Liu et al. Cells. .

Abstract

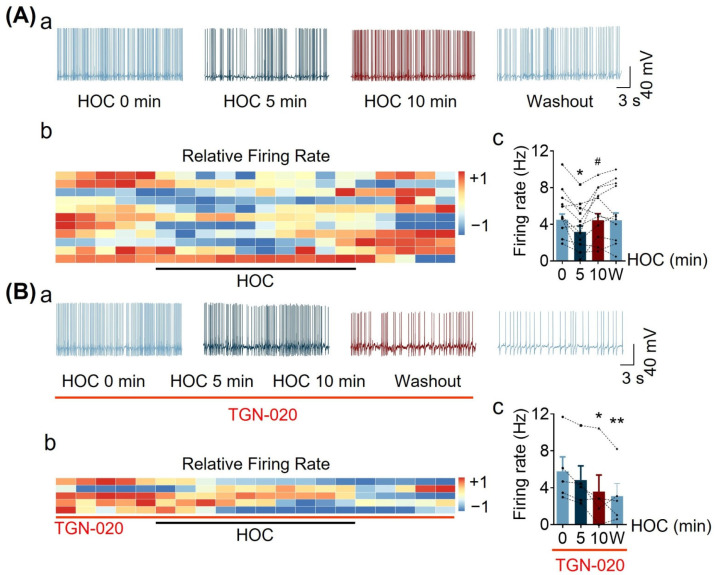
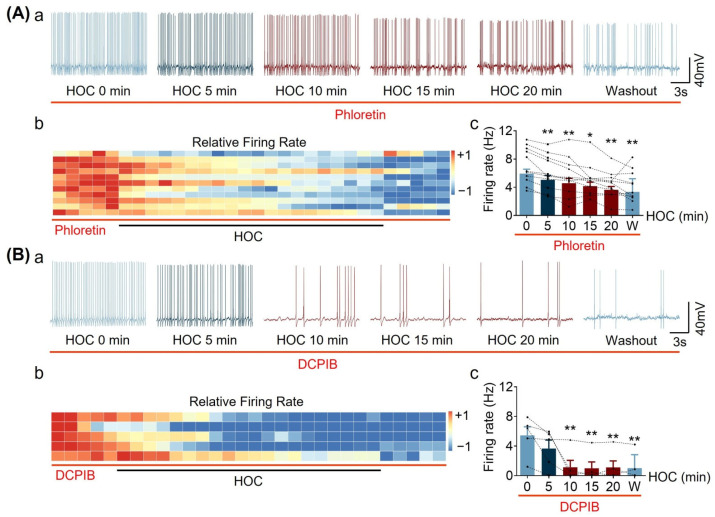
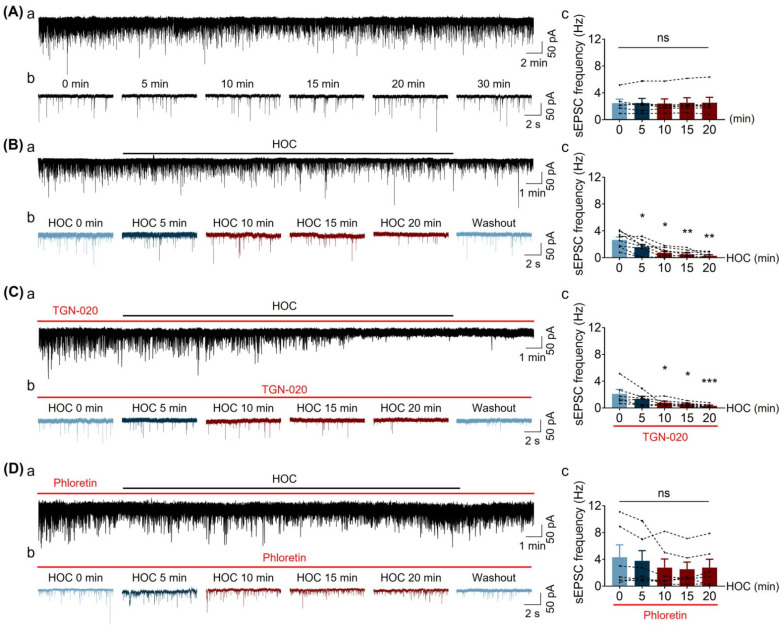
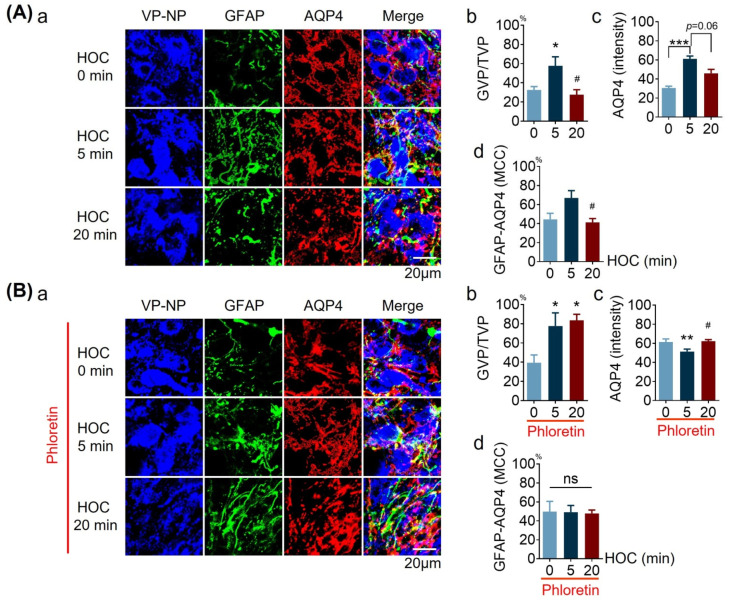
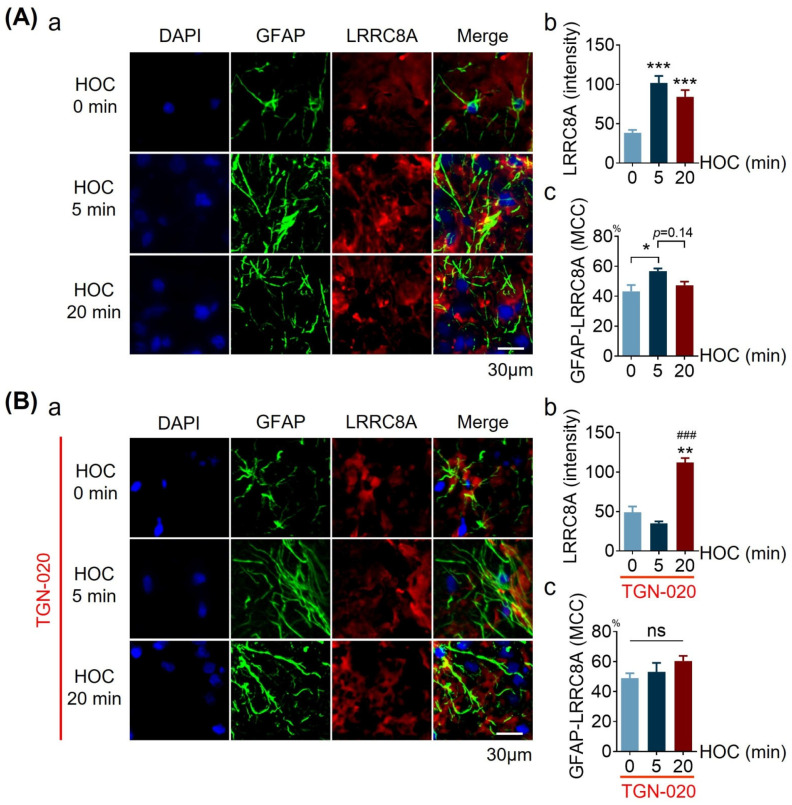
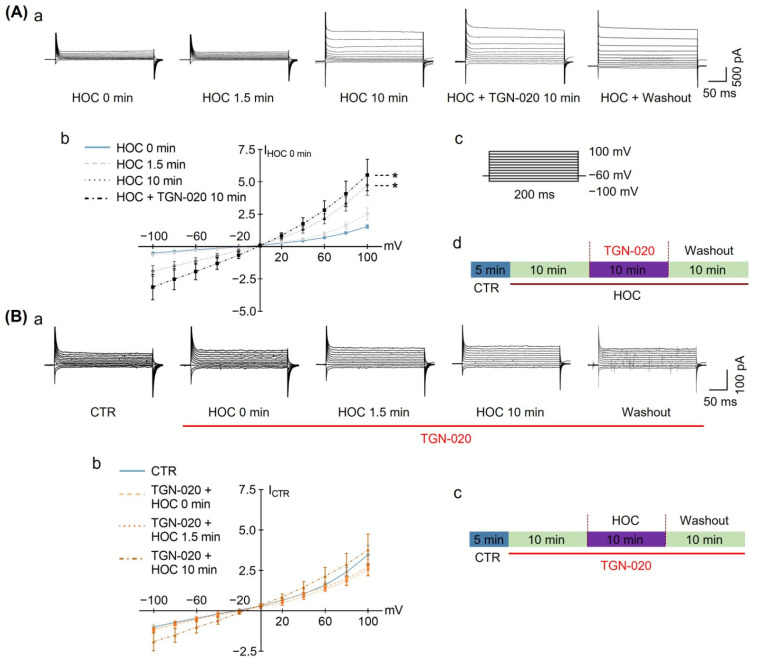
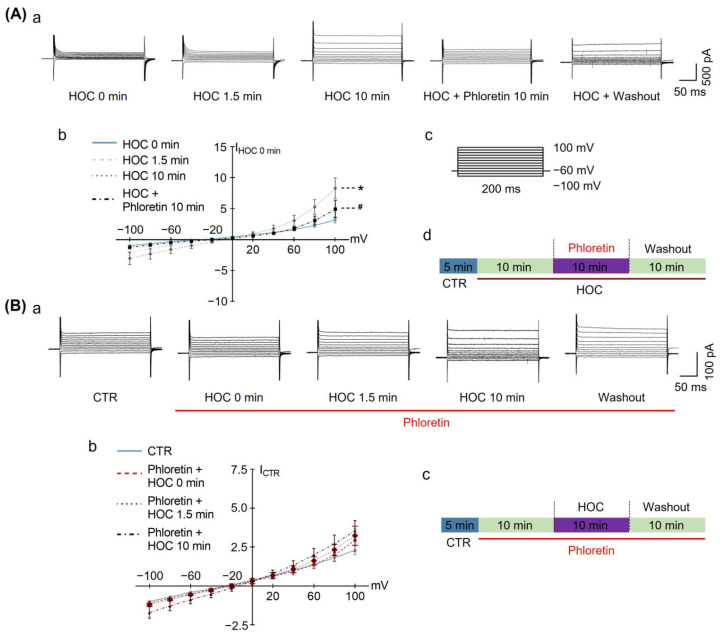
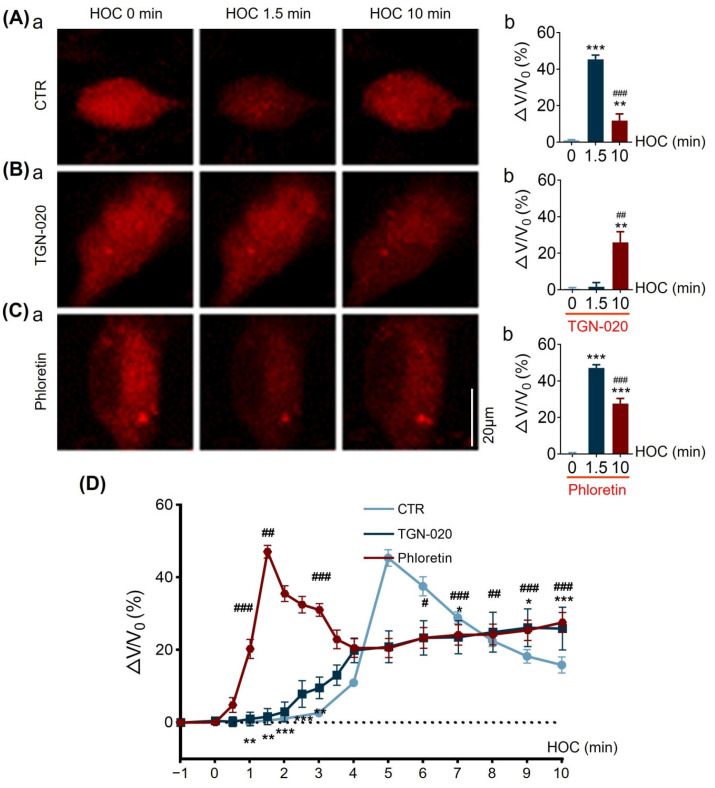
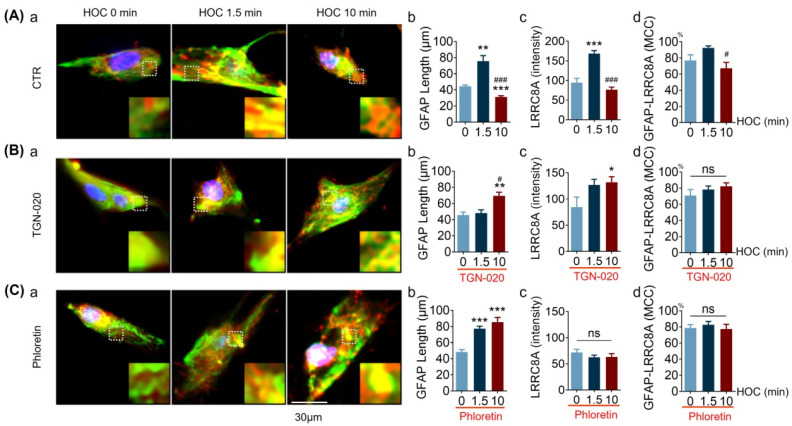
We assessed interactions between the astrocytic volume-regulated anion channel (VRAC) and aquaporin 4 (AQP4) in the supraoptic nucleus (SON). Acute SON slices and cultures of hypothalamic astrocytes prepared from rats received hyposmotic challenge (HOC) with/without VRAC or AQP4 blockers. In acute slices, HOC caused an early decrease with a late rebound in the neuronal firing rate of vasopressin neurons, which required activity of astrocytic AQP4 and VRAC. HOC also caused a persistent decrease in the excitatory postsynaptic current frequency, supported by VRAC and AQP4 activity in early HOC; late HOC required only VRAC activity. These events were associated with the dynamics of glial fibrillary acidic protein (GFAP) filaments, the late retraction of which was mediated by VRAC activity; this activity also mediated an HOC-evoked early increase in AQP4 expression and late subside in GFAP-AQP4 colocalization. AQP4 activity supported an early HOC-evoked increase in VRAC levels and its colocalization with GFAP. In cultured astrocytes, late HOC augmented VRAC currents, the activation of which depended on AQP4 pre-HOC/HOC activity. HOC caused an early increase in VRAC expression followed by a late rebound, requiring AQP4 and VRAC, or only AQP4 activity, respectively. Astrocytic swelling in early HOC depended on AQP4 activity, and so did the early extension of GFAP filaments. VRAC and AQP4 activity supported late regulatory volume decrease, the retraction of GFAP filaments, and subside in GFAP-VRAC colocalization. Taken together, astrocytic morphological plasticity relies on the coordinated activities of VRAC and AQP4, which are mutually regulated in the astrocytic mediation of HOC-evoked modulation of vasopressin neuronal activity.

Keywords: LRRC8A; aquaporin 4; glial fibrillary acidic protein; regulatory volume decrease; volume-regulated anion channels.


Conflict of interest statement

The authors have no conflict of interest to declare.

Figures

Figure 1
Figure 1
Effect of TGN-020, an aquaporin 4 (AQP4) blocker, on hyposmotic challenge (HOC) -modulated vasopressin (VP) neuronal firing activity in acute supraoptic nucleus (SON) slices. (A) Time course of changes in the firing rate of VP neurons using whole-cell patch-clamp recordings. (a) Representative episodes of VP neuronal firing activity at different stages of HOC. (b) Heatmap of the relative firing rate of VP neurons at different stages of HOC (+1 represents the highest frequency of firing rate, −1 represents the lowest frequency of firing rate; each strip represents a recording from a single neuron). (c) Bar graphs showing average VP neuronal firing rates at different stages of HOC. Data from individual neurons are shown by line-connected points. Abscissa indicates time (in minutes of HOC) (n = 11; *, p < 0.05 compared with 0 min HOC; #, p < 0.05 compared with 5 min HOC; ANOVA, Sidak). (B) Effect of TGN-020 (10 μmol/L) on the time-dependent changes in the firing rate of VP neurons under HOC in representative recording episodes. (a) Heatmap of relative firing rate (b) and summary bar graphs ((c), n = 5; *, p < 0.05, **, p < 0.01 compared with 0 min HOC; ANOVA, Sidak). Abbreviations: W, washout (isosmotic condition).
Figure 2
Figure 2
Effect of volume-regulated anion channel (VRAC) blockers, phloretin or DCPIB, on HOC-modulated electrical activity of VP neurons in acute SON slices. (A). Changes in the HOC-mediated time-dependent firing rate of VP neurons in the presence of 30 μmol/L phloretin in whole−cell patch-clamp recordings: (a) representative episodes of VP neuronal firing activity; (b) heatmap of the relative firing rate; and (c) bar graphs of average VP neuronal firing rates and data from individual neurons shown by line-connected points (n = 11; *, p < 0.05; **, p < 0.01 compared with 0 min HOC; ANOVA, Bonferroni. (B). Changes in the HOC-modulated time-dependent firing activity of VP neurons in the presence of 20 μmol/L DCPIB: (ac), annotation as in (A); ((c), n = 5; **, p < 0.01, compared with 0 min HOC; ANOVA, Sidak). For other annotations and abbreviations, refer to Figure 1.
Figure 3
Figure 3
Effect of TGN-020 or phloretin on spontaneous excitatory postsynaptic current (sEPSC) frequency of VP neurons during HOC in acute SON slices. (A). Representative sEPSCs from VP neurons at rest recorded in the whole-cell voltage clamp mode in continuous recording ((a), Vh= −70 mV) or in recording episodes (b) and summary of average sEPSC frequency ((c), n = 6; ANOVA, Bonferroni). (B). sEPSCs from VP neurons at various time points of HOC in continuous recording or in recording episodes (a,b), respectively and summary of average sEPSC frequency ((c), n = 8; *, p < 0.05; **, p < 0.01 compared with 0 min HOC; ANOVA, Bonferroni). (C). sEPSCs from VP neurons at various time points during HOC (a,b) and summary of average sEPSC frequency ((c), n = 6; *, p < 0.05; ***, p < 0.005 compared with 0 min; ANOVA, Bonferroni) in the presence of 10 μmol/L TGN-020. (D). sEPSCs from VP neurons at various time points during HOC (a,b) and summary of average sEPSC frequency ((c), n = 6; ANOVA, Bonferroni) in the presence of 30 μmol/L phloretin. Total duration of each recording from individual cells in (A)a, (B)a, (C)a, and (D)a is 40 min. Abbreviations: sEPSC, excitatory postsynaptic currents; ns, non-significant. For other annotations and abbreviations, refer to Figure 1.
Figure 4
Figure 4
Effects of phloretin on GFAP filament distribution, AQP4 expression, and their colocalization during HOC in acute SON slices. (A,B). Confocal microscopy of immunohistochemistry: (a) VP-NP (blue), GFAP (green), AQP4 (red), and merged images at different stages of HOC without (A) and with 30 μmol/L phloretin (B). Bar graphs summarizing the proportion of VP neuronal somata surrounded by GFAP filaments (GVP) relative to total number of VP neurons (TVP, (b)), the staining intensity of AQP4 (c), and the MCC for GFAP and AQP4 (d), respectively. Scale bars =20 µm; *, p < 0.05 compared with 0 min; HOC #, p < 0.05; **, p < 0.01; ***, p < 0.005 compared with 5 min HOC; ANOVA (Bonferroni for (A)b, (B)b and (B)d; Dunn for (A)c, (A)d and (B)c). Abbreviations: AQP4, aquaporin 4; GFAP, glial fibrillary acidic protein; MCC, Manders’ colocalization coefficient; ns, non-significant; VP, vasopressin; VP-NP, VP neurophysin stain; other annotations as in Figure 1.
Figure 5
Figure 5
Effects of blocking AQP4 on HOC-evoked increase in LRRC8A expression and its colocalization with GFAP in acute SON slices. (A,B). Confocal microscopy of immunohistochemistry of nuclei (DAPI; blue), GFAP (green), and LRRC8A (red) in (a), and at different times of HOC without (A) and with 10 μmol/L TGN-020 (B). Bar graphs summarizing the staining intensity of LRRC8A (b) and the MCC for GFAP and LRRC8A (c) at different times of HOC. Scale bars = 30 µm; in A, n = 6; *, p < 0.05, **, p < 0.01, and ***, p < 0.005 compared with 0 min HOC (ANOVA, Dunn); in (B), n = 10; ***, p < 0.005 compared with 0 min HOC; ###, p < 0.001 compared with 5 min HOC (ANOVA, Dunn). Abbreviations: LRRC8A, leucine-rich repeat-containing protein 8A; other annotations as in Figure 1 and Figure 4.
Figure 6
Figure 6
Effects of phloretin on HOC-evoked astrocytic VRAC currents. (A). HOC-evoked VRAC currents in astrocytes at late HOC stages (a) are dampened by subsequent application of 30 μmol/L of phloretin. (b) Relative current−voltage curves obtained from astrocytes under different conditions normalized to currents recorded just prior to the HOC onset (IHOC 0 min; n = 7; *, p < 0.05, compared with 0 min HOC; #, p < 0.05, compared with 10 min HOC; ANOVA, Bonferroni). (c) A series of voltage steps, initiated from a holding potential of −60 mV, were used to test for VRAC currents in astrocytes. (d) Schematics of liquid perfusion protocol. (B). Pre-application of 30 μmol/L phloretin occludes the development of HOC-evoked VRAC currents in astrocytes (a). (b) Relative current-voltage curves obtained from astrocytes under different conditions, normalized to current at control conditions (ICTR; n = 6; ANOVA, Bonferroni). (c) Schematics of liquid perfusion protocol. Other annotations as in Figure 1.
Figure 7
Figure 7
Effects of TGN-020 on HOC-evoked VRAC currents in cultured hypothalamic astrocytes. (A). (a) HOC-evoked VRAC currents in astrocytes, after developing HOC for 10 min, are not affected by subsequent application of 10 μmol/L TGN-020; (b) Current-voltage curves of outwardly rectifying VRAC currents obtained from astrocytes under different conditions, normalized to currents recorded just prior to the HOC onset (I HOC 0 min; n = 12; *, p < 0.05, compared with 0 min HOC; #, p < 0.05, compared with 10 min HOC; ANOVA, Bonferroni). (c) A series of voltage steps, initiated from a holding potential of −60 mV, were used to test for VRAC currents in astrocytes. (d) Schematics of liquid perfusion protocol. (B). (a) Pre-application of 10 μmol/L of TGN-020 occluded development of HOC-evoked VRAC currents in astrocytes. (b) Current-voltage curves obtained from astrocytes under different conditions, normalized to current in control conditions (ICTR) (n = 6; ANOVA, Bonferroni). (c) Schematics of liquid perfusion protocol. Other annotations as in Figure 1 and Figure 6.
Figure 8
Figure 8
TGN-20 or phloretin causes a distinct effect of HOC-evoked volemic changes in cultured hypothalamic astrocytes. (AC). Fluorescence images of sulforhodamine 101 (SR101)-loaded astrocytic somata showing fluorescence intensity decrease, which report on relative volume increase (∆V/V0) during HOC under control conditions (CTR; (A)), or in the presence of 10 μmol/L of TGN-020 (B) or 30 μmol/L of phloretin (C) at different time points (a). The corresponding summarizing bar graphs showing average changes (b). TGN-020 or phloretin is applied at 1 min prior to HOC and then kept throughout HOC. Scale bar = 20 μm; CTR, n = 43; TGN-020, n = 14; phloretin, n = 54; **, p < 0.01; ***, p < 0.005, compared with 0 min HOC; ##, p < 0.01; ###, p < 0.005, compared with 1.5 min HOC; ANOVA, Dunn. (D) Summary of time lapse of volume changes showing distinct effects of TGN-020 (*, p < 0.05; **, p < 0.01; ***, p < 0.005 compared with CTR; ANOVA, Sidak) or phloretin (#, p < 0.05; ##, p < 0.01; ###, p < 0.005 compared with CTR; ANOVA, Sidak). Dotted line in extrapolation of the initial volume in CTR.
Figure 9
Figure 9
TGN-20 or phloretin cause distinct effects on HOC-evoked GFAP filament length, LRRC8A expression, and GFAP-LRRC8A colocalization in cultured hypothalamic astrocytes. (AC). Representative fluorescence images of GFAP (green), LRRC8A (red), and nuclei (blue, DAPI) at 0, 1.5, and 10 min HOC (a) in CTR ((A); n = 20, 15, and 10, respectively), 10 μmol/L of TGN-020 ((B); n = 17, 26, and 23, respectively), or 30 μmol/L of phloretin ((C); n = 20, 39, and 29, respectively). GFAP filament length (b), expression, i.e., staining/fluorescence intensity, of LRRC8A (c), and the MCC of GFAP with LRRC8A (d), respectively. Scale bar = 30 µm; *, p < 0.05, **; p < 0.01, ***, p < 0.005 compared with 0 min HOC; #, p < 0.05, ###, p < 0.005 compared with 1.5 min HOC; ANOVA, (Bonferroni for (C)b; Sidak for (A)c, (B)c, and (C)c; Dunn’s for (A)b, (A)d, (B)b, (B)d, and (D)d). Other annotations as in Figure 5.

Similar articles

Cited by

References

    1. Ransom B.R., Ransom C.B. Astrocytes: Multitalented stars of the central nervous system. Methods Mol. Biol. 2012;814:3–7. doi: 10.1007/978-1-61779-452-0_1. - DOI - PubMed
    1. Kohler S., Winkler U., Hirrlinger J. Heterogeneity of Astrocytes in Grey and White Matter. Neurochem. Res. 2021;46:3–14. doi: 10.1007/s11064-019-02926-x. - DOI - PubMed
    1. Zorec R., Parpura V., Verkhratsky A. Astroglial vesicular network: Evolutionary trends, physiology and pathophysiology. Acta Physiol. 2017;222:e12915. doi: 10.1111/apha.12915. - DOI - PMC - PubMed
    1. Escartin C., Galea E., Lakatos A., O’Callaghan J.P., Petzold G.C., Serrano-Pozo A., Steinhauser C., Volterra A., Carmignoto G., Agarwal A., et al. Reactive astrocyte nomenclature, definitions, and future directions. Nat. Neurosci. 2021;24:312–325. doi: 10.1038/s41593-020-00783-4. - DOI - PMC - PubMed
    1. Wang S.C., Parpura V., Wang Y.F. Astroglial Regulation of Magnocellular Neuroendocrine Cell Activities in the Supraoptic Nucleus. Neurochem. Res. 2021;46:2586–2600. doi: 10.1007/s11064-020-03172-2. - DOI - PMC - PubMed

Publication types

LinkOut - more resources