. 2023 Jun 27;12(13):1732.
doi: 10.3390/cells12131732.

Allyl Isothiocianate Induces Ca2+ Signals and Nitric Oxide Release by Inducing Reactive Oxygen Species Production in the Human Cerebrovascular Endothelial Cell Line hCMEC/D3

Affiliations

Allyl Isothiocianate Induces Ca2+ Signals and Nitric Oxide Release by Inducing Reactive Oxygen Species Production in the Human Cerebrovascular Endothelial Cell Line hCMEC/D3

Roberto Berra-Romani et al. Cells. .

Abstract

Nitric oxide (NO) represents a crucial mediator to regulate cerebral blood flow (CBF) in the human brain both under basal conditions and in response to somatosensory stimulation. An increase in intracellular Ca2+ concentrations ([Ca2+]i) stimulates the endothelial NO synthase to produce NO in human cerebrovascular endothelial cells. Therefore, targeting the endothelial ion channel machinery could represent a promising strategy to rescue endothelial NO signalling in traumatic brain injury and neurodegenerative disorders. Allyl isothiocyanate (AITC), a major active constituent of cruciferous vegetables, was found to increase CBF in non-human preclinical models, but it is still unknown whether it stimulates NO release in human brain capillary endothelial cells. In the present investigation, we showed that AITC evoked a Ca2+-dependent NO release in the human cerebrovascular endothelial cell line, hCMEC/D3. The Ca2+ response to AITC was shaped by both intra- and extracellular Ca2+ sources, although it was insensitive to the pharmacological blockade of transient receptor potential ankyrin 1, which is regarded to be among the main molecular targets of AITC. In accord, AITC failed to induce transmembrane currents or to elicit membrane hyperpolarization, although NS309, a selective opener of the small- and intermediate-conductance Ca2+-activated K+ channels, induced a significant membrane hyperpolarization. The AITC-evoked Ca2+ signal was triggered by the production of cytosolic, but not mitochondrial, reactive oxygen species (ROS), and was supported by store-operated Ca2+ entry (SOCE). Conversely, the Ca2+ response to AITC did not require Ca2+ mobilization from the endoplasmic reticulum, lysosomes or mitochondria. However, pharmacological manipulation revealed that AITC-dependent ROS generation inhibited plasma membrane Ca2+-ATPase (PMCA) activity, thereby attenuating Ca2+ removal across the plasma membrane and resulting in a sustained increase in [Ca2+]i. In accord, the AITC-evoked NO release was driven by ROS generation and required ROS-dependent inhibition of PMCA activity. These data suggest that AITC could be exploited to restore NO signalling and restore CBF in brain disorders that feature neurovascular dysfunction.

Keywords: Ca2+ signalling; allyl isothiocianate; hCMEC/D3; nitric oxide; plasma membrane Ca2+-ATPase; reactive oxygen species; store-operated Ca2+ entry.


Conflict of interest statement

The authors declare no conflict of interest.

Figures

Figure 1
Figure 1
AITC-evoked Ca2+-dependent NO release in hCMEC/D3 cells. (A) AITC (30 µM) evoked a slow-rising increase in DAF-FM fluorescence, which reflected NO release and was inhibited by L-NIO (50 µM, 1 h) and BAPTA (20 µM, 2 h). In this and the following figures, AITC has been administered at the time indicated by the black bar that has been drawn above the NO, Ca2+, or ROS tracings. (B) Mean ± SE of the amplitude of AITC-evoked NO release in the absence (Ctrl) or in the presence of L-NIO or BAPTA. One-way ANOVA followed by the post hoc Dunnett’s test: **** p < 0.0001. Ctrl: control. NR: no response.
Figure 2
Figure 2
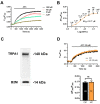
AITC elicits TRPA1-independent Ca2+ signals in hCMEC/D3 cells. (A) Intracellular Ca2+ signals evoked by increasing concentrations of AITC in hCMEC/D3 cells. The [Ca2+]i never returned to the baseline upon agonist washout. The baseline of the Ca2+ responses has been slightly shifted to avoid tracing overlapping. (B) Dose-response relationship of the amplitude of AITC-evoked Ca2+ signals. The sigmoidal line that fits the dose -response curve was obtained by using Equation (1). (C) TRPA1 protein expression in hCMEC/D3 cells. Blots representative of four independent experiments are shown. Major bands of the expected molecular weights are indicated. (D) Upper panel, AITC-evoked Ca2+ signals were not inhibited by blocking TRPA1 with HC-030031 (30 µM). Lower panel, mean ± SE of the amplitude of AITC-evoked NO in the absence (Ctrl) and presence of HC-030031 (HC). NS: not significant, Student’s t-test.
Figure 3
Figure 3
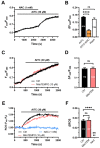
Cytosolic ROS drive AITC-evoked Ca2+ signals in hCMEC/D3 cells. (A) Intracellular Ca2+ signals evoked by AITC (30 µM) were dampened by the antioxidant NAC (1 mM, 1 h). NAC washout from the perfusate caused a further AITC-dependent elevation in [Ca2+]i. (B) Mean ± SE of the amplitude of the Ca2+ signals evoked by AITC in the absence (AITC) or in the presence of NAC (AITC+NAC) and upon AITC washout from the perfusate (Wash). One-way ANOVA followed by the post hoc Dunnett’s test: **** p < 0.0001. NS: not significant. (C) Intracellular Ca2+ signals evoked by AITC (30 µM) were not affected by scavenging mitochondrial ROS with MitoTEMPO (MitoTEM; 10 µM, 1 h). (D) Mean ± SE of the amplitude of AITC-evoked Ca2+ signals in the absence (Ctrl) or in the presence of MitoTEMPO (MitoTEM). NS: not significant, Student’s t-test. Ctrl: control. (E) AITC (30 µM) evoked robust ROS production in hCMEC/D3 cells that was sensitive to NAC (1 mM), but not to MitoTEMPO (MitoTEM; 10 µM). (F) Mean ± SE of the amplitude of AITC-evoked Ca2+ signals in the absence (Ctrl) or in the presence of MitoTEMPO (MitoTEM) or NAC. One-way ANOVA followed by the post hoc Dunnett’s test: **** p < 0.0001. NR: no response.
Figure 4
Figure 4
AITC-evoked Ca2+ signals require SOCE but not intracellular Ca2+ release. (A) Intracellular Ca2+ signals evoked by AITC (30 µM) were dampened in the absence of extracellular Ca2+ (0Ca2+). (B) Mean ± SE of the amplitude of AITC-evoked Ca2+ signals in the presence (Ca2) or in the absence of extracellular Ca2 (0Ca2). Student’s t-test: *** p < 0.001. (C) Intracellular Ca2+ signals evoked by AITC (30 µM) were dampened upon SOCE inhibition with BTP-2 (20 µM, 20 min), La3+ (10 µM, 20 min) and Gd3+ (10 µM, 20 min). Removal of each inhibitor from the perfusate caused a further AITC-dependent elevation in [Ca2+]i. (D) Mean ± SE of the amplitude of AITC-evoked Ca2+ signals under the following conditions: in the absence of any inhibitor (Ctrl); in the presence of BTP-2 (BTP-2) or after BTP-2 washout from the perfusate (Wash); in the presence of La3+ (La3+) or after La3+ washout from the perfusate (Wash); and in the presence of Gd3+ (Gd3+) or after Gd3+ washout from the perfusate (Wash). One-way ANOVA followed by the post hoc Dunnett’s test: **** p < 0.0001; *** p < 0.001. (E) AITC (30 µM) still evoked robust intracellular Ca2+ signals in the presence of CPA (10 µM, 30 min), nigericin (Nig; 50 µM, 30 min), 2-APB (50 µM, 30 min) and FCCP (10 µM, 30 min). (F) Mean ± SE of the amplitude of AITC-evoked Ca2+ signals in the absence (Ctrl) or in the presence of 2-APB, nigericin (Nig), CPA or FCCP.
Figure 5
Figure 5
AITC-induced ROS production inhibits PMCA activity in hCMEC/D3 cells. (A) Intracellular Ca2+ release evoked by CPA (10 µM) in the absence (Ctrl) and presence of SEA0400 (10 µM, 30 min), VO3 (500 µM, 30 min), Ru360 (10 µM, 30 min) and AITC (30 µM). In the presence of VO3 or AITC, the [Ca2+]i did not return to the baseline, but rather decayed to a sustained plateau level. The baselines of the Ca2+ tracings have been overlapped for representative purposes. (B) Mean ± SE of the percentage change in the value of τ80-20 of CPA-evoked Ca2+ release in the absence (Ctrl) or in the presence of SEA0400, Ru360 or VO3. One-way ANOVA followed by the post hoc Dunnett’s test: **** p < 0.0001. NM: not measurable. (C) Mean ± SE of the amplitude of the long-lasting plateau evoked by CPA in the presence of VO3 or AITC. One-way ANOVA followed by the post hoc Dunnett’s test: **** p < 0.0001. NR: no response (i.e., no plateau arising). (D) Mean ± SE of the amplitude of CPA-evoked intracellular Ca2+ release in the absence (Ctrl) or in the presence of SEA0400, Ru360 or VO3. One-way ANOVA followed by the post hoc Dunnett’s test: **** p < 0.0001. (E) Exogenous administration of VO3 (500 µM), but not of SEA0400 (10 µM) or Ru360 (10 µM), caused a slow increase in [Ca2+]i that dampened the subsequent Ca2+ response to AITC (30 µM). (F) Mean ± SE of the amplitude of the Ca2+ signals evoked by AITC in the absence (Ctrl) or in the presence of SEA0400, Ru360 or VO3. One-way ANOVA followed by the post hoc Dunnett’s test: **** p < 0.0001. (G) Exogenous administration of H2O2 (100 µM) caused a slow increase in [Ca2+]i that dampened the subsequent Ca2+ response to AITC (30 µM). (H) Mean ± SE of the amplitude of the Ca2+ signals evoked by H2O2 (H2O2) or by AITC after H2O2 stimulation (AITC+ H2O2); Student’s t-test: **** p < 0.0001.
Figure 6
Figure 6
The role of AITC-evoked Ca2+ signals in AITC-induced NO release. (A) AITC (30 µM) evokes robust NO production in the absence (Ctrl), but not in the presence, of NAC (1 mM, 1 min), BTP-2 (20 µM, 20 min) and VO3 (500 µM, 30 min). (B) Mean ± SE of the amplitude of NO release induced by AITC in the absence (Ctrl) or in the presence of NAC (NAC), BTP-2 (BTP-2) or VO3. One-way ANOVA followed by the post hoc Dunnett’s test: **** p < 0.0001. (C) VO3 (500 µM) evokes robust NO production in the absence (Ctrl), but not in the presence, of BAPTA (20 µM, 2 h) or L-NIO (50 µM, 1 h). (D) Mean ± SE of the amplitude of NO release induced by VO3 in the absence (Ctrl) or in the presence of L-NIO (L-NIO) or BAPTA (BAPTA). One-way ANOVA followed by the post hoc Dunnett’s test: **** p < 0.0001. (E) Exogenous administration of H2O2 (100 µM) induces NO release in the absence (Ctrl), but not in the presence, of BAPTA (20 µM, 2 h) or L-NIO (50 µM, 1 h). (F) Mean ± SE of the amplitude of NO release induced by VO3 in the absence (Ctrl) or in the presence of L-NIO (L-NIO) or BAPTA (BAPTA). One-way ANOVA followed by the post hoc Dunnett’s test: **** p < 0.0001.

Similar articles

Cited by

References

    1. Schaeffer S., Iadecola C. Revisiting the neurovascular unit. Nat. Neurosci. 2021;24:1198–1209. doi: 10.1038/s41593-021-00904-7. - DOI - PMC - PubMed
    1. Longden T.A., Zhao G., Hariharan A., Lederer W.J. Pericytes and the Control of Blood Flow in Brain and Heart. Annu. Rev. Physiol. 2023;85:137–164. doi: 10.1146/annurev-physiol-031522-034807. - DOI - PMC - PubMed
    1. Longden T.A., Dabertrand F., Koide M., Gonzales A.L., Tykocki N.R., Brayden J.E., Hill-Eubanks D., Nelson M.T. Capillary K(+)-sensing initiates retrograde hyperpolarization to increase local cerebral blood flow. Nat. Neurosci. 2017;20:717–726. doi: 10.1038/nn.4533. - DOI - PMC - PubMed
    1. Longden T.A., Mughal A., Hennig G.W., Harraz O.F., Shui B., Lee F.K., Lee J.C., Reining S., Kotlikoff M.I., Konig G.M., et al. Local IP3 receptor-mediated Ca2+ signals compound to direct blood flow in brain capillaries. Sci. Adv. 2021;7:eabh0101. doi: 10.1126/sciadv.abh0101. - DOI - PMC - PubMed
    1. Thakore P., Alvarado M.G., Ali S., Mughal A., Pires P.W., Yamasaki E., Pritchard H.A., Isakson B.E., Tran C.H.T., Earley S. Brain endothelial cell TRPA1 channels initiate neurovascular coupling. eLife. 2021;10:e63040. doi: 10.7554/eLife.63040. - DOI - PMC - PubMed

Publication types

Substances

LinkOut - more resources